. 2024 Jun 13;14(1):13689.
doi: 10.1038/s41598-024-64524-4.

High-resolution adaptive optics-trans-scleral flood illumination (AO-TFI) imaging of retinal pigment epithelium (RPE) in central serous chorioretinopathy (CSCR)

Affiliations

High-resolution adaptive optics-trans-scleral flood illumination (AO-TFI) imaging of retinal pigment epithelium (RPE) in central serous chorioretinopathy (CSCR)

Vishal Govindahari et al. Sci Rep. .

Abstract

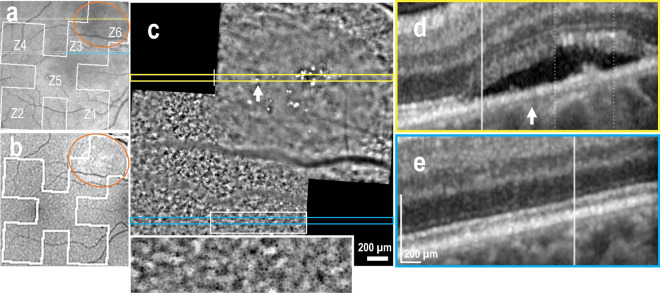
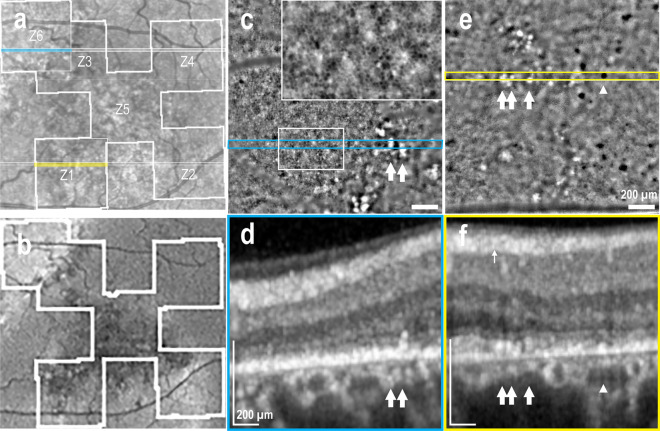
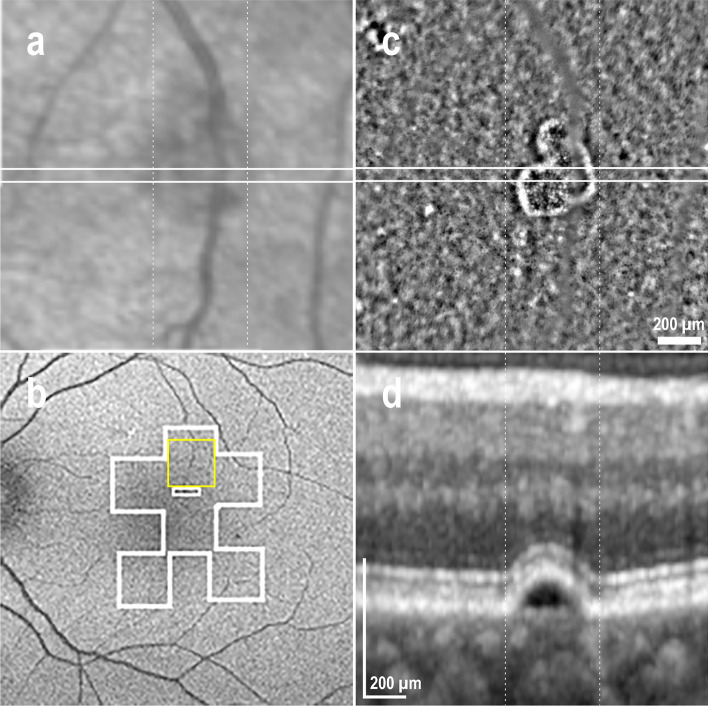
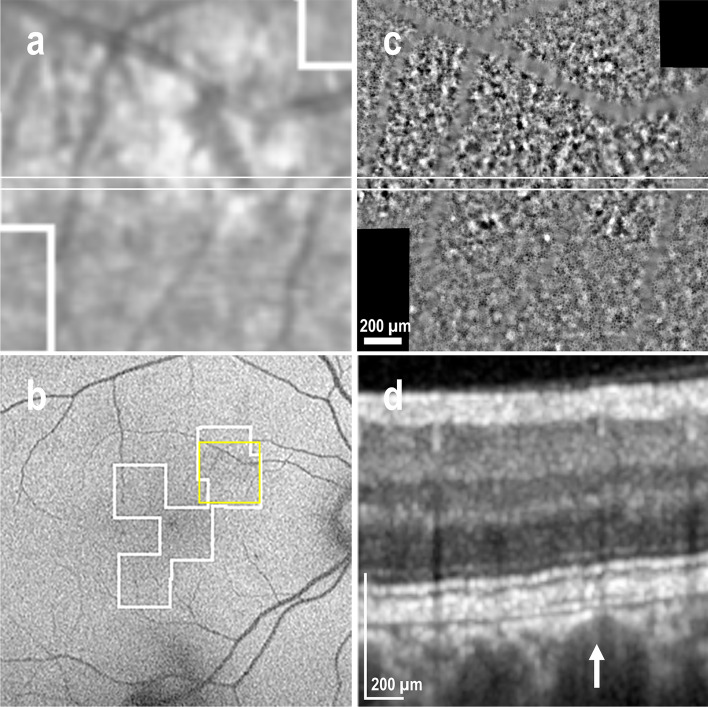
This study aims to correlate adaptive optics-transscleral flood illumination (AO-TFI) images of the retinal pigment epithelium (RPE) in central serous chorioretinopathy (CSCR) with standard clinical images and compare cell morphological features with those of healthy eyes. After stitching 125 AO-TFI images acquired in CSCR eyes (including 6 active CSCR, 15 resolved CSCR, and 3 from healthy contralateral), 24 montages were correlated with blue-autofluorescence, infrared and optical coherence tomography images. All 68 AO-TFI images acquired in pathological areas exhibited significant RPE contrast changes. Among the 52 healthy areas in clinical images, AO-TFI revealed a normal RPE mosaic in 62% of the images and an altered RPE pattern in 38% of the images. Morphological features of the RPE cells were quantified in 54 AO-TFI images depicting clinically normal areas (from 12 CSCR eyes). Comparison with data from 149 AO-TFI images acquired in 33 healthy eyes revealed significantly increased morphological heterogeneity. In CSCR, AO-TFI not only enabled high-resolution imaging of outer retinal alterations, but also revealed RPE abnormalities undetectable by all other imaging modalities. Further studies are required to estimate the prognosis value of these abnormalities. Imaging of the RPE using AO-TFI holds great promise for improving our understanding of the CSCR pathogenesis.


Conflict of interest statement

The authors declare no competing interests

Figures

Figure 1
Figure 1
Foveal serous detachment (Left eye, Female, 43 years). (a) Infrared fundus image with projection of the AO-TFI mosaic mask (Z5-Z6, Grade 1; Z1 to Z4, Grade 2). The colored lines indicate the locations of the OCT B-scan shown in panels d (blue line) and e (yellow line). (b) Blue-autofluorescence fundus image indicating the approximate hyper-reflective areas of NSD (orange circle) and the one imaged with Cellularis (white lines). (c–e) Correlation of the AO-TFI mosaic with OCT B-scans showing RPE layer under sub-retinal fluid (d) where RPE cells are imaged with AO-TFI (c, top blue line) and hyperreflective content (e, white arrow) where AO-TFI shows also hyper-reflective content in greater detail (c, white arrow) than IR fundus (a, white arrow). The complete “IR fundus—AO-TFI—OCT B-scan” correlation is available in the supplementary Movie S2.
Figure 2
Figure 2
Supero-nasal serous detachment (Right eye, Male, 40 years). (a) Infrared fundus image with projection of the AO-TFI mosaic mask (Z6 Grade 1; Z3 Grade 2; Z1, Z2, Z4, Grade 0; Z5 n/a). The colored lines indicate the locations of the OCT B-sections shown in panels d (yellow line) and e (blue line). (b) Blue-autofluorescence fundus image indicating the approximate hyper-reflective area of NSD (orange circle) and the one imaged with Cellularis® (white lines). (c–e) Correlation of the magnified AO-TFI image with OCT B-scans showing NSD, RPE bump and hyper-reflective foci (d) where AO-TFI highlights hyper-reflective dots (c, top yellow line) and attached retina (e) where AO-TFI shows RPE cells mosaic (c, inset). The complete “IR fundus—AO-TFI—OCT B-scan” correlation is available in the supplementary Movie S3.
Figure 3
Figure 3
Retinal atrophy in resolved CSCR (Left eye, Male, 47 years). (a) Infrared fundus image with projection of the AO-TFI mosaic mask (Z1, Z2, Z5, Z3-Z6: Grade 2; Z4 Grade 3). The colored lines indicate the locations of the OCT B-sections shown in panels d (blue line) and f (yellow line). (b) Blue-autofluorescence fundus image indicating the approximate area imaged with Cellularis® (white lines). (c, d) In outer retinal atrophy, the supero-nasal AO-TFI image shows RPE mosaic (c, inset) corresponding to hyper-fluorescence on BAF and loss of RPE digitation on OCT B-scan (d). (e, f) In RPE outer retina atrophy, no RPE cells are visible on the infero-nasal AO-TFI image (e) corresponding to hypo-fluorescence on BAF and loss of RPE on OCT B-scan (f). Large dark dots are also observed on AO-TFI images (e, arrowhead). In both cases, hyperreflective foci on AO-TFI images (c, e; white arrows) correspond to areas with RPE cell migration on OCT section (d, f; white arrows). The complete “IR fundus—AO-TFI—OCT B-scan” correlation is available in the supplementary Movie S4.
Figure 4
Figure 4
Pigment epithelial detachment (PED) in resolved CSCR (Left eye, Male, 46 years). (a) IR fundus area corresponding to the superior AO-TFI image shown in (c). The white line indicates the location of the corresponding OCT B-section (d). (b) Normal blue-autofluorescence fundus image indicating the approximated area imaged using AO-TFI (white lines) and the location of the magnified AO-TFI image (yellow square). (c, d) Correlation of the AO-TFI image with OCT B-scans showing PED. The vertical dot lines report the width of the distinct area sharply imaged with AO-TFI. The complete “IR fundus—AO-TFI—OCT B-scan” correlation is available in the supplementary Movie S5.
Figure 5
Figure 5
RPE changes on multifocal hyperreflective infrared areas in resolved CSCR (Male, 41 years). (a) IR fundus area corresponding to the supero-nasal AO-TFI image (c) presenting a large area of abnormal RPE contrast (upper half). The white lines indicate the corresponding OCT B-scan (d). (b) Normal blue-autofluorescence fundus image indicating the approximated area imaged with Cellularis® (white lines) and the location of the magnified AO-TFI image (yellow square). (c, d) Correlation of the AO-TFI image showing contrast changes (c) where OCT B-scan (d) shows irregular alignment of the RPE and effacement of the choriocapillaris (arrow). Lower half of the AO-TFI image shows normal RPE cells.
Figure 6
Figure 6
Normal RPE in resolved CSCR (Male, 41 years). (a) Infrared fundus image with projection of the mask of the AO-TFI mosaic (Z4, Z3-Z6: Grade 3; Z2, Z5: Grade 0). The colored lines indicate the locations of the OCT B-sections shown in panels d (yellow line) and f (blue line). (b) Normal blue-autofluorescence fundus image indicating the approximated area imaged with Cellularis® (white lines). (c-d) Correlation of the supero-nasal AO-TFI image (c) with the corresponding OCT B-scan (d). In the lower half of the AO-TFI image, RPE mosaic is visible (c, inset) where the fundus is isoreflective in the infrared image and iso-fluorescent in the blue-autofluorescence image (Z3 in a and b) and the RPE is above normal choriocapillaris on OCT sections (d). (e, f) Correlation of the magnified foveal AO-TFI image (e) with the corresponding OCT B-scan (f) showing that healthy RPE cells (e, inset) were successfully imaged in the center of the fovea (asterisk). The complete “IR fundus—AO-TFI—OCT B-scan” correlation is available in the supplementary Movie S6.
Figure 7
Figure 7
RPE changes on normal BAF and IR fundus areas in active CSCR (Male, 39 years). (a) Infrared fundus image with projection of the AO-TFI mosaic mask indicating the AO-TFI images magnified in panels c and e (dot squares). The colored lines indicate the locations of the OCT B-sections shown in panels d (yellow line) and f (blue line). (b) Blue-autofluorescence fundus image indicating the approximated area imaged with Cellularis® (white square). (c-d) Correlation of the supero-nasal AO-TFI image (c) with the corresponding OCT B-scan (d). (e–f) Correlation of the infero-nasal AO-TFI image (e) with the corresponding OCT B-scan (f). AO-TFI images show preservation of the RPE cell mosaic and major changes, hypo-reflective areas surrounded by hyperreflective structures (arrows) and hyper-reflective foci (arrowhead) corresponding to loss of alignment of the RPE on OCT sections. The complete “IR fundus – AO-TFI – OCT B-scan” correlation is available in the supplementary Movie S7.
Figure 8
Figure 8
Morphological features in healthy control and CSCR eyes. (ac) Visual of tessellation based on Voronoi segmentation in (a) healthy CL eye, (b) resolved and (c) active CSCR. (df) Visual of the hypo-reflective areas segmentation in (d) healthy CL, (e) resolved and (f) active CSCR eyes. (g) Comparison of the means of standard deviation of the number of neighboring cells measured on Voronoi diagrams in peri-foveal images from Healthy control and CSCR eyes. (h) Comparison of hypo-reflective area morphological features measured after segmentation in peri-foveal images from Healthy control (N = 33) and CSCR (N = 12) eyes.

Similar articles

Cited by

References

    1. Wang M, Munch IC, Hasler PW, Prünte C, Larsen M. Central serous chorioretinopathy. Acta Ophthalmol. 2008;86:126–145. doi: 10.1111/j.1600-0420.2007.00889.x. - DOI - PubMed
    1. Daruich A, et al. Central serous chorioretinopathy: Recent findings and new physiopathology hypothesis. Prog. Retin. Eye. Res. 2015;48:82–118. doi: 10.1016/j.preteyeres.2015.05.003. - DOI - PubMed
    1. Manayath GJ, et al. Central serous chorioretinopathy: Current update on pathophysiology and multimodal imaging. Oman J. Ophthalmol. 2018;11:103–112. doi: 10.4103/ojo.OJO_75_2017. - DOI - PMC - PubMed
    1. Nkrumah G, et al. Biomarkers for central serous chorioretinopathy. Ther. Adv. Ophthalmol. 2020;12:2515841420950846. doi: 10.1177/2515841420950846. - DOI - PMC - PubMed
    1. Warrow DJ, Hoang QV, Freund KB. Pachychoroid pigment epitheliopathy. Retina. 2013;33:1659–1672. doi: 10.1097/IAE.0b013e3182953df4. - DOI - PubMed