. 2024 Aug;21(8):826-841.
doi: 10.1038/s41423-024-01190-6. Epub 2024 Jun 13.

Depleting profibrotic macrophages using bioactivated in vivo assembly peptides ameliorates kidney fibrosis

Affiliations

Depleting profibrotic macrophages using bioactivated in vivo assembly peptides ameliorates kidney fibrosis

Qing Ouyang et al. Cell Mol Immunol. 2024 Aug.

Abstract

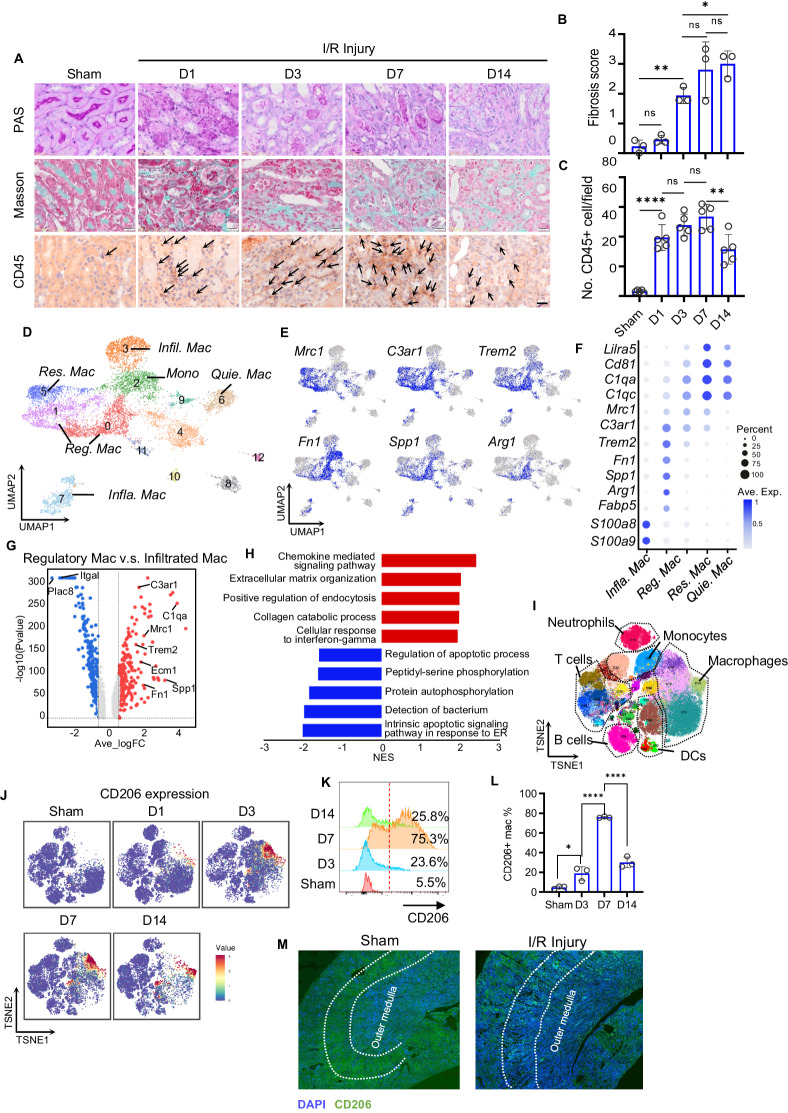
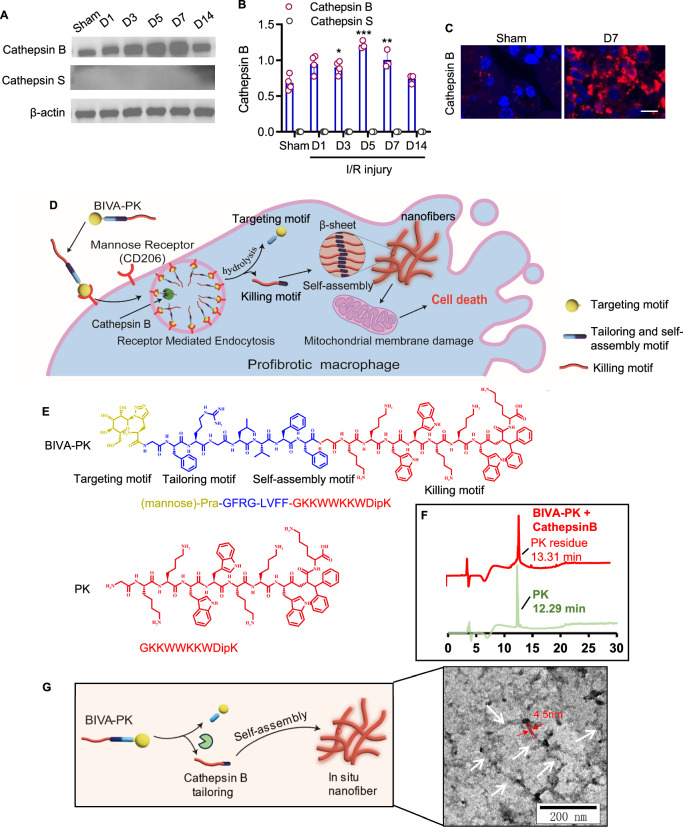
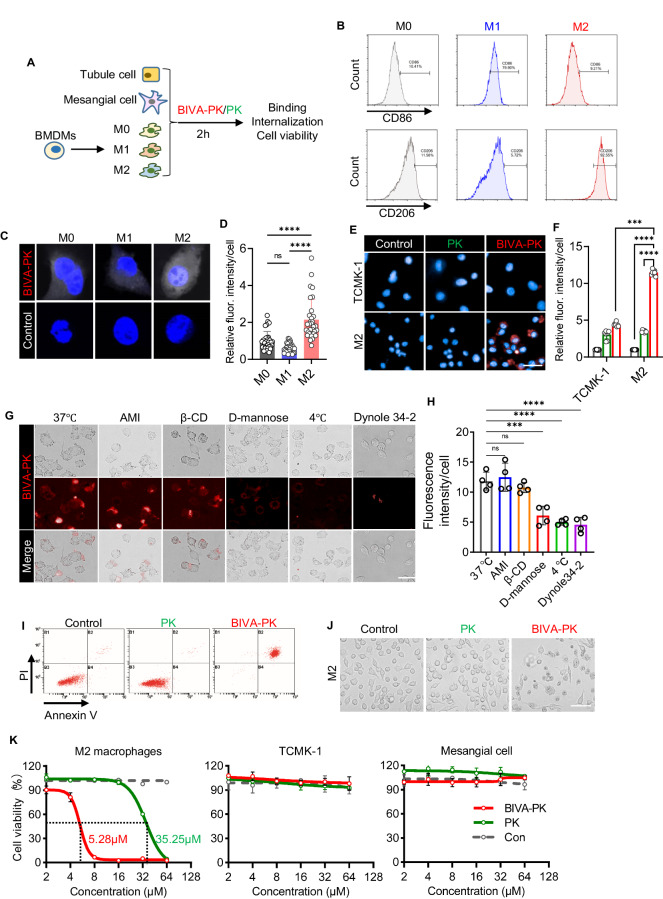
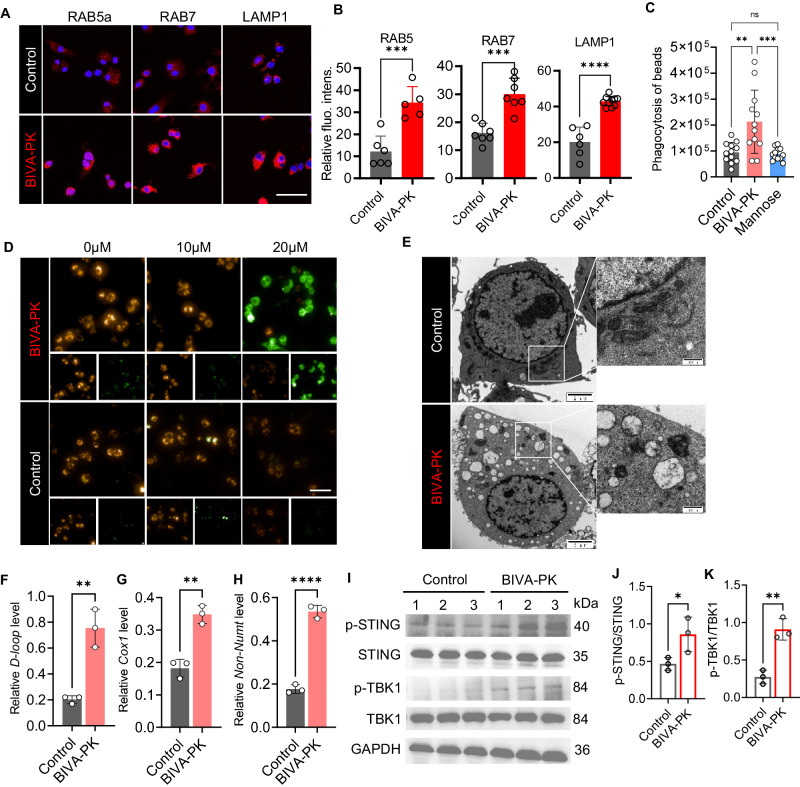
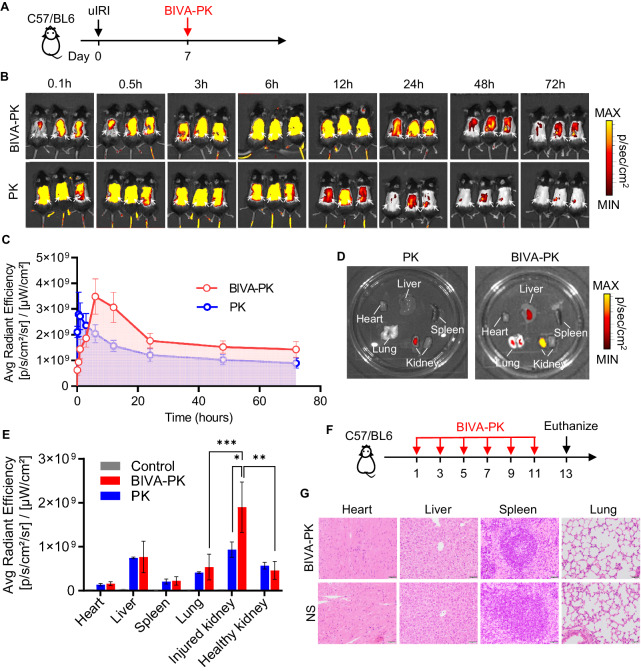
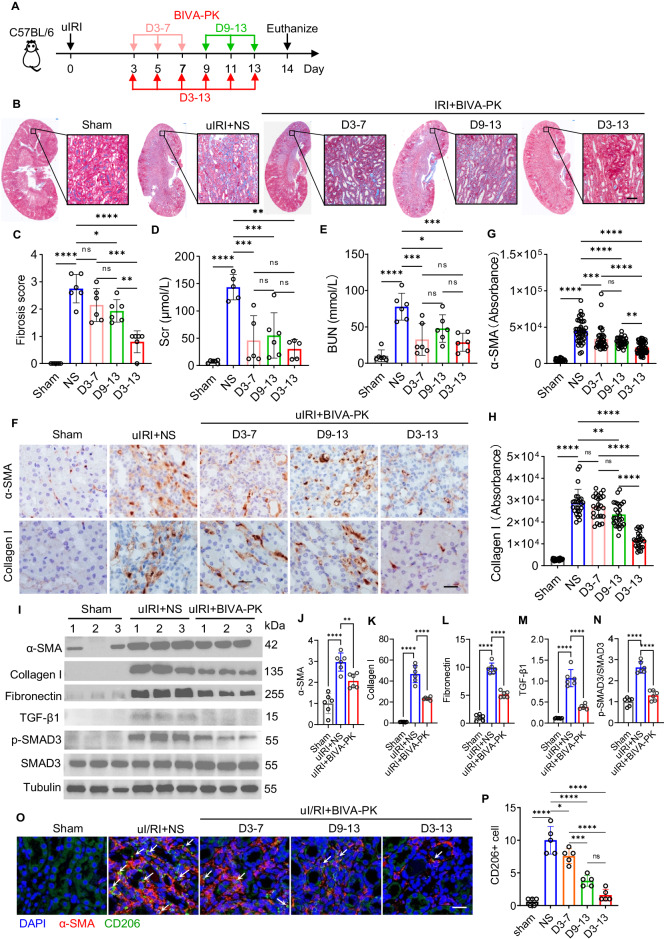
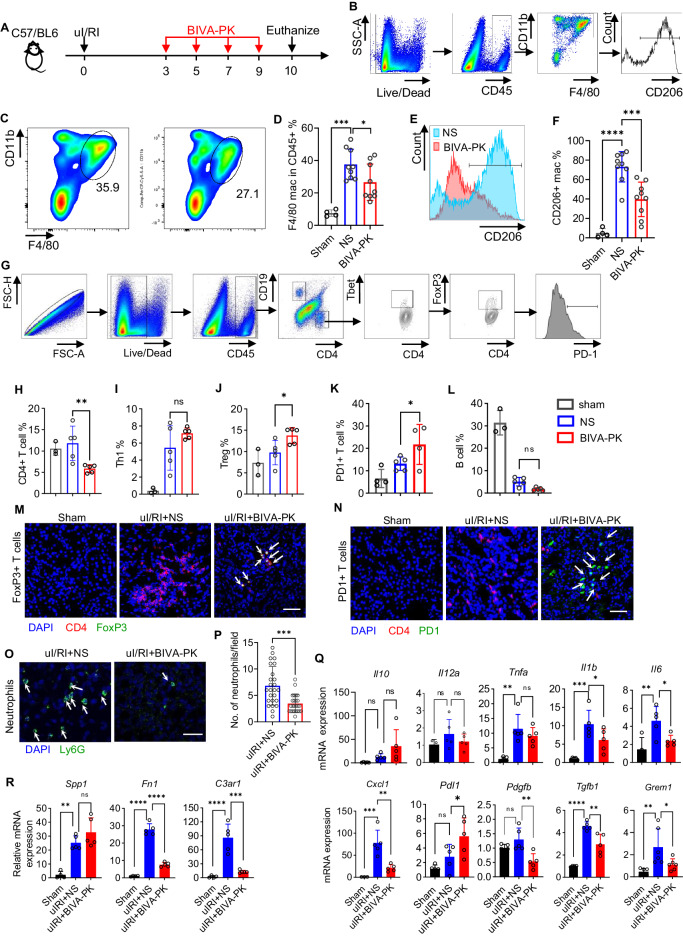
Managing renal fibrosis is challenging owing to the complex cell signaling redundancy in diseased kidneys. Renal fibrosis involves an immune response dominated by macrophages, which activates myofibroblasts in fibrotic niches. However, macrophages exhibit high heterogeneity, hindering their potential as therapeutic cell targets. Herein, we aimed to eliminate specific macrophage subsets that drive the profibrotic immune response in the kidney both temporally and spatially. We identified the major profibrotic macrophage subset (Fn1+Spp1+Arg1+) in the kidney and then constructed a 12-mer glycopeptide that was designated as bioactivated in vivo assembly PK (BIVA-PK) to deplete these cells. BIVA-PK specifically binds to and is internalized by profibrotic macrophages. By inducing macrophage cell death, BIVA-PK reshaped the renal microenvironment and suppressed profibrotic immune responses. The robust efficacy of BIVA-PK in ameliorating renal fibrosis and preserving kidney function highlights the value of targeting macrophage subsets as a potential therapy for patients with CKD.

Keywords: Bioactivated in vivo assembly-PK (BIVA-PK); Renal fibrosis; cell death; immune microenvironment; pro-fibrotic macrophage.


Conflict of interest statement

QO, TS, LLL, and XC are co-inventors on China Invention Patent Application no. ZL 2022 1 0056384.3 filed by the Chinese PLA General Hospital related to the subject matter of this manuscript.

Figures

Fig. 1
Fig. 1
CD206+ macrophages are therapeutic targets for ischemia‒reperfusion injury (IRI)-induced renal fibrosis. A Periodic acid-Schiff staining, Masson’s trichrome staining and CD45 staining of kidney samples from unilateral IRI (uIRI) model mice at different time points. B Quantification of the fibrotic score determined by Masson’s trichrome staining in (A). C Quantification of the number of immune cells by CD45 staining in (A). D UMAP plot showing mononuclear phagocytic cell (MPC) clusters by single-cell transcriptome sequencing of CD45+ cells from IRI kidneys. E Feature plots of profibrotic gene expression in MPCs from IRI kidneys. F Typical marker genes of different macrophage clusters in kidneys with IRI. G Volcano plot displaying the genes differentially expressed between CD206+ and CD206- macrophages in IRI kidneys. H Enriched GOBP terms between CD206+ and CD206- macrophages. I TSNE plot of the clusters of CD45+ cells from IRI kidneys using cytometry by time of flight (CyTOF). J TSNE plot of the distribution of CD206+ macrophages in kidney samples from uIRI model mice at different time points determined by CyTOF. K, L The percentage of CD206+ macrophages in the kidneys of uIRI mice at the indicated times was determined via flow cytometry. M Fluorescence images of CD206+ macrophages in the kidneys of sham and uIRI mice. Scale bar, 20 μm. The data are shown as the means ± standard deviation (SD). *p < 0.05; **p < 0.01; and ***p < 0.001. n = 3–5. For all figures, the data are representative of three independent experiments. uIRI unilateral renal ischemia-reperfusion injury. MPCs mononuclear phagocytic cells
Fig. 2
Fig. 2
Illustration and chemical structures of bioactivated in vivo assembly PK (BIVA-PK). A, B Western blotting of cathepsin B and cathepsin S expression in the kidneys of uIRI mice at the indicated time points. C Immunofluorescence staining showing cathepsin B expression in the kidneys of uIRI mice. D Schematic illustration showing the modular design of BIVA-PK and the mechanisms for recognizing and killing M2 macrophages. E Chemical structures of BIVA-PK and control PK peptides. F High-performance liquid chromatography profiles of BIVA-PK and PK. G Schematic illustration of cathepsin B-dependent tailoring and in situ assembly of BIVA-PK and the morphology of assembled nanofibers via transmission electron microscopy. Scale bar, 2 μm. The data are shown as the means ± standard deviation (SD). *p < 0.05; **p < 0.01; and ***p < 0.001. n = 3–4. The data are representative of three independent experiments
Fig. 3
Fig. 3
BIVA-PK induces specific internalization and cell death in M2 macrophages. A Bone marrow-derived macrophages (BMDMs) were polarized into M1/M2 macrophages and treated with PK or BIVA-PK at the indicated concentrations to analyze internalization and cell death. B Flow cytometry analysis of BMDMs polarized into M0, M1, and M2 macrophages. C Immunofluorescence images of BMDMs polarized into M0, M1, and M2 macrophages incubated with AF647-conjugated BIVA-PK. D Quantification of the fluorescence in (C). E Confocal images of renal tubule epithelial cells and BMDMs polarized into M2 macrophages incubated with AF647-conjugated PK and BIVA-PK at 37 °C for 2 h and nuclei stained with 4′,6-diamidino-2-phenylindole (DAPI). F Quantification of the induced fluorescence in (E). G BMDMs polarized into M2 macrophages were incubated with AF647-conjugated BIVA-PK in the presence of amiloride (AMI), β-cyclodextrin (β-CD), D-mannose, or dynole 34-2, or at 4 °C. H Quantification of the intracellular fluorescence signals in (G). I Flow cytometry of M2 macrophages co-stained with Annexin V and propidium iodide (PI) after BIVA-PK or PK treatment. J Images of M2 macrophages treated with BIVA-PK or PK. K Dose-dependent cell viability of M2 macrophages, TCMK-1 cells, and mesangial cells after BIVA-PK or PK treatment. Phosphate-buffered saline (PBS) served as a negative control. Scale bar, 20 μm. The data are shown as the means ± standard deviation (SD). *p < 0.05; **p < 0.01; ***p < 0.001; and ****p < 0.0001. n = 3–5. The data are representative of three independent experiments
Fig. 4
Fig. 4
BIVA-PK enhances phagocytosis and mitochondrial injury in M2 macrophages. A Immunofluorescence images of BMDMs stained with anti-Ras-related protein Rab-5A (RAB5A), Ras-related protein Rab-7A (RAB7A), and lysosomal-associated membrane protein 1 (LAMP1) antibodies after BIVA-PK treatment. The intracellular fluorescence is quantified in (B). C After BIVA-PK (100 nM) or mannose (100 nM) treatment, BMDMs were incubated with fluorescence-labeled beads for 2 h, and the phagocytosis of the beads was evaluated using confocal imaging. D Confocal images of M2 macrophages stained with a JC-1 probe to determine the mitochondrial membrane potential after BIVA-PK or vehicle treatment. Scale bar, 20 μm. E Electron microscopy images of M2 macrophages treated with BIVA-PK or vehicle for 6 h. Scale bar, 2 μm. FH The released mtDNA in the cell cytosol was quantified using qPCR with the primers for mtDNA, such as D-loop, Cox1, and Non-Numt. IK Western blotting of STING, p-STING, TBK1, and p-TNK1 in BMDMs treated with or without BIVA-PK. The data are shown as the means ± standard deviation (SD). *p < 0.05; **p < 0.01; and ***p < 0.001. n = 3–5. The data are representative of three independent experiments
Fig. 5
Fig. 5
In vivo fluorescence imaging of the BIVA-PK distribution. A, B Fluorescence images of uIRI mice at the indicated time points after administration of cyanine 7.5-labeled BIVA-PK or PK. uIRI mice were injected with 10 mg/kg cyanine 7.5-conjugated BIVA-PK or PK at D7. C Quantification of the fluorescence intensity in the injured kidneys of the uIRI mice in (B). D, E Biodistribution of cyanine 7.5-labeled BIVA-PK or PK in the major organs of uIRI mice. uIRI mice were euthanized on day 3 (D3) after BIVA-PK or PK administration, and major organs were harvested for biodistribution evaluation and quantification. F, G Hematoxylin and eosin (HE) staining of the major organs of C57/BL6 mice treated with 50 mg/kg BIVA-PK six times. The data are shown as the means ± standard deviation (SD). *p < 0.05; **p < 0.01; and ***p < 0.001. n = 3–5. The data are representative of three independent experiments
Fig. 6
Fig. 6
In vivo antifibrotic activity of BIVA-PK in renal fibrosis induced by IRI. A uIRI mice were injected with BIVA-PK (10 mg/kg) or normal saline (NS) at the indicated time points. B Masson’s trichrome staining of kidney samples from uIRI mice treated with BIVA-PK or NS. C Fibrosis score calculated from Masson’s trichrome staining of kidney samples from (B). D, E Serum creatinine (Scr) and BUN levels in uIRI mice treated with BIVA-PK or NS were measured by enzyme-linked immunosorbent assay (ELISA). F Immunohistochemical staining of α-smooth muscle actin (α-SMA) and collagen I in the kidneys of uIRI mice treated with BIVA-PK or NS. G, H Quantification of α-SMA and collagen I expression in (F). I Western blotting of the fibrotic markers α-SMA, collagen I, fibronectin, TGF-β1, SMAD3, and p-SMAD3. JN Quantification of the expression of the fibrotic markers α-SMA, collagen I, fibronectin, TGF-β1, SMAD3, and p-SMAD3 in (I). O Immunofluorescence staining of CD206 and α-SMA in kidneys from uIRI mice treated with BIVA-PK or NS. P Quantification of CD206+ macrophages in (O). The data are shown as the means ± standard deviation (SD), *p < 0.05, **p < 0.01, ***p < 0.001, and ****p < 0.0001. Scale bar = 20 μm. n = 5–6. The data are representative of three independent experiments. BUN blood urea nitrogen, Scr serum creatinine
Fig. 7
Fig. 7
The immune microenvironment was reshaped by BIVA-PK in IRI kidneys. A uIRI mice were injected with 10 mg/kg BIVA-PK or NS on D3, D5, D7, and D9 and euthanized on D10 to harvest kidneys for flow cytometry. B Flow cytometry gating strategy for CD206+ macrophages. C, D Percentage of F4/80+ macrophages and (E, F) CD206+ macrophages in the parental population, in the kidneys of uIRI mice. G Gating strategy for T and B-cell populations. HL Percentage of the indicated immune cells in the parental population from the kidneys of uIRI mice. M Immunofluorescence images of FoxP3+ T cells and (N) PD1+ T cells in the kidneys of uIRI mice treated with BIVA-PK or NS. O Immunofluorescence images of Ly6G+ neutrophils in the kidneys of uIRI mice treated with BIVA-PK or NS. P Calculation of Ly6G+ neutrophils in (O). Q Il10, Il12a, Tnfa, Il1b, Il6, Cxcl1, Pdcd1, Pdl1, Pdgfb, and Tgfb1 transcript expression (from whole kidney) on day 10. R Spp1, Fn1, and C3ar1 transcript expression (from isolated F4/80+ macrophages in the kidney) on D10. The data are shown as the means ± standard deviation (SD). *p < 0.05, **p < 0.01, ***p < 0.001, and ****p < 0.0001. Scale bar = 20 μm. n = 3–9. The data are representative of three independent experiments
Fig. 8
Fig. 8
Schematic diagram showing the mechanisms by which BIVA-PK ameliorates kidney fibrosis by inducing profibrotic macrophage cell death. Fn1+Spp1+Mrc1+ macrophages are major cellular contributors to the renal profibrotic microenvironment. The bioactivated in vivo assembly (BIVA) peptide BIVA-PK was constructed to recognize and kill these problematic cells specifically. Mechanistically, BIVA-PK targets CD206 expressed on the profibrotic macrophage surface, triggering CD206-dependent endocytosis. In the lysosome, BIVA-PK is cleaved by cathepsin B at the peptide linkage site. Subsequently, the functional residue RGLVFF-PK translocates to the cytosol and assembles in situ into β-sheet nanofibers, causing enhanced perturbation of mitochondrial plasma and cell death. The selective depletion of Fn1+Spp1+Mrc1+ macrophages by the BIVA-PK peptide reshaped the profibrotic microenvironment and ameliorated IRI-induced renal fibrosis

Similar articles

Cited by

References

    1. Kalantar-Zadeh K, Jafar TH, Nitsch D, Neuen BL, Perkovic V. Chronic kidney disease. Lancet. 2021;398:786–802. - PubMed
    1. GBD Chronic Kidney Disease Collaboration. Global, regional, and national burden of chronic kidney disease, 1990-2017: a systematic analysis for the Global Burden of Disease Study 2017. Lancet. 2020;395:709–33. - PMC - PubMed
    1. Xie Y, Bowe B, Mokdad AH, Xian H, Yan Y, Li T, et al. Analysis of the Global Burden of Disease study highlights the global, regional, and national trends of chronic kidney disease epidemiology from 1990 to 2016. Kidney Int. 2018;94:567–81. - PubMed
    1. Foreman KJ, Marquez N, Dolgert A, Fukutaki K, Fullman N, McGaughey M, et al. Forecasting life expectancy, years of life lost, and all-cause and cause-specific mortality for 250 causes of death: reference and alternative scenarios for 2016-40 for 195 countries and territories. Lancet. 2018;392:2052–90. - PMC - PubMed
    1. Zhao M, Wang L, Wang M, Zhou S, Lu Y, Cui H, et al. Targeting fibrosis, mechanisms and cilinical trials. Signal Transduct Target Ther. 2022;7:206. - PMC - PubMed

LinkOut - more resources