. 2024 Jun 13;14(1):13653.
doi: 10.1038/s41598-024-64493-8.

Partitioning into ER membrane microdomains impacts autophagic protein turnover during cellular aging

Affiliations

Partitioning into ER membrane microdomains impacts autophagic protein turnover during cellular aging

Simon Prokisch et al. Sci Rep. .

Abstract

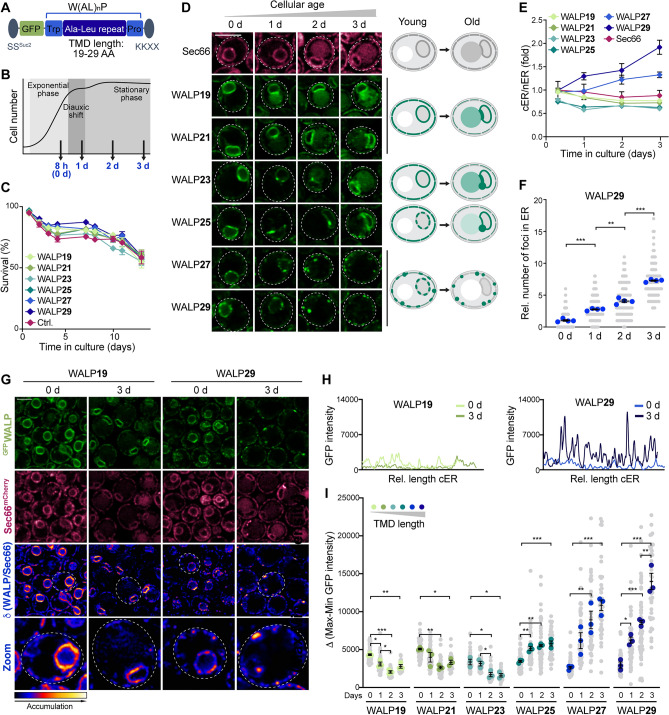
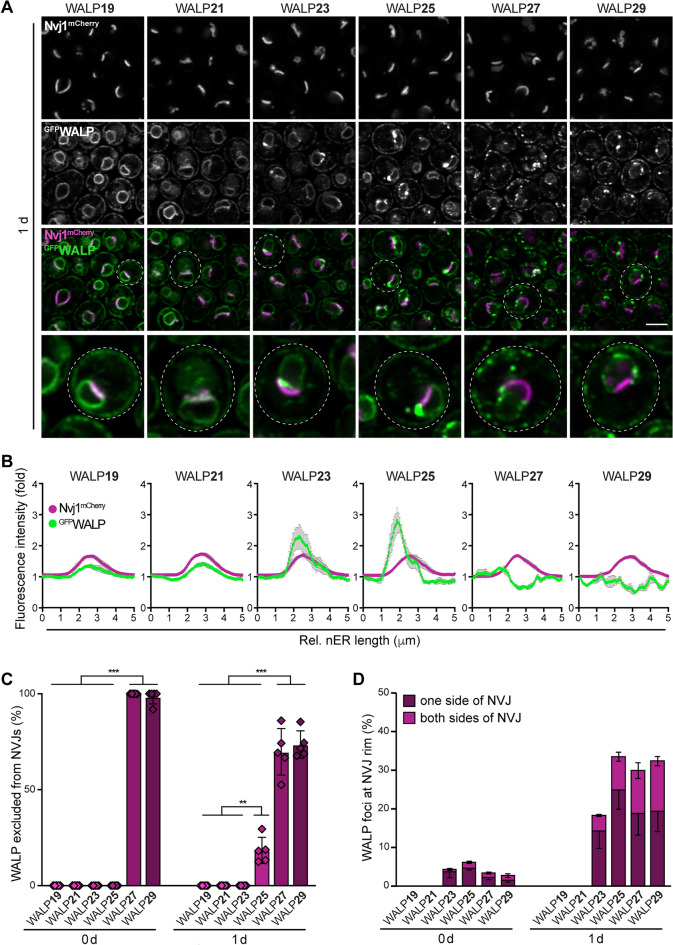
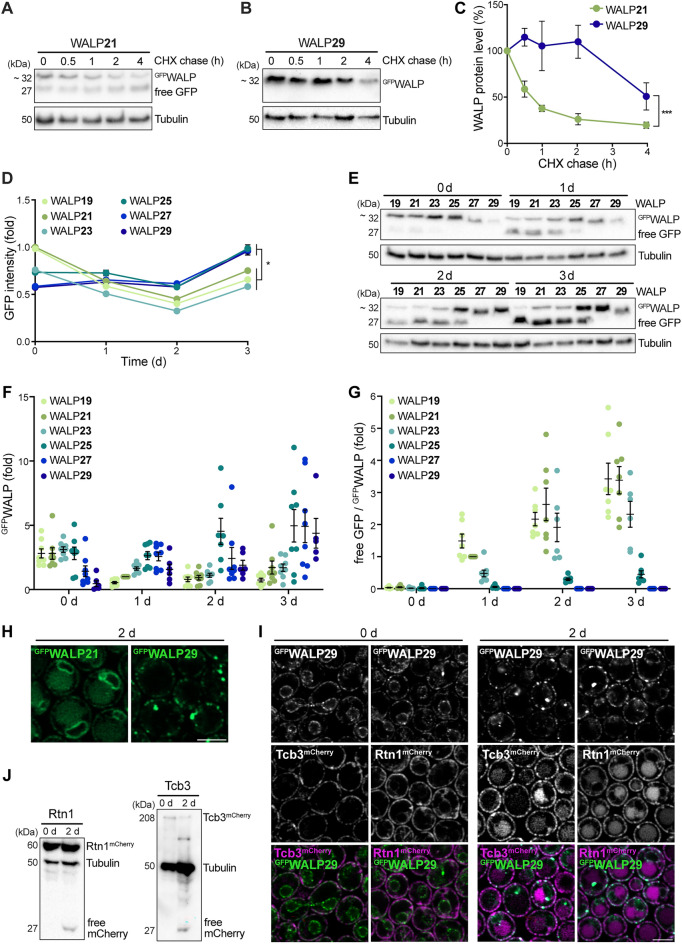
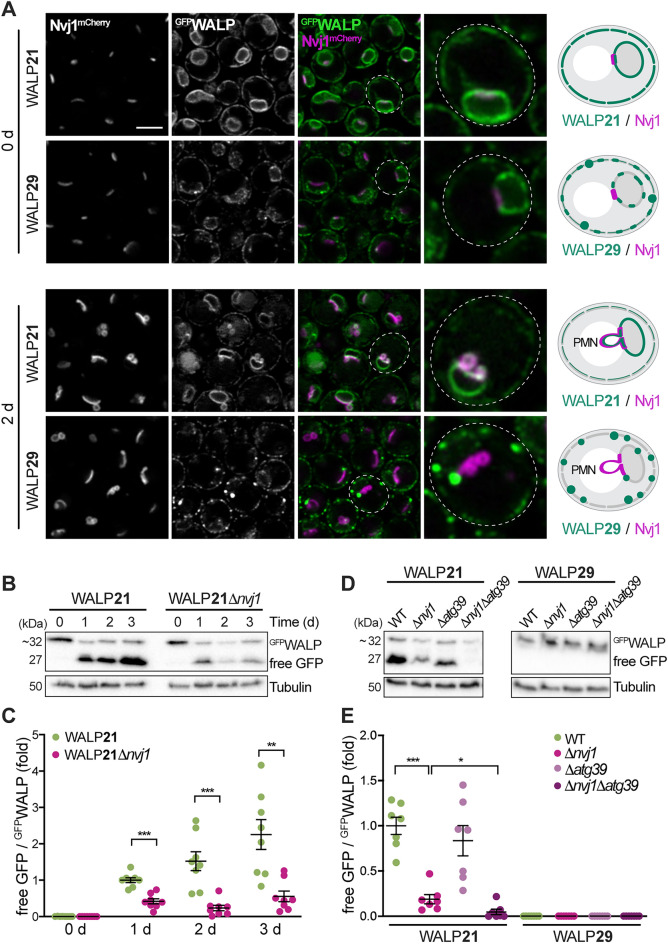
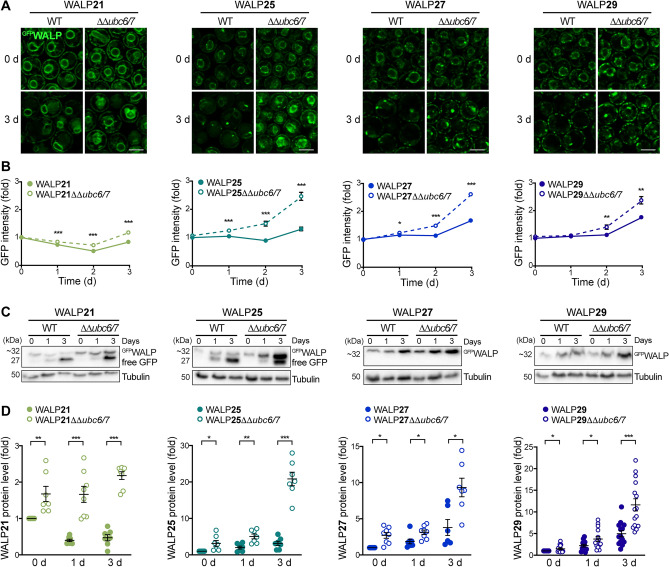
Eukaryotic membranes are compartmentalized into distinct micro- and nanodomains that rearrange dynamically in response to external and internal cues. This lateral heterogeneity of the lipid bilayer and associated clustering of distinct membrane proteins contribute to the spatial organization of numerous cellular processes. Here, we show that membrane microdomains within the endoplasmic reticulum (ER) of yeast cells are reorganized during metabolic reprogramming and aging. Using biosensors with varying transmembrane domain length to map lipid bilayer thickness, we demonstrate that in young cells, microdomains of increased thickness mainly exist within the nuclear ER, while progressing cellular age drives the formation of numerous microdomains specifically in the cortical ER. Partitioning of biosensors with long transmembrane domains into these microdomains increased protein stability and prevented autophagic removal. In contrast, reporters with short transmembrane domains progressively accumulated at the membrane contact site between the nuclear ER and the vacuole, the so-called nucleus-vacuole junction (NVJ), and were subjected to turnover via selective microautophagy occurring specifically at these sites. Reporters with long transmembrane domains were excluded from the NVJ. Our data reveal age-dependent rearrangement of the lateral organization of the ER and establish transmembrane domain length as a determinant of membrane contact site localization and autophagic degradation.


Conflict of interest statement

The authors declare no competing interests.

Figures

Figure 1
Figure 1
Age-dependent remodeling of the ER membrane. (A) Schematic of the ER membrane thickness reporters (GFPWALPs) based on a transmembrane domain (TMD) of varying length (19–29 AA), achieved by different numbers of Ala-Leu dipeptides. The SSSuc2 signal sequence facilitates ER membrane targeting and the KKXX signal retains the reporters within the ER. (B) Schematic illustrating the time points analyzed. Cells were assessed during exponential growth (0 day/8 h), at the end of the diauxic shift (1 day) and in early/late stationary phase (2 day and 3 day). (C) Flow cytometric quantification of cell death during chronological aging via propidium iodide staining of wild type (WT) and cells endogenously expressing GFPWALPs. Mean ± s.e.m.; n = 4. (D) Micrographs of cells expressing Sec66mCherry and indicated GFPWALPs. Scale bar: 3 μm. Schematics of age-dependent redistribution of the WALP sensors and vacuolar GFP accumulation. (E) Ratio of the mean GFP intensities of the cortical (cER) and nuclear ER (nER) of cells expressing GFPWALPs, quantified from confocal micrographs and depicted as fold of the WALP21 cER/nER ratio in young cells (0 d). Mean ± s.e.m.; n = 5, with > 50 cells per n. (F) WALP29 foci frequency, showing individual cells from 4 independent experiments (gray dots), the average for each experiment (blue dots; 17–40 cells per n), and the grand mean ± s.e.m. (lines) of the individual experiments (n = 4). (G) Micrographs of young and old cells expressing Sec66mCherry and WALP19 or WALP29. The ratio of GFPWALP to Sec66mCherry visualizes the ER membrane regions with specific GFPWALP accumulation. Scale bar: 3 μm. (H) GFP fluorescence intensity profiles of the cER of a representative cell expressing WALP19 or WALP29 at day 0 and day 3. (I) GFP intensity profiles as shown in (H) were used to calculate the average difference between the minimal and maximal GFP intensity of the cER per cell. Individual cells from 3 independent experiments (gray dots), the average for each experiment (colored dots; 10–30 cells per n), and the grand mean ± s.e.m. (lines) of the individual experiments (n = 3) are shown. *p ≤ 0.05, **p ≤ 0.01, ***p ≤ 0.001.
Figure 2
Figure 2
TMD length as determinant of NVJ localization. (A) Micrographs of cells endogenously expressing Nvj1mCherry and one of the six GFPWALPs at day 1 of chronological aging. Scale bar: 3 μm. (B) Relative GFP and mCherry fluorescence intensity profiles of the nuclear ER (nER) of cells expressing GFPWALPs and Nvj1mCherry from micrographs as shown in (A). The profiles were obtained by encircling the nER using the free-hand tool in Fiji, starting at the opposite site of the nucleus vacuole junctions (NVJs). Fluorescence intensity fold values are shown. Four individual experiments were performed, and for each experiment, profiles of 20–64 cells have been averaged. Data is depicted as mean ± s.e.m. of these individual experiments (n = 4). (C) Quantification of cells in which GFPWALP is excluded from the NVJs at indicated time points. Data represent mean ± s.e.m.; n = 5, and at least 100 cells per n were analyzed. (D) Percentage of cells with GFPWALP foci at the rim of the NVJ. Cells have been grouped according to GFPWALP foci at only one or both sides of the NVJ. Data represent mean ± s.e.m.; n = 5, and at least 100 cells per n were analyzed. **p ≤ 0.01, ***p ≤ 0.001.
Figure 3
Figure 3
Partitioning into raft-like microdomains increases protein stability and prevents autophagic removal. (AC) Immunoblot analysis of total protein extracts from WT cells expressing GFPWALP21 or GFPWALP29 collected at indicated time points. After 8 h of growth, cells were treated with cycloheximide (CHX) to stop translation and the turnover of GFPWALP was determined. Representative blots (A, B) and corresponding densitometric quantification of the GFPWALP protein levels (C) are shown. Blots were probed with antibodies directed against GFP and tubulin as loading control. The GFPWALP protein levels are shown as percentage of protein level before CHX treatment (0 h); Data represent mean ± s.e.m.; n = 5. (D) Flow cytometric quantification of total cellular GFP fluorescence intensity of WT cells expressing one of the six GFPWALPs at indicated time points. Dead cells were excluded from the analysis via counterstaining with propidium iodide. GFP intensity is shown as fold of WALP21 at day 0; Data represent mean ± s.e.m.; n = 6. (EG) Immunoblot analysis of total protein extracts from WT cells expressing one of the six GFPWALPs collected at indicated time points. Blots were probed with antibodies directed against GFP and tubulin as loading control. A representative blot (E) and corresponding densitometric quantification of GFPWALP protein levels normalized to tubulin (F) as well as of the ratio of free GFP to GFPWALP, indicative of autophagic turnover (G), are shown. Values have been normalized to the respective values of GFPWALP21 at day 1. Dot plots with mean ± s.e.m.; n = 8. (H) Micrographs of cells expressing GFPWALP21 or GFPWALP29 at day 2 of chronological aging. Scale bar: 3 μm. (I) Micrographs of cells expressing GFPWALP29 and either Tcb3mCherry or Rtn1mCherry at indicated days during aging. Scale bar: 3 μm. (J) Immunoblot analysis of total protein extracts from cells described in (I). Blots were probed with antibodies directed against mCherry and tubulin as loading control. *p ≤ 0.05, ***p ≤ 0.001.
Figure 4
Figure 4
Reporters with short TMD are removed via piecemeal microautophagy of the nucleus. (A) Micrographs of exponentially growing and stationary cells endogenously expressing Nvj1mCherry and GFPWALP21 or GFPWALP29. Scale bar: 3 μm. Schematics of TMD length-dependent exclusion of WALP29 from the nucleus vacuole junction (NVJ) and piecemeal microautophagy of the nucleus (PMN). (B, C) Immunoblot analysis of total protein extracts from wild type (WT) and Δnvj1 cells expressing GFPWALP21 collected at indicated time points during chronological aging. A representative blot (B) and corresponding densitometric quantification of the ratio of free GFP to GFPWALP21 (C) are depicted. Blots were decorated with antibodies directed against GFP and tubulin as loading control. The free GFP/GFPWALP values are shown as fold of the ratio at day 1. Dot plots with mean ± s.e.m.; n = 8. (D, E) Immunoblot analysis of total protein extracts from WT, Δnvj1, Δatg39, and Δnvj1Δatg39 cells expressing GFPWALP21 or GFPWALP29 collected at day 2. Representative blots (D) as well as corresponding densitometric quantification of the ratio of free GFP to GFPWALP (E) are depicted. Blots were probed with antibodies directed against GFP and tubulin as loading control. The free GFP/GFPWALP values are shown as fold of the ratio of GFPWALP21 in WT. Dot plots with mean ± s.e.m.; n = 7. *p ≤ 0.05, **p ≤ 0.01, and ***p ≤ 0.001.
Figure 5
Figure 5
TMD-independent degradation of ER proteins via ERAD. (A) Micrographs of young and old wild type (WT) cells and cells lacking the two ubiquitin-conjugating enzymes Ubc6 and Ubc7 (ΔΔubc6/7), endogenously expressing GFPWALP21, GFPWALP25, GFPWALP27, or GFPWALP29. Scale bar: 3 μm. (B) Flow cytometric quantification of GFP fluorescence intensity of WT and ΔΔubc6/7 cells expressing indicated GFPWALPs. Dead cells were excluded from the analysis via counterstaining with propidium iodide. Data represent mean ± s.e.m.; n = 8. (C, D) Immunoblot analysis of total protein extracts from WT and ΔΔubc6/7 cells expressing GFPWALP21, GFPWALP25, GFPWALP27, or GFPWALP29 collected at indicated time points. Representative blots (C) as well as corresponding densitometric quantification of the GFPWALP protein levels (D) are shown. Blots were probed with antibodies directed against GFP and tubulin as loading control. GFPWALP protein levels were normalized to tubulin and are shown as fold of the respective 0 day time point. Dot plots with mean ± s.e.m.; *p ≤ 0.05, **p ≤ 0.01, ***p ≤ 0.001.

Similar articles

Cited by

References

    1. Wang H-Y, Bharti D, Levental I. Membrane heterogeneity beyond the plasma membrane. Front. Cell Dev. Biol. 2020;8:580814. doi: 10.3389/fcell.2020.580814. - DOI - PMC - PubMed
    1. Levental I, Levental KR, Heberle FA. Lipid rafts: Controversies resolved, mysteries remain. Trends Cell Biol. 2020;30:341–353. doi: 10.1016/j.tcb.2020.01.009. - DOI - PMC - PubMed
    1. Lingwood D, Simons K. Lipid rafts as a membrane-organizing principle. Science. 2010;327:46–50. doi: 10.1126/science.1174621. - DOI - PubMed
    1. Simons K, Ikonen E. Functional rafts in cell membranes. Nature. 1997;387:569–572. doi: 10.1038/42408. - DOI - PubMed
    1. Pike LJ. Rafts defined: A report on the keystone symposium on lipid rafts and cell function. J. Lipid Res. 2006;47:1597–1598. doi: 10.1194/jlr.E600002-JLR200. - DOI - PubMed

MeSH terms

Substances