. 2024 Jul;26(7):1176-1186.
doi: 10.1038/s41556-024-01438-3. Epub 2024 Jun 13.

Integrative analysis of ultra-deep RNA-seq reveals alternative promoter usage as a mechanism of activating oncogenic programmes during prostate cancer progression

Collaborators, Affiliations

Integrative analysis of ultra-deep RNA-seq reveals alternative promoter usage as a mechanism of activating oncogenic programmes during prostate cancer progression

Meng Zhang et al. Nat Cell Biol. 2024 Jul.

Abstract

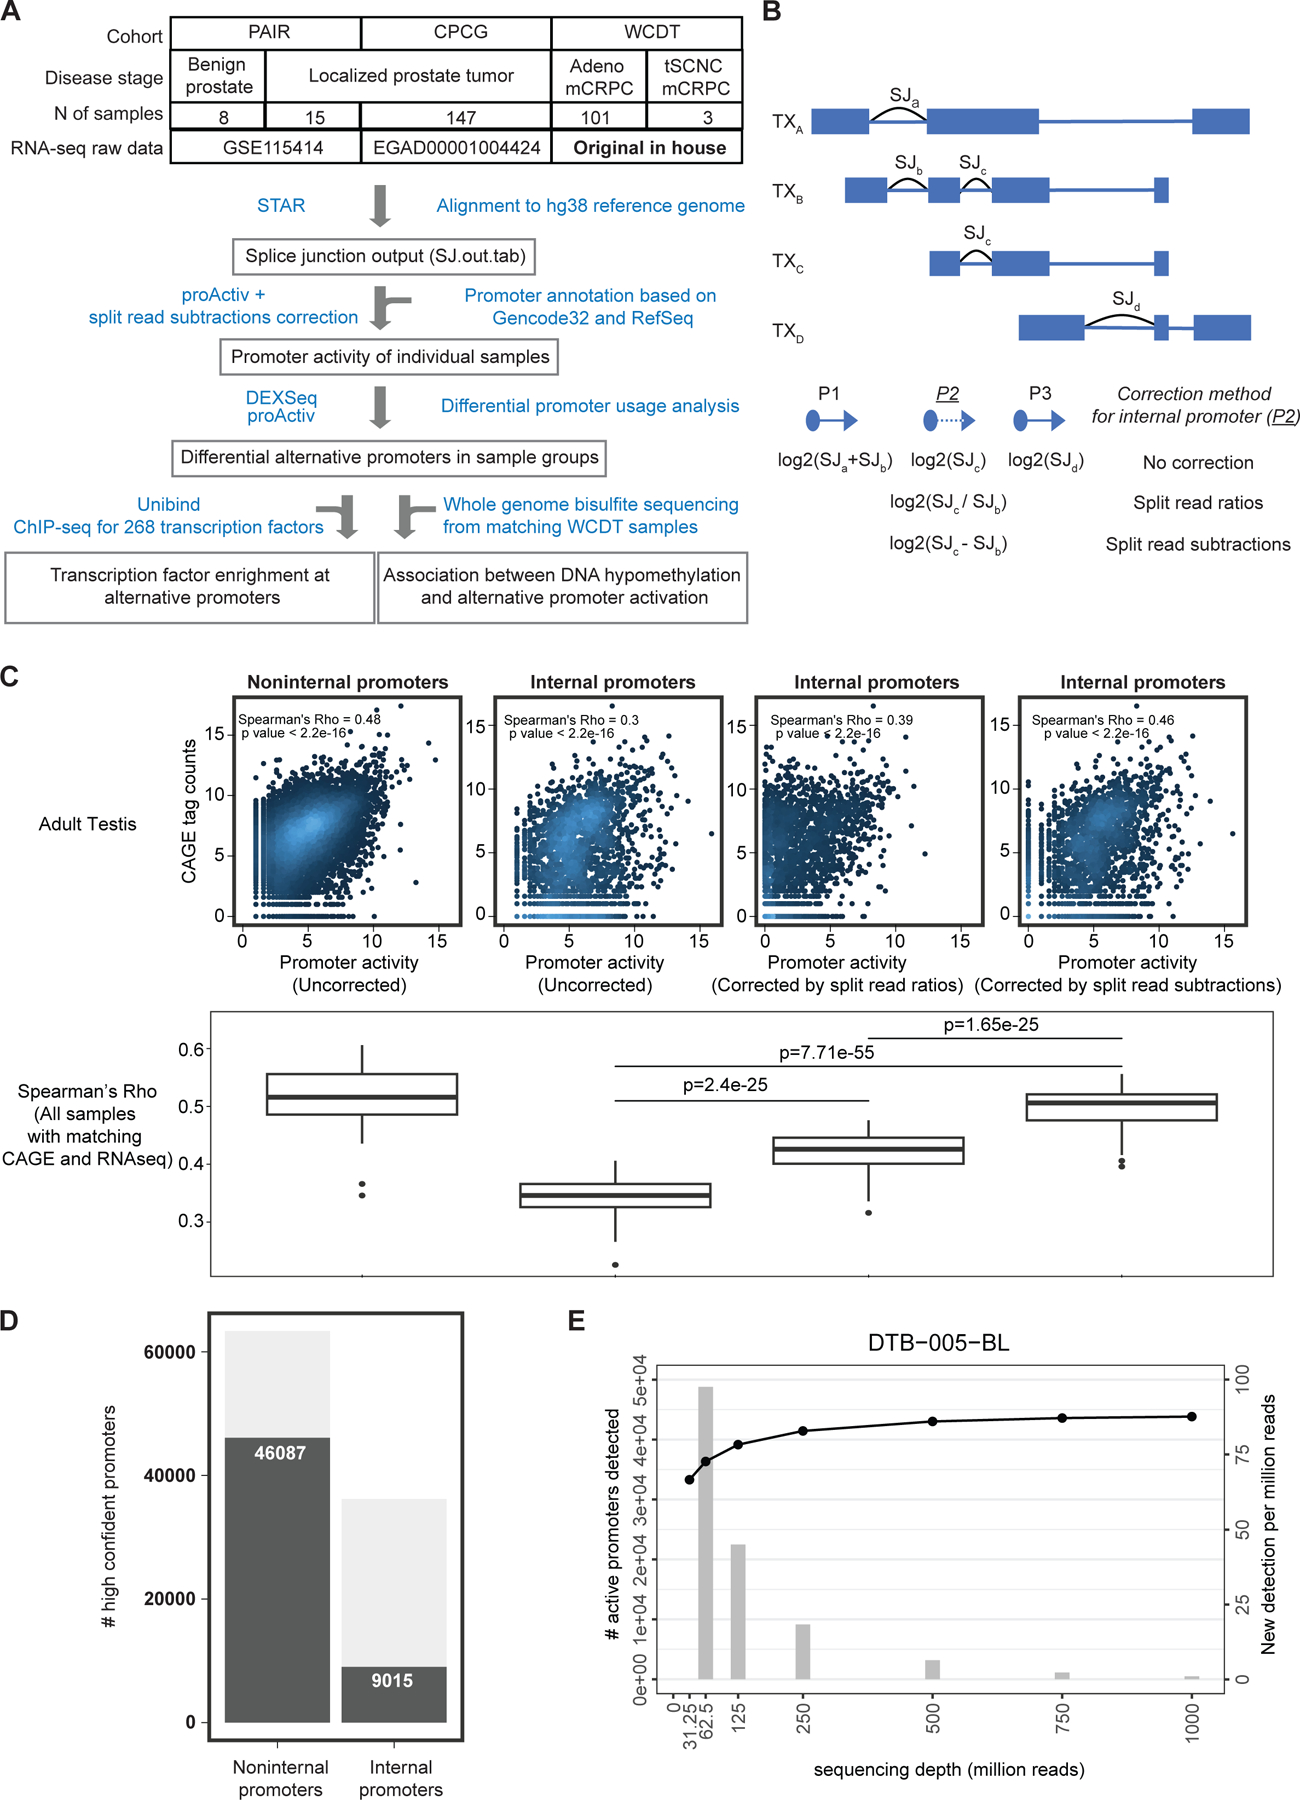
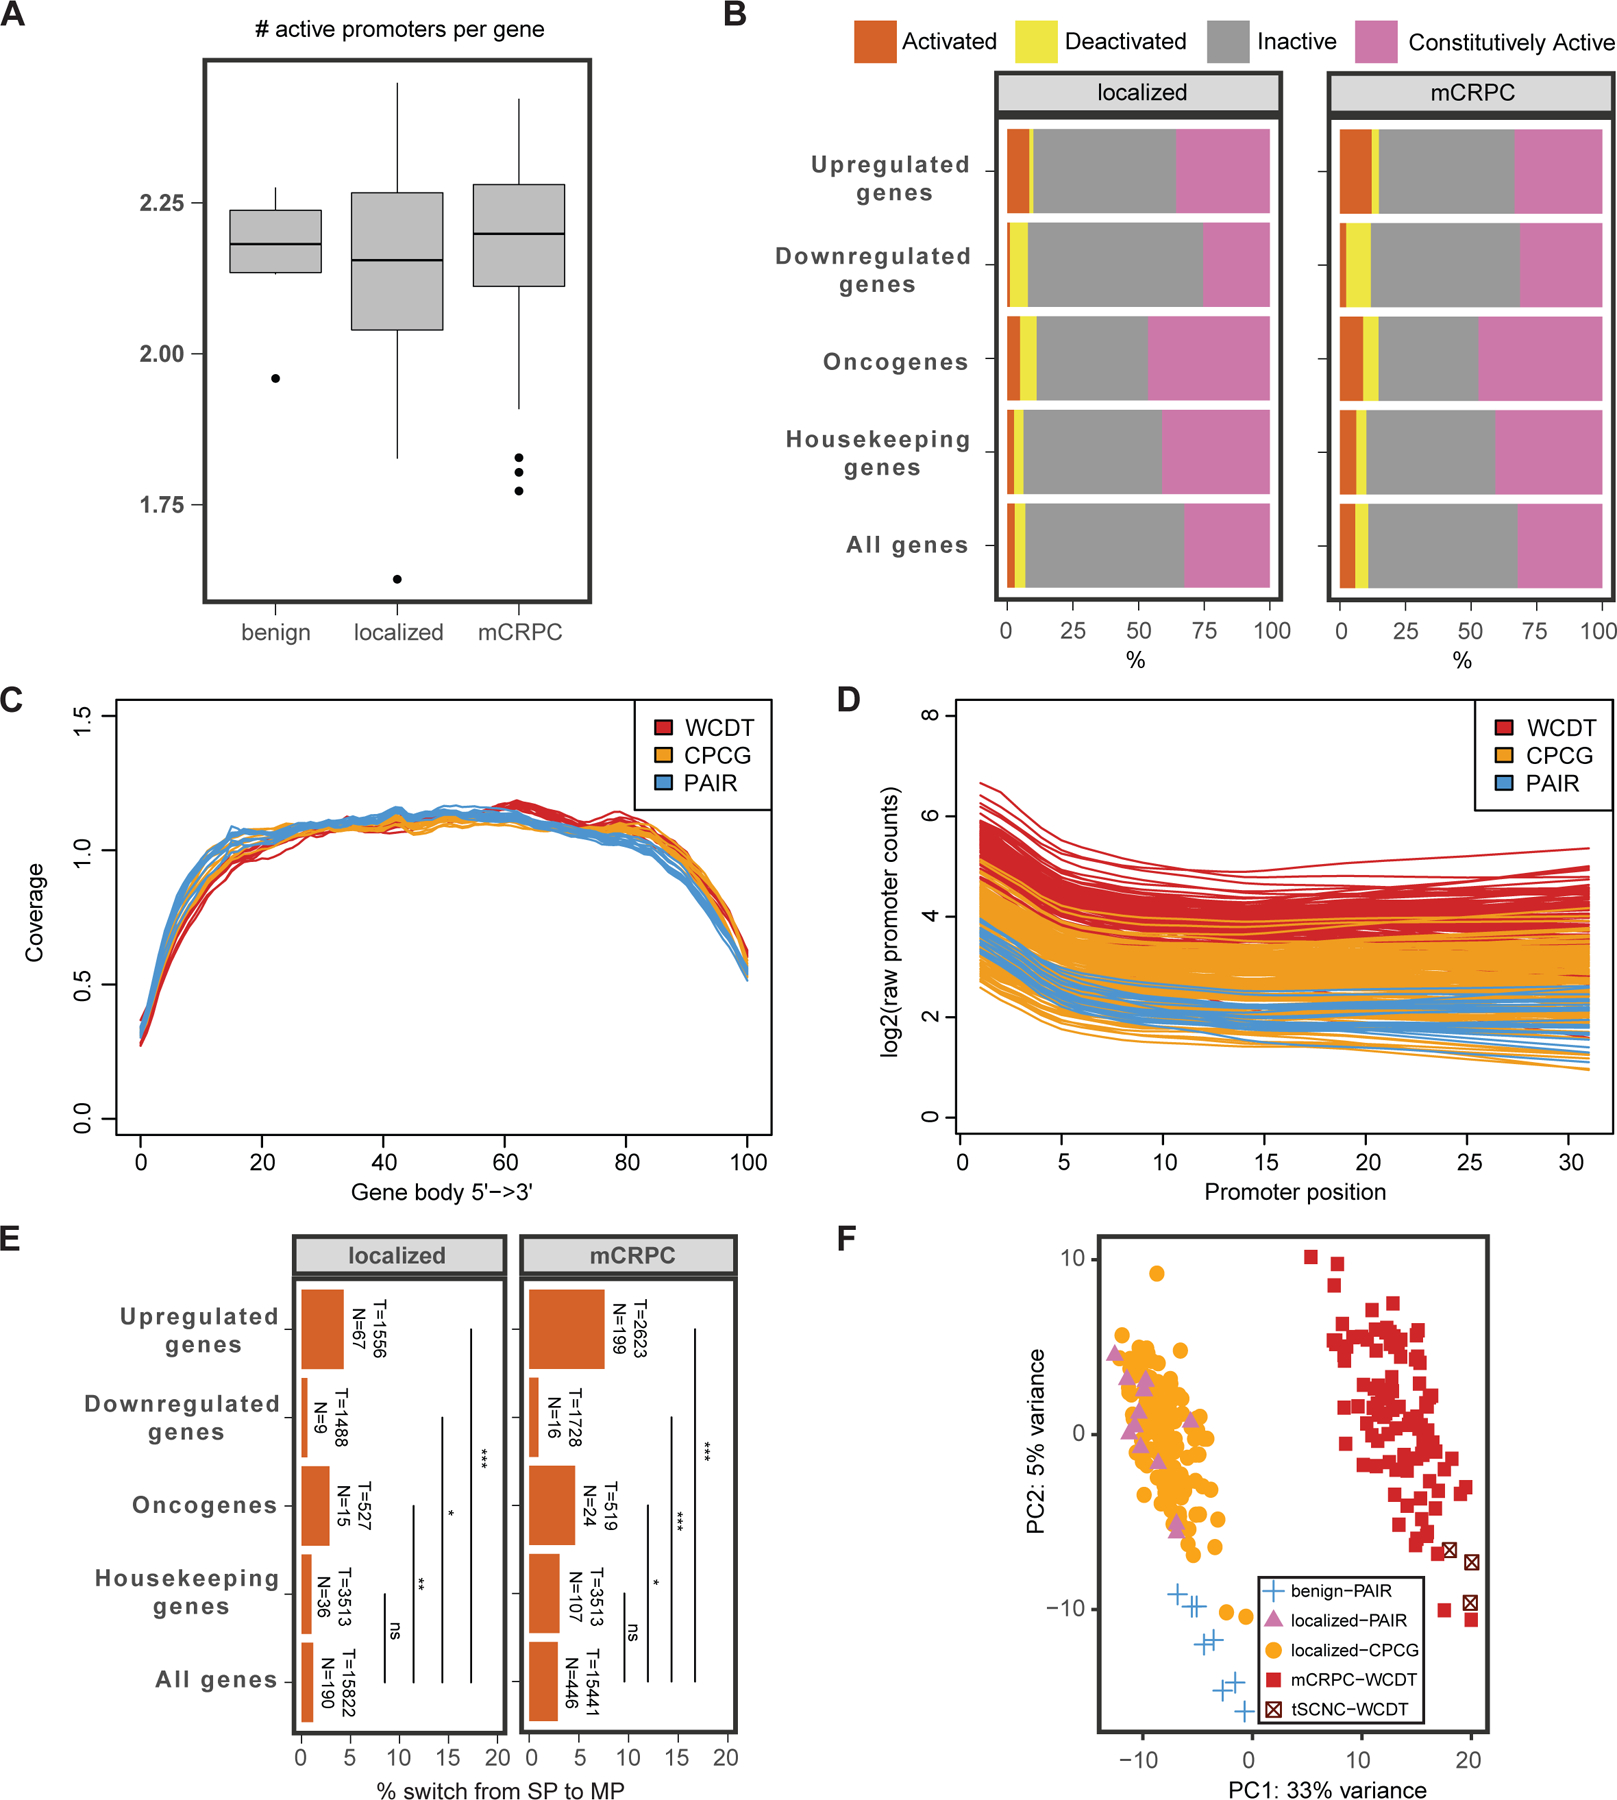
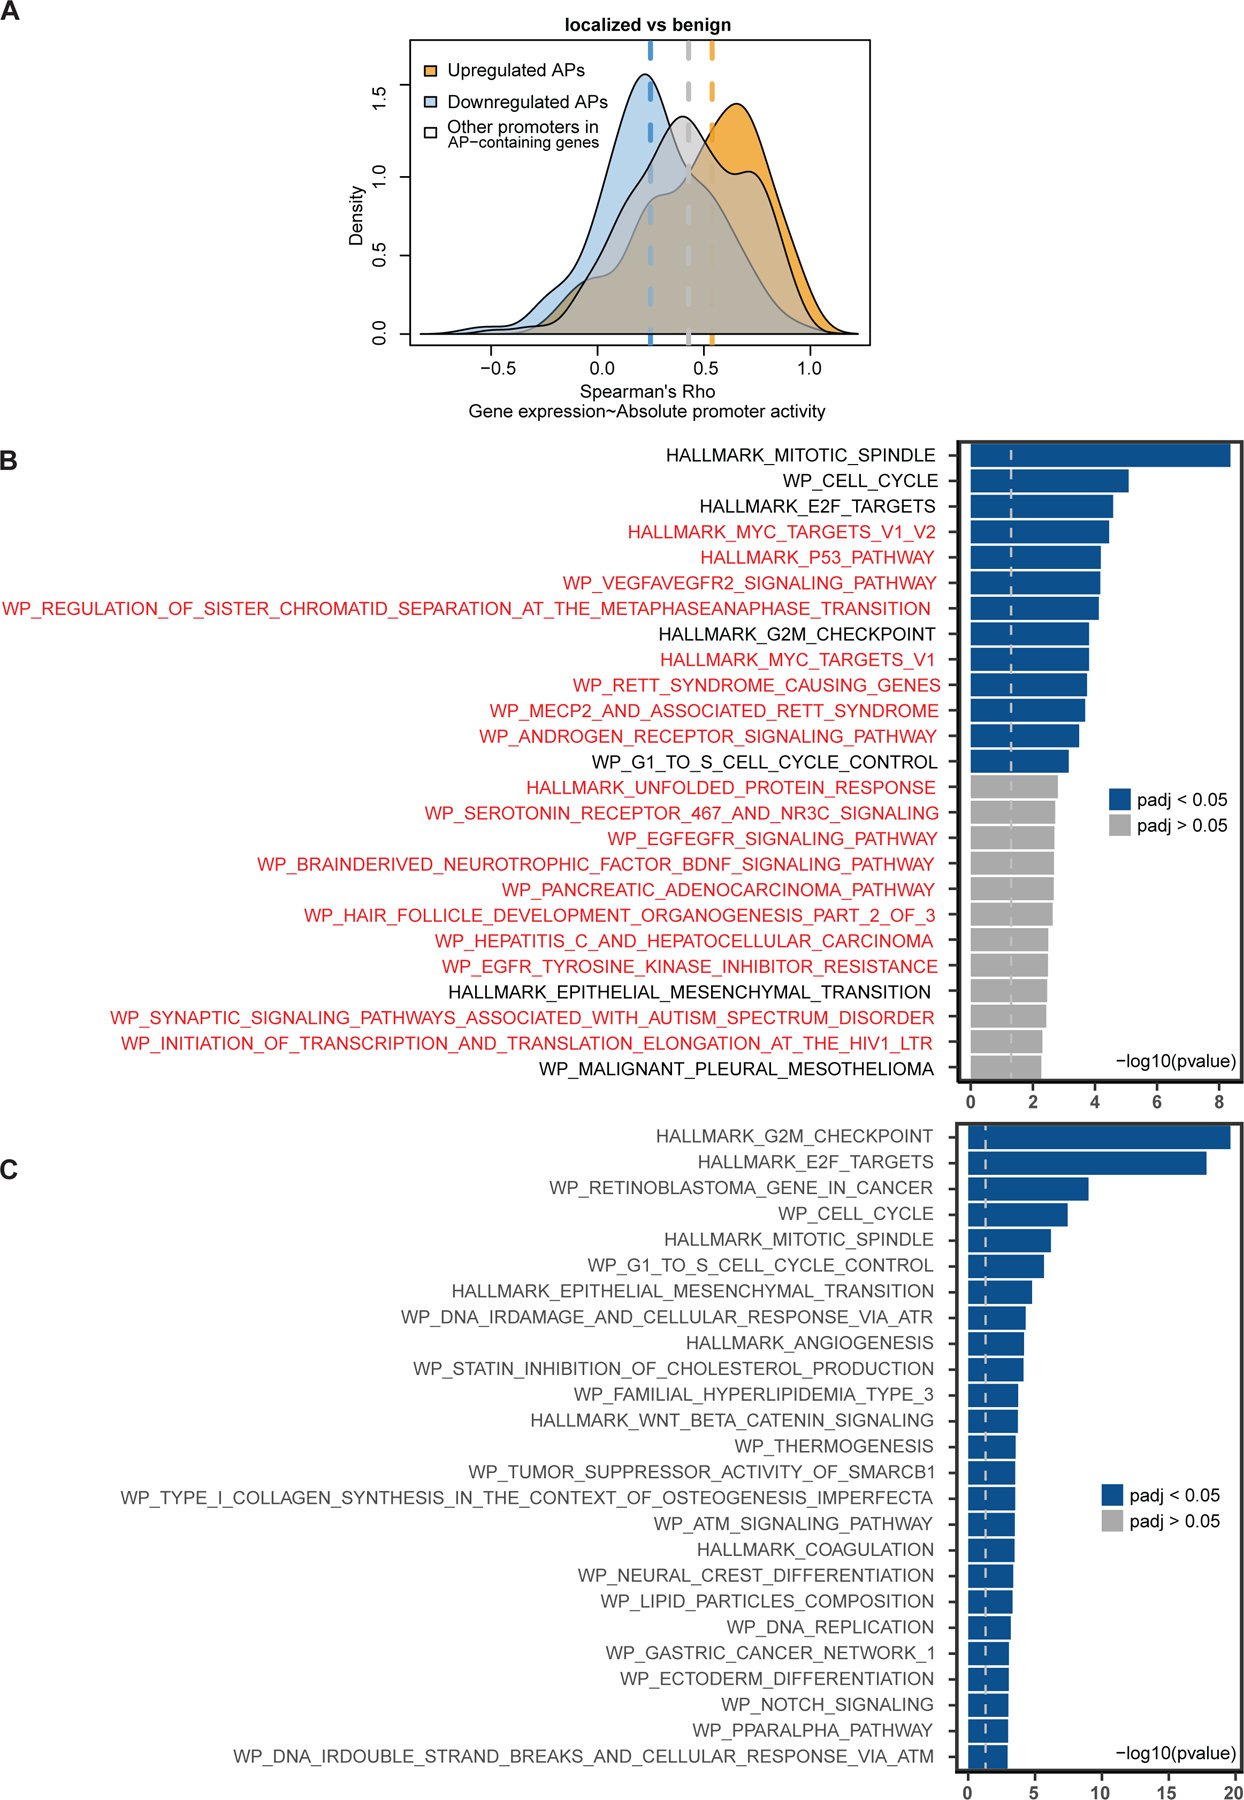
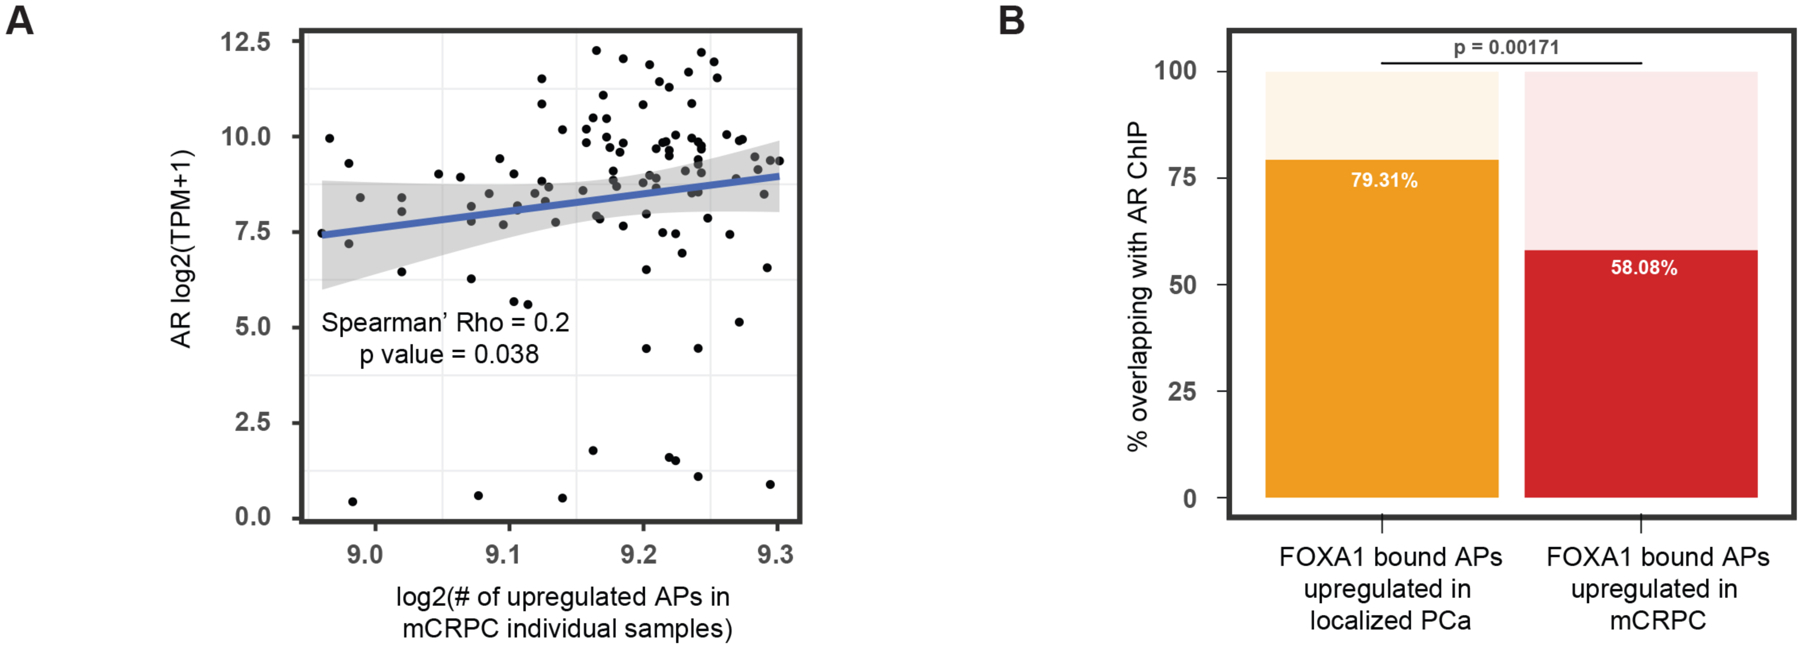
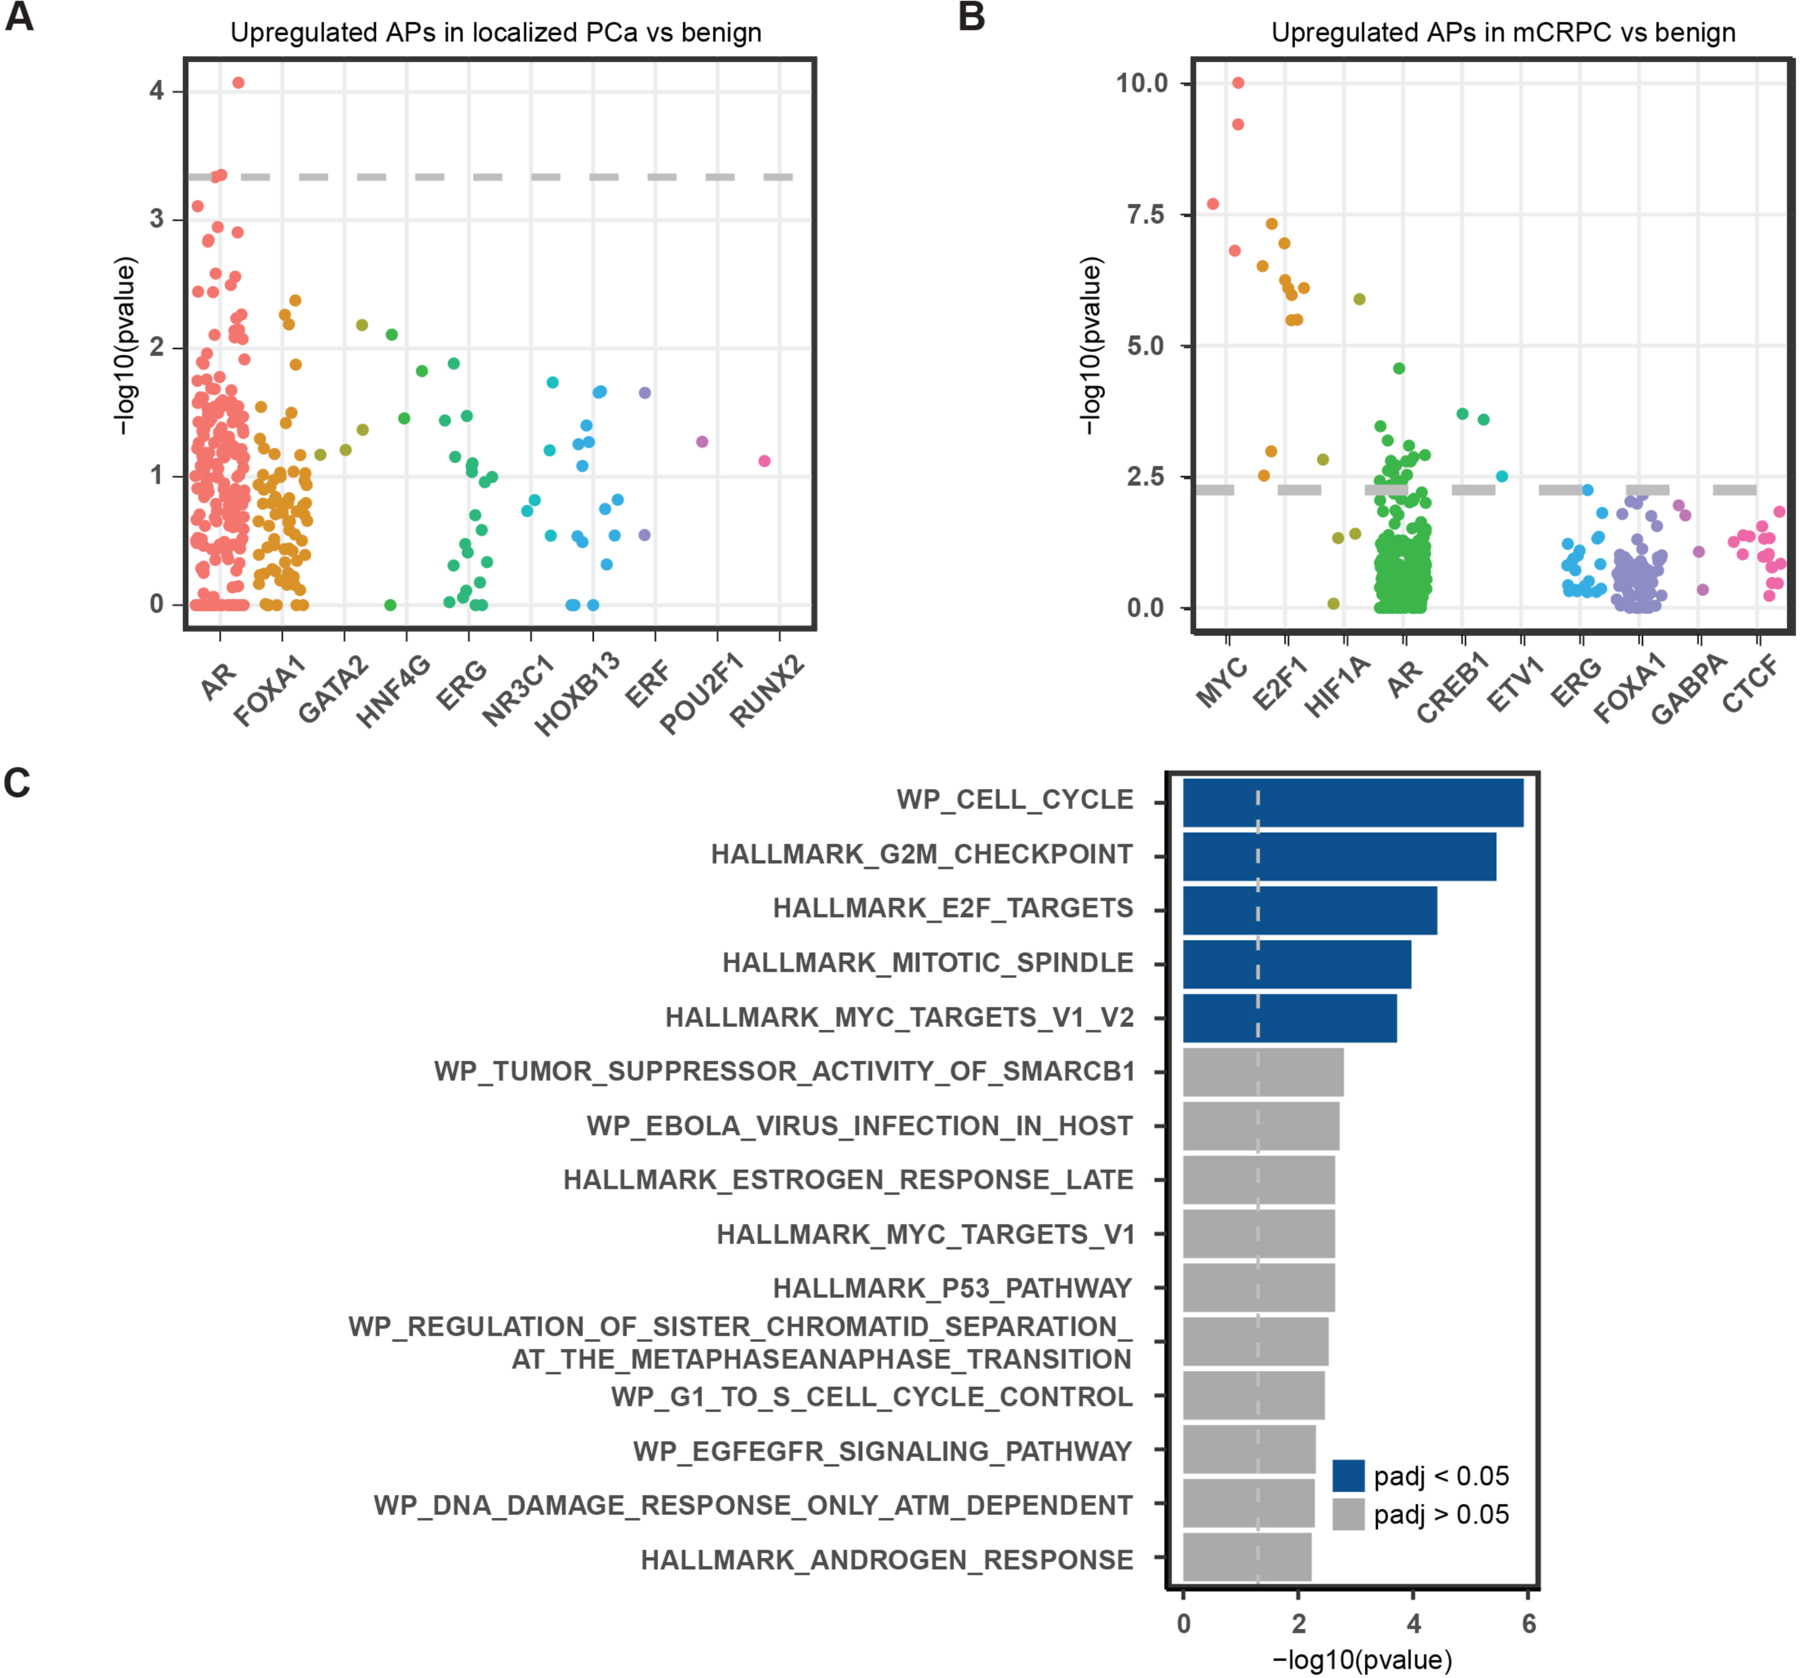
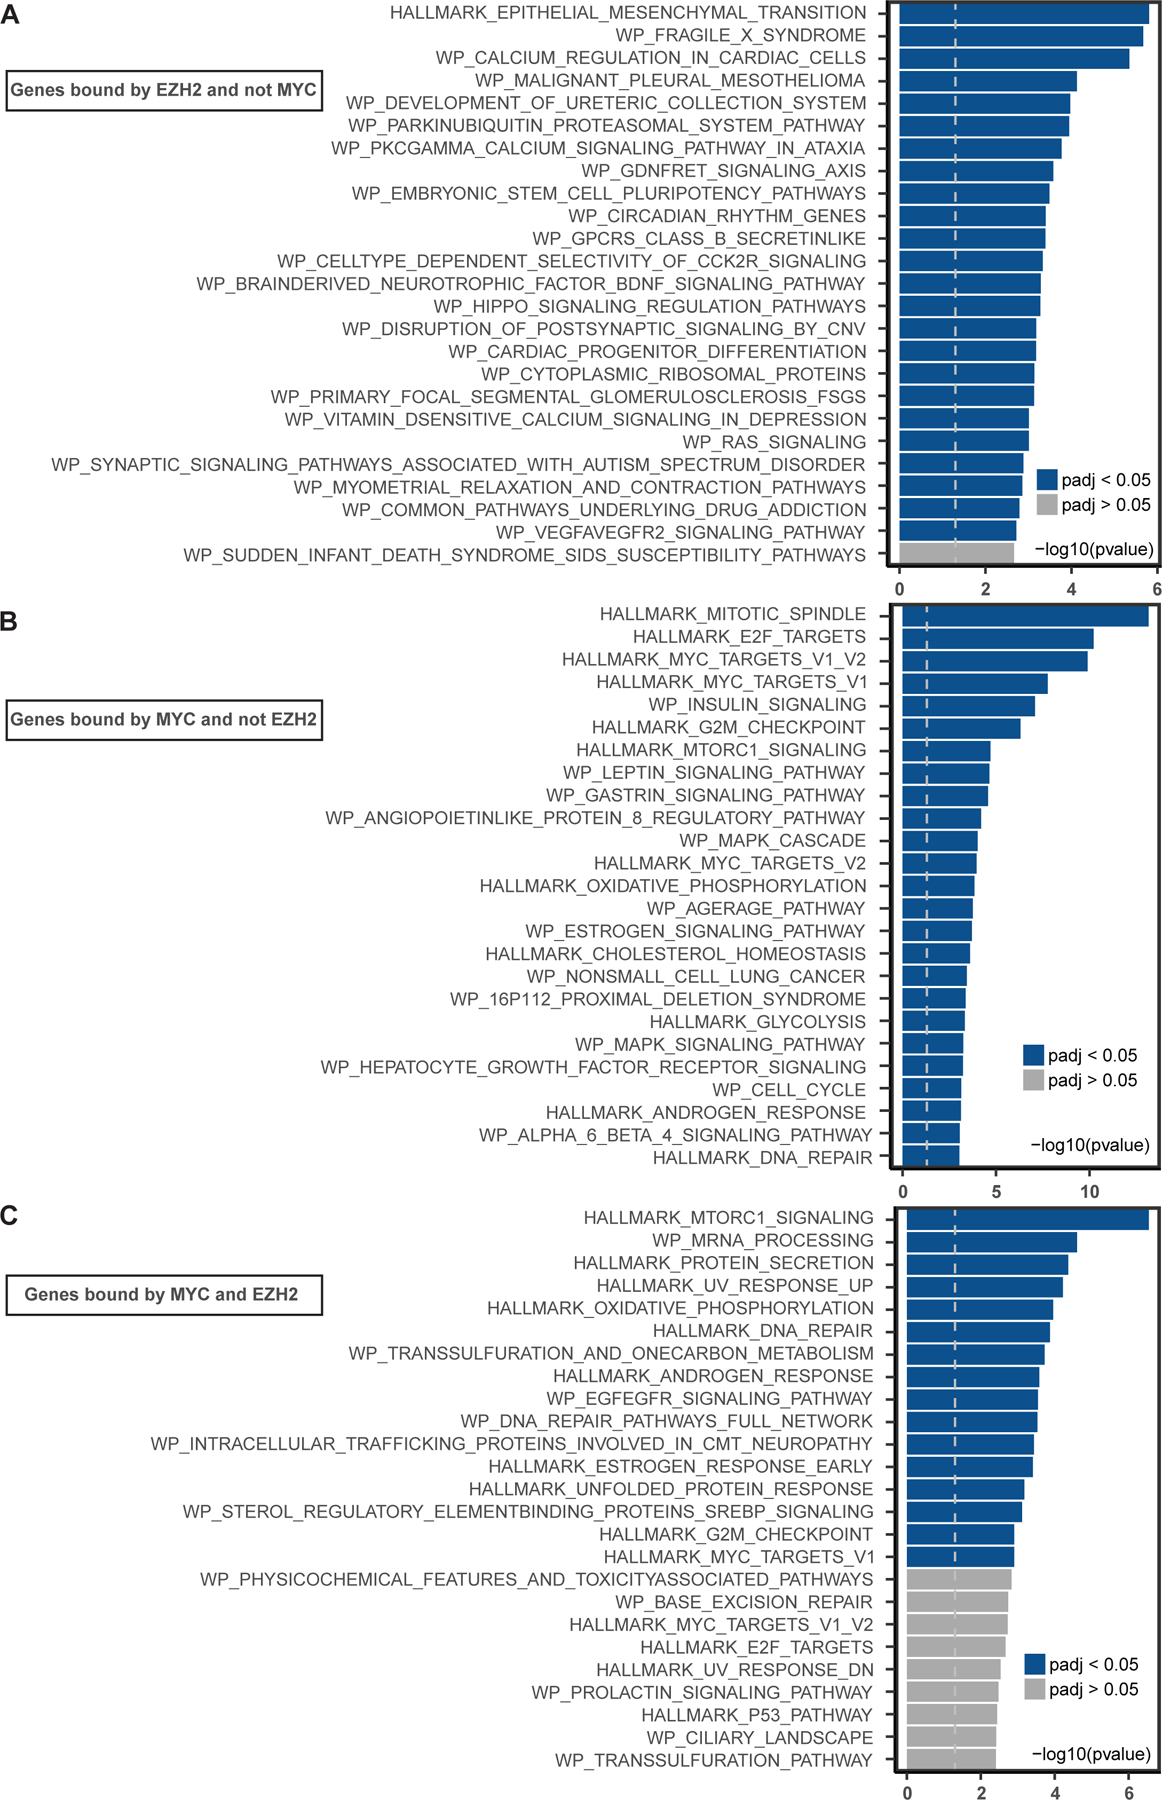
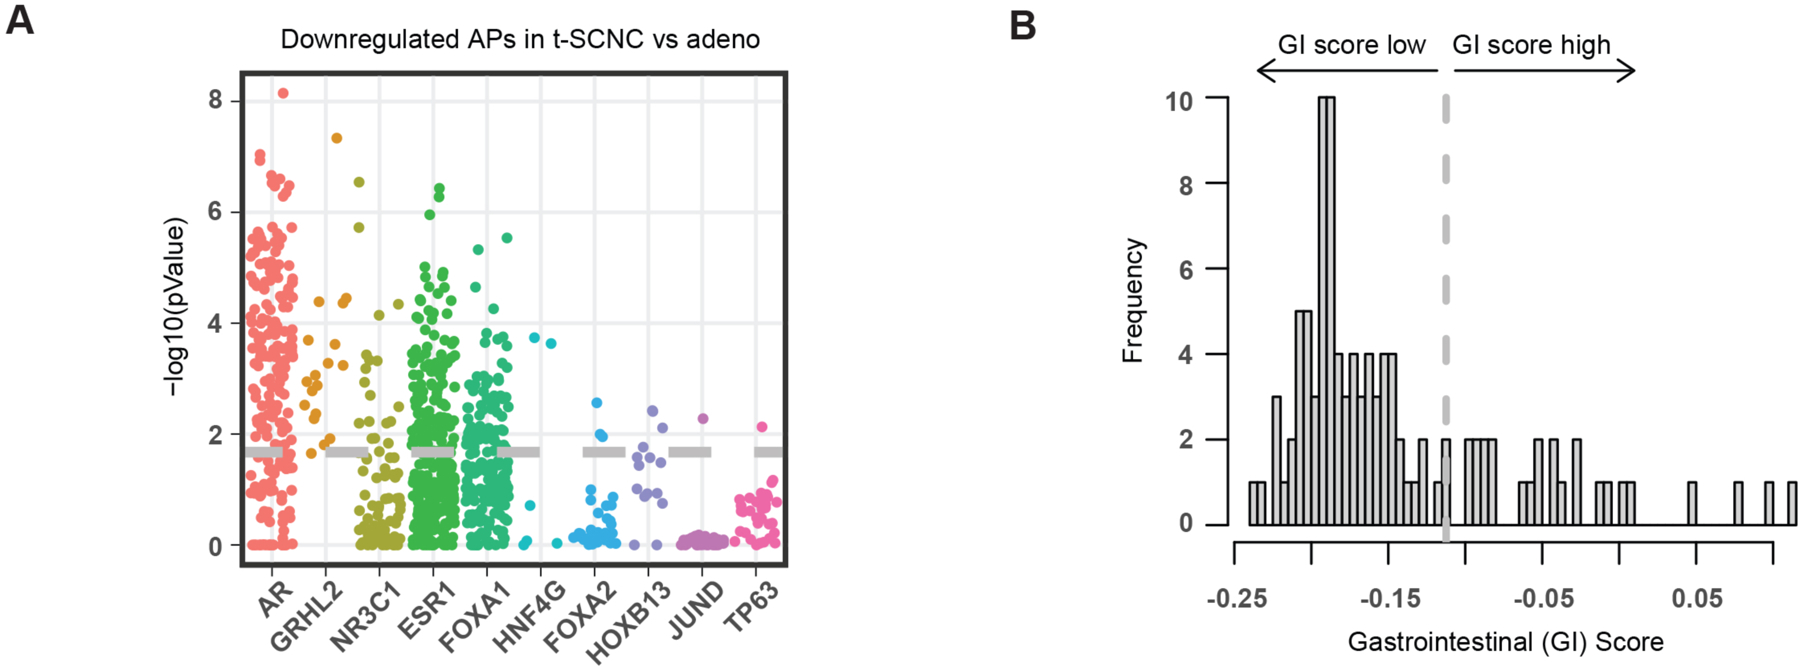
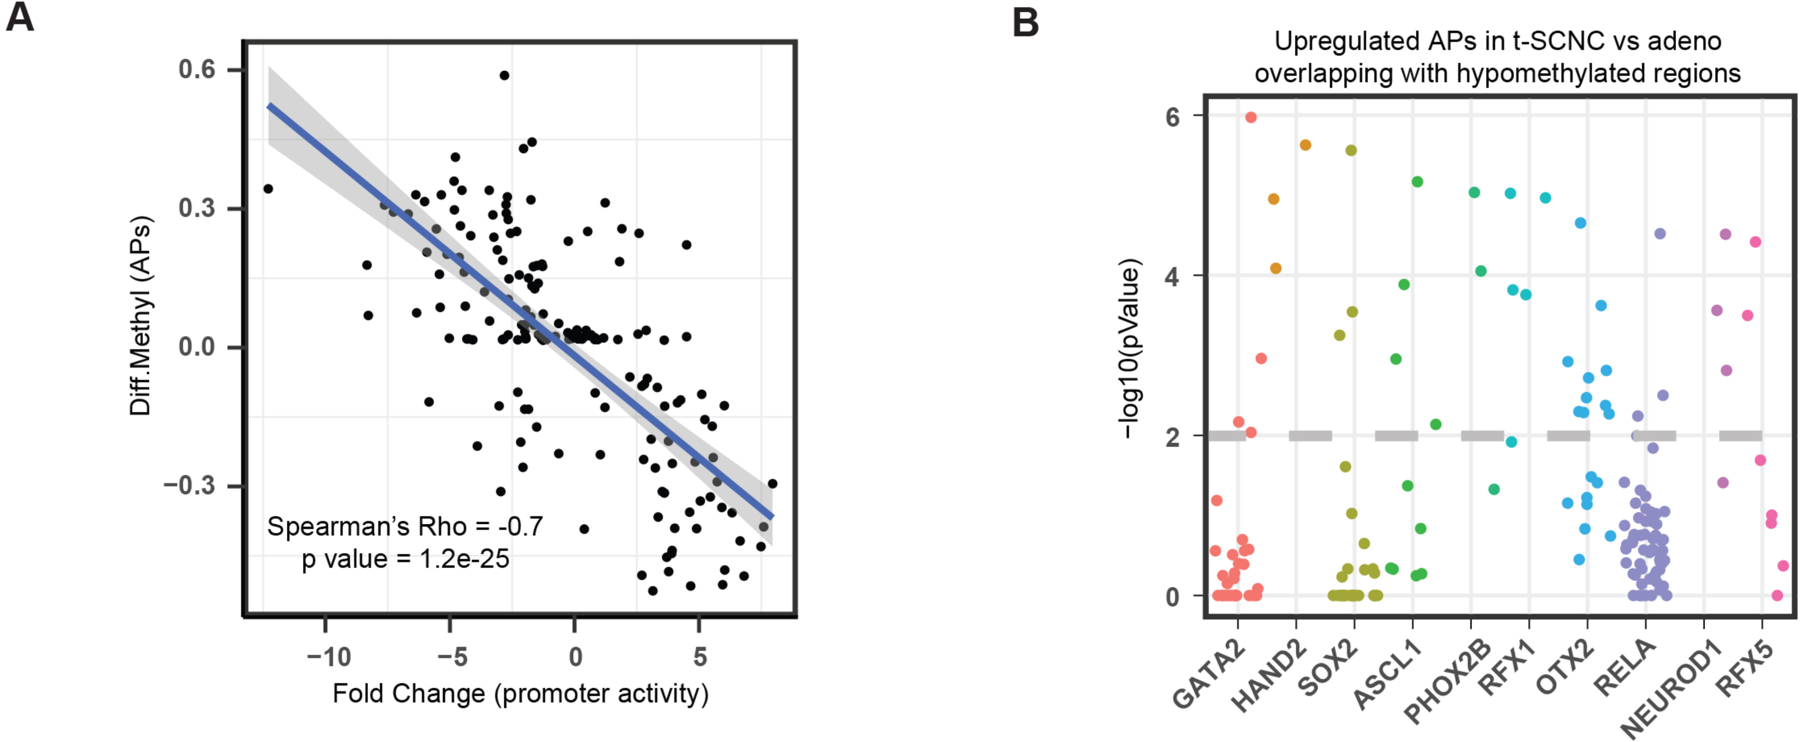
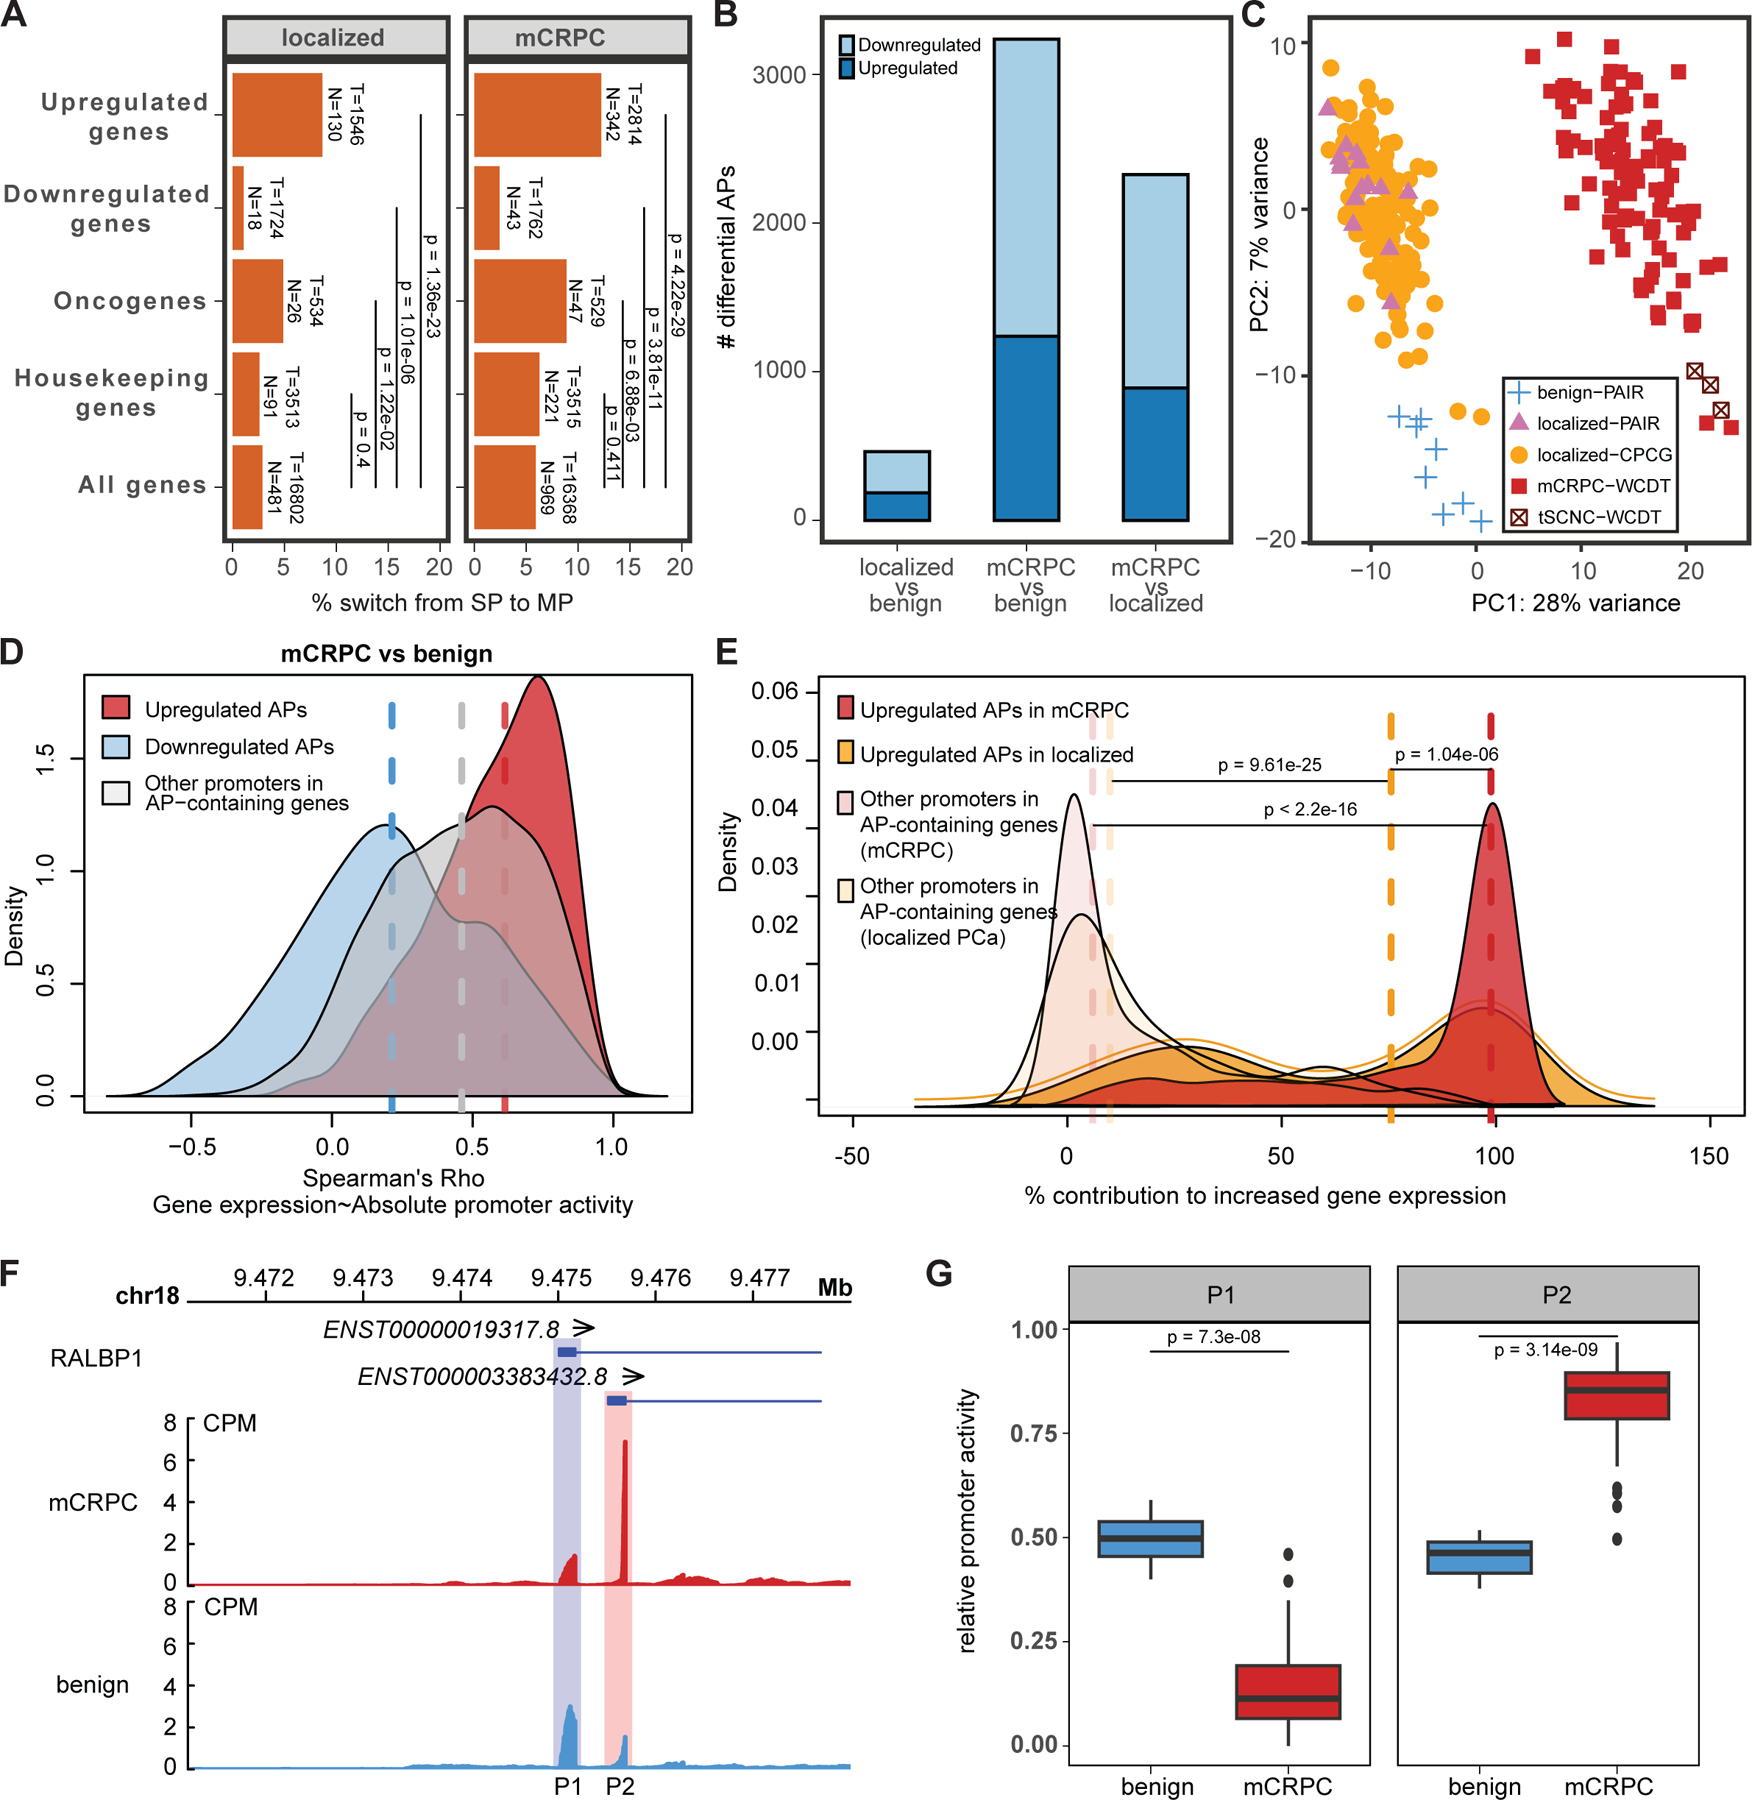
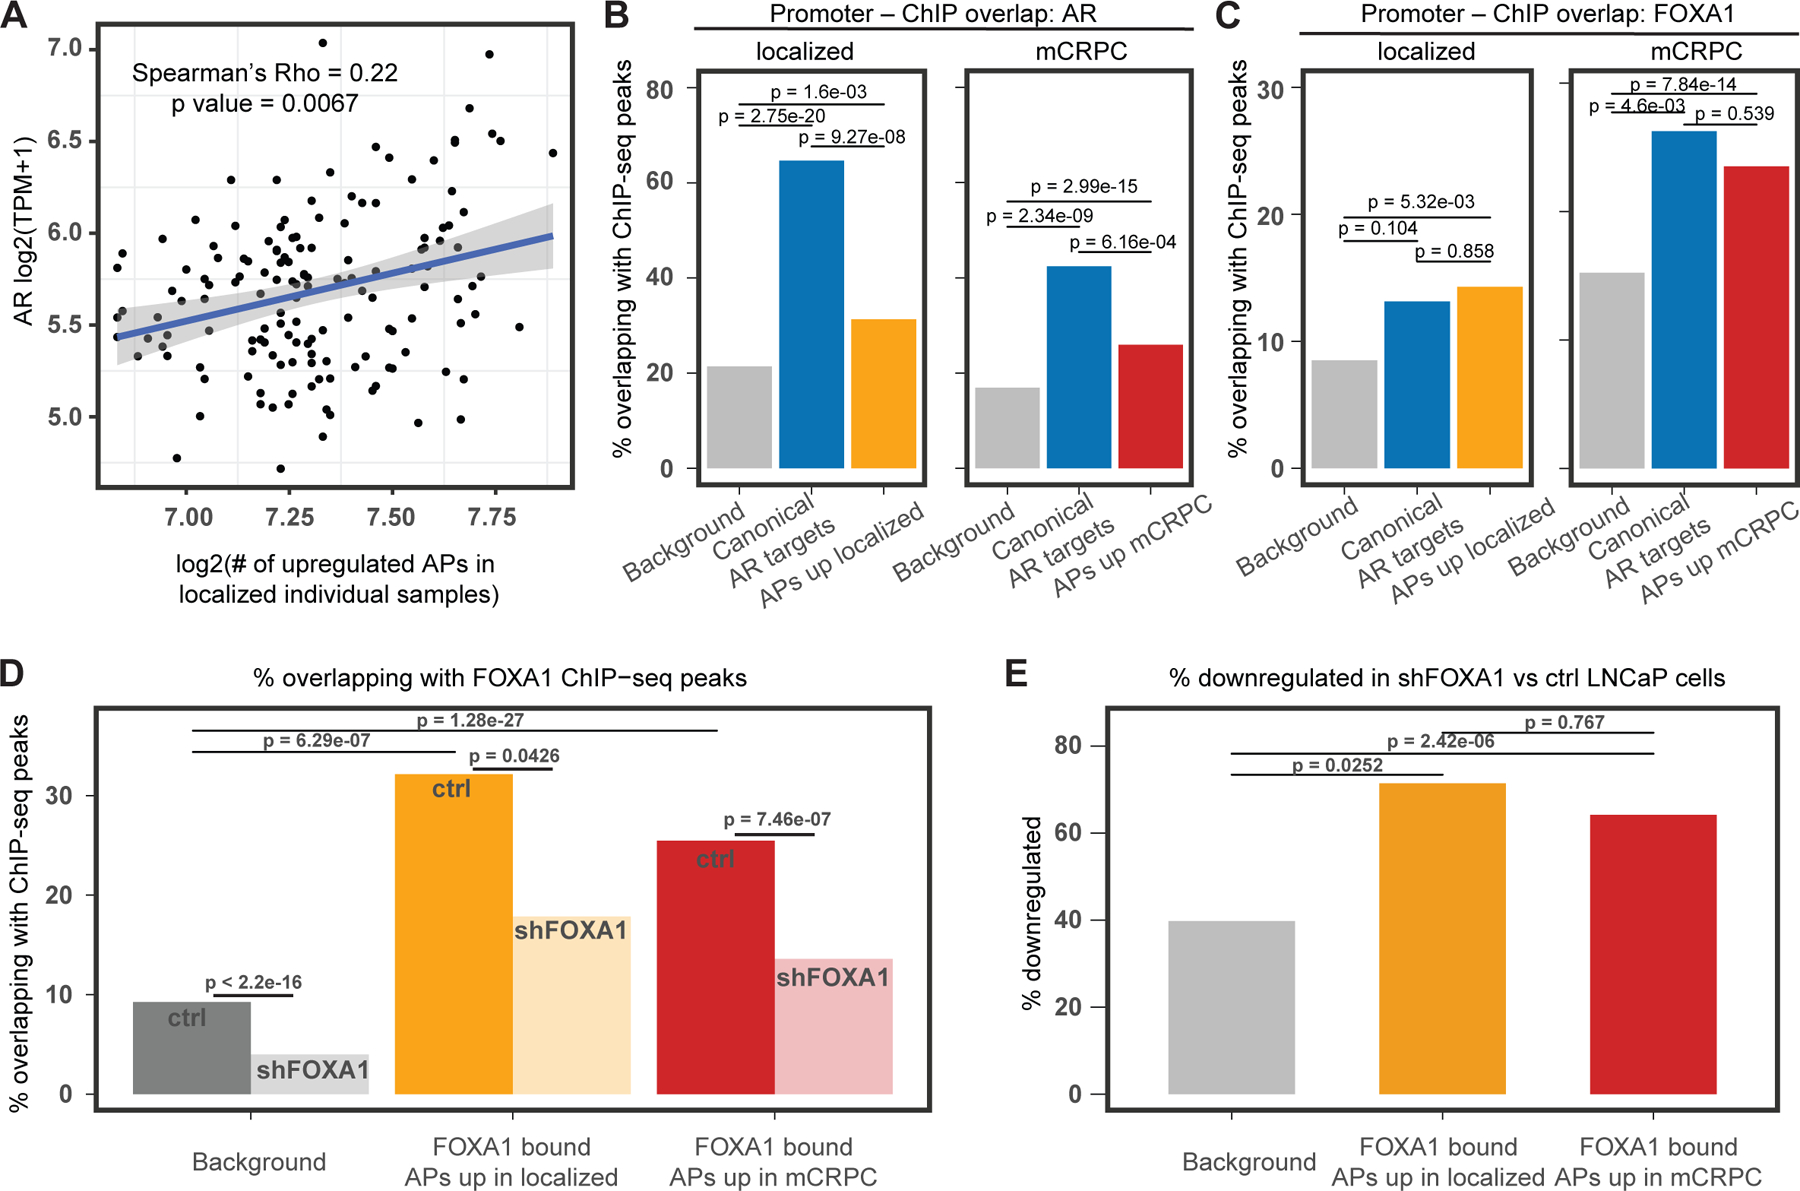
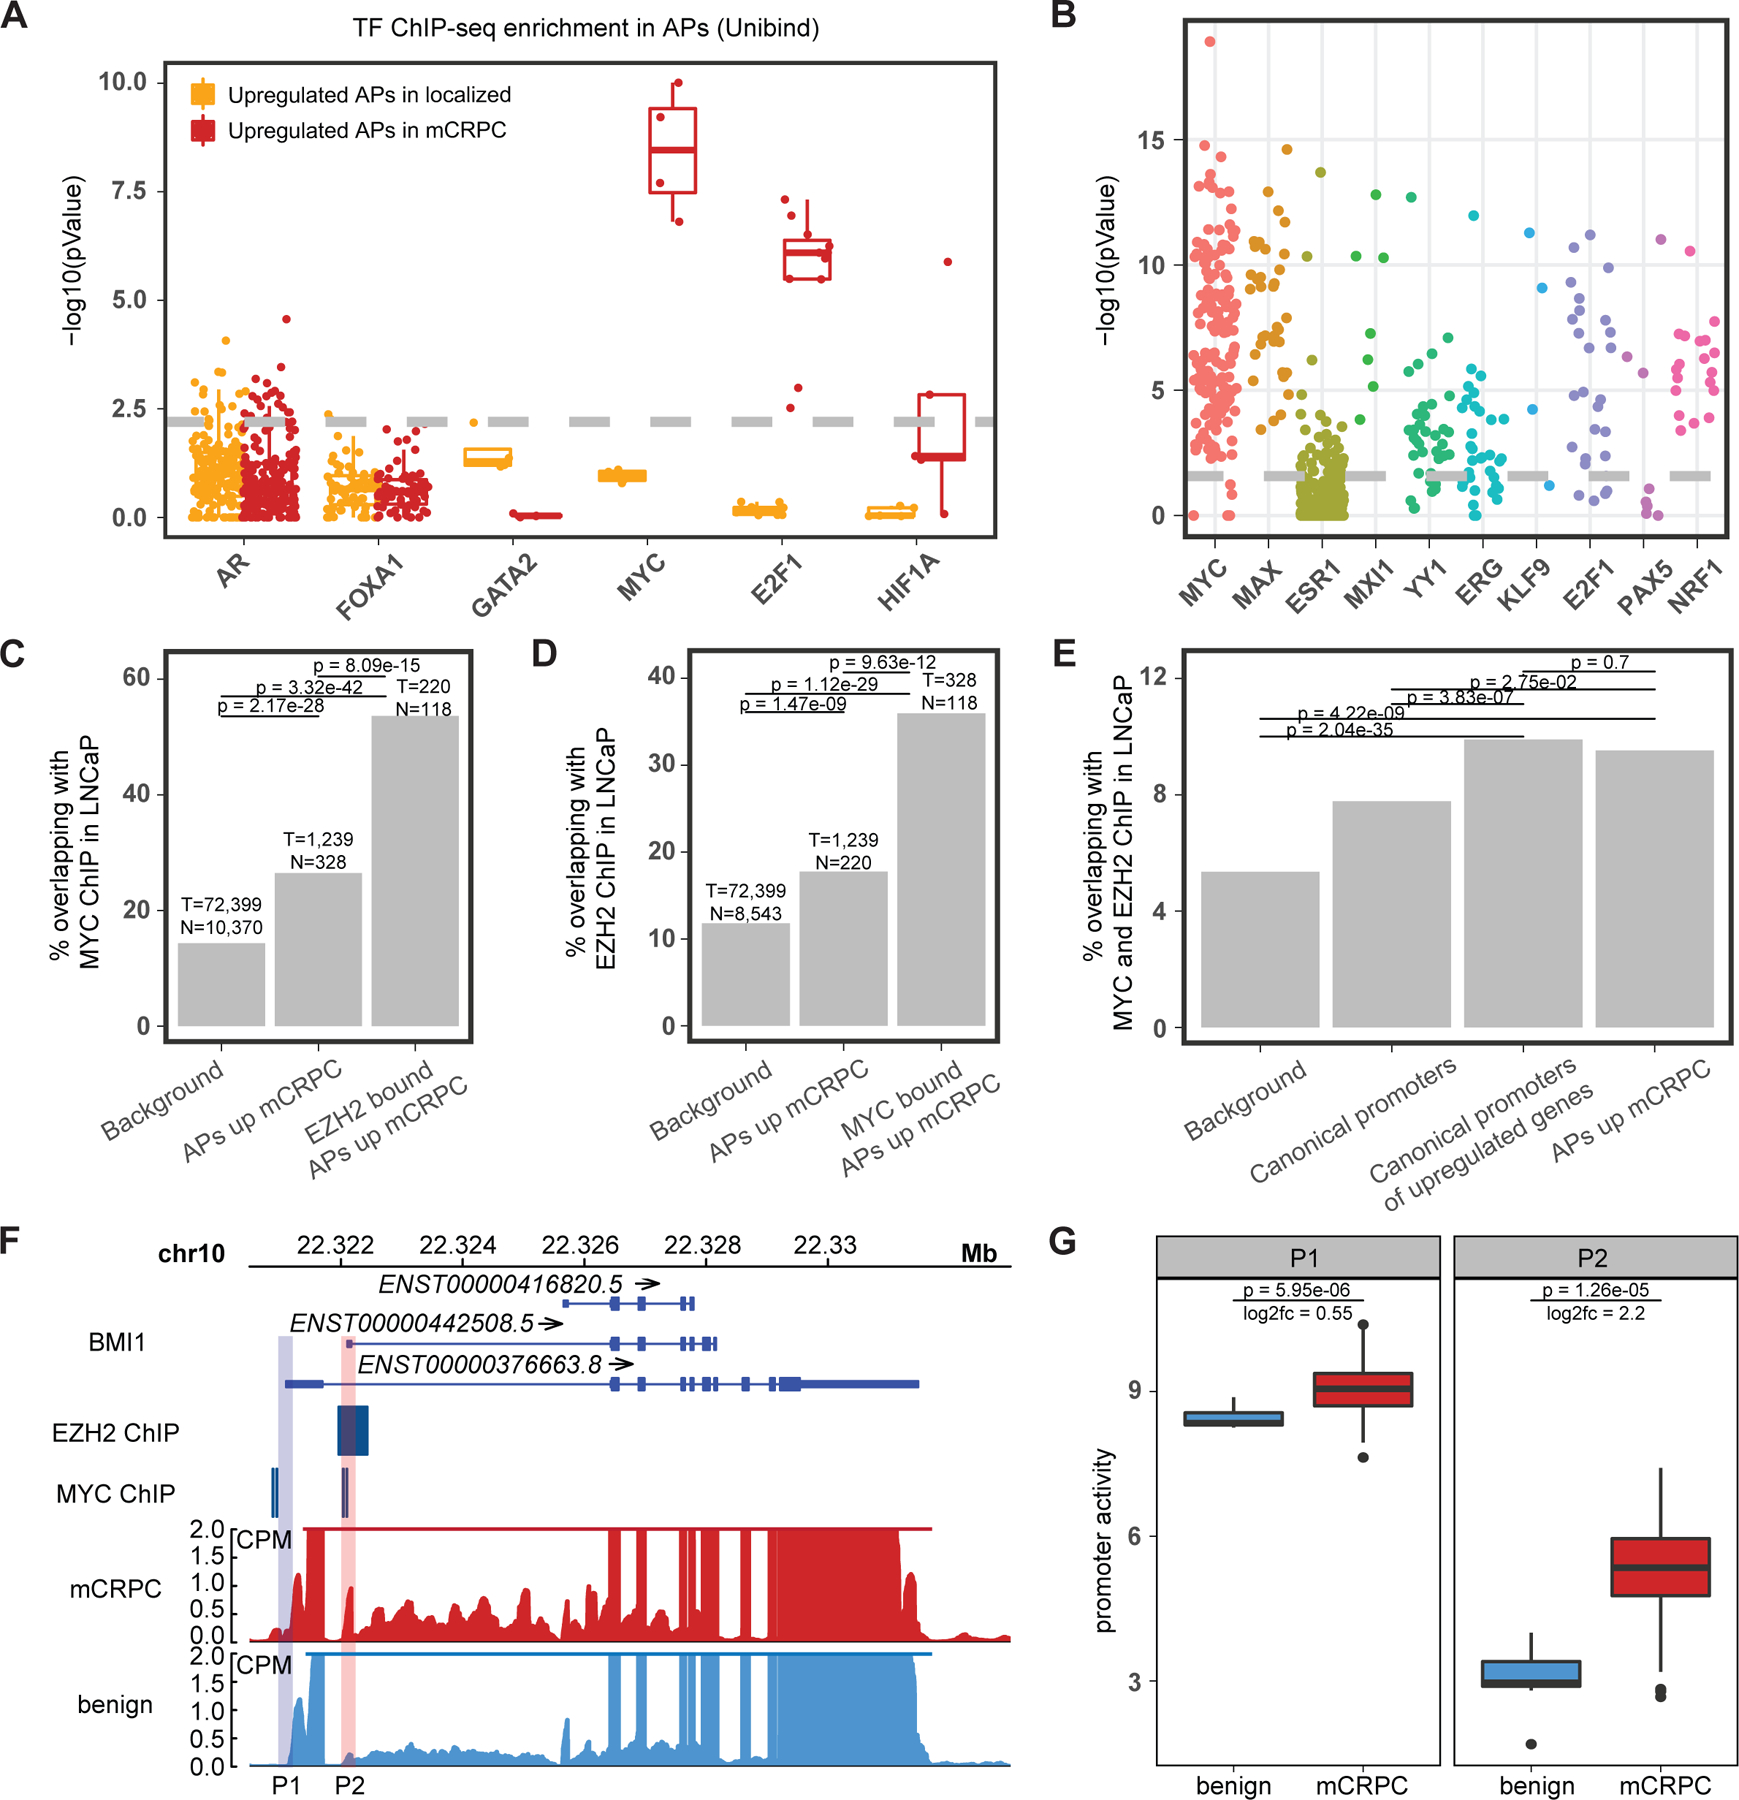
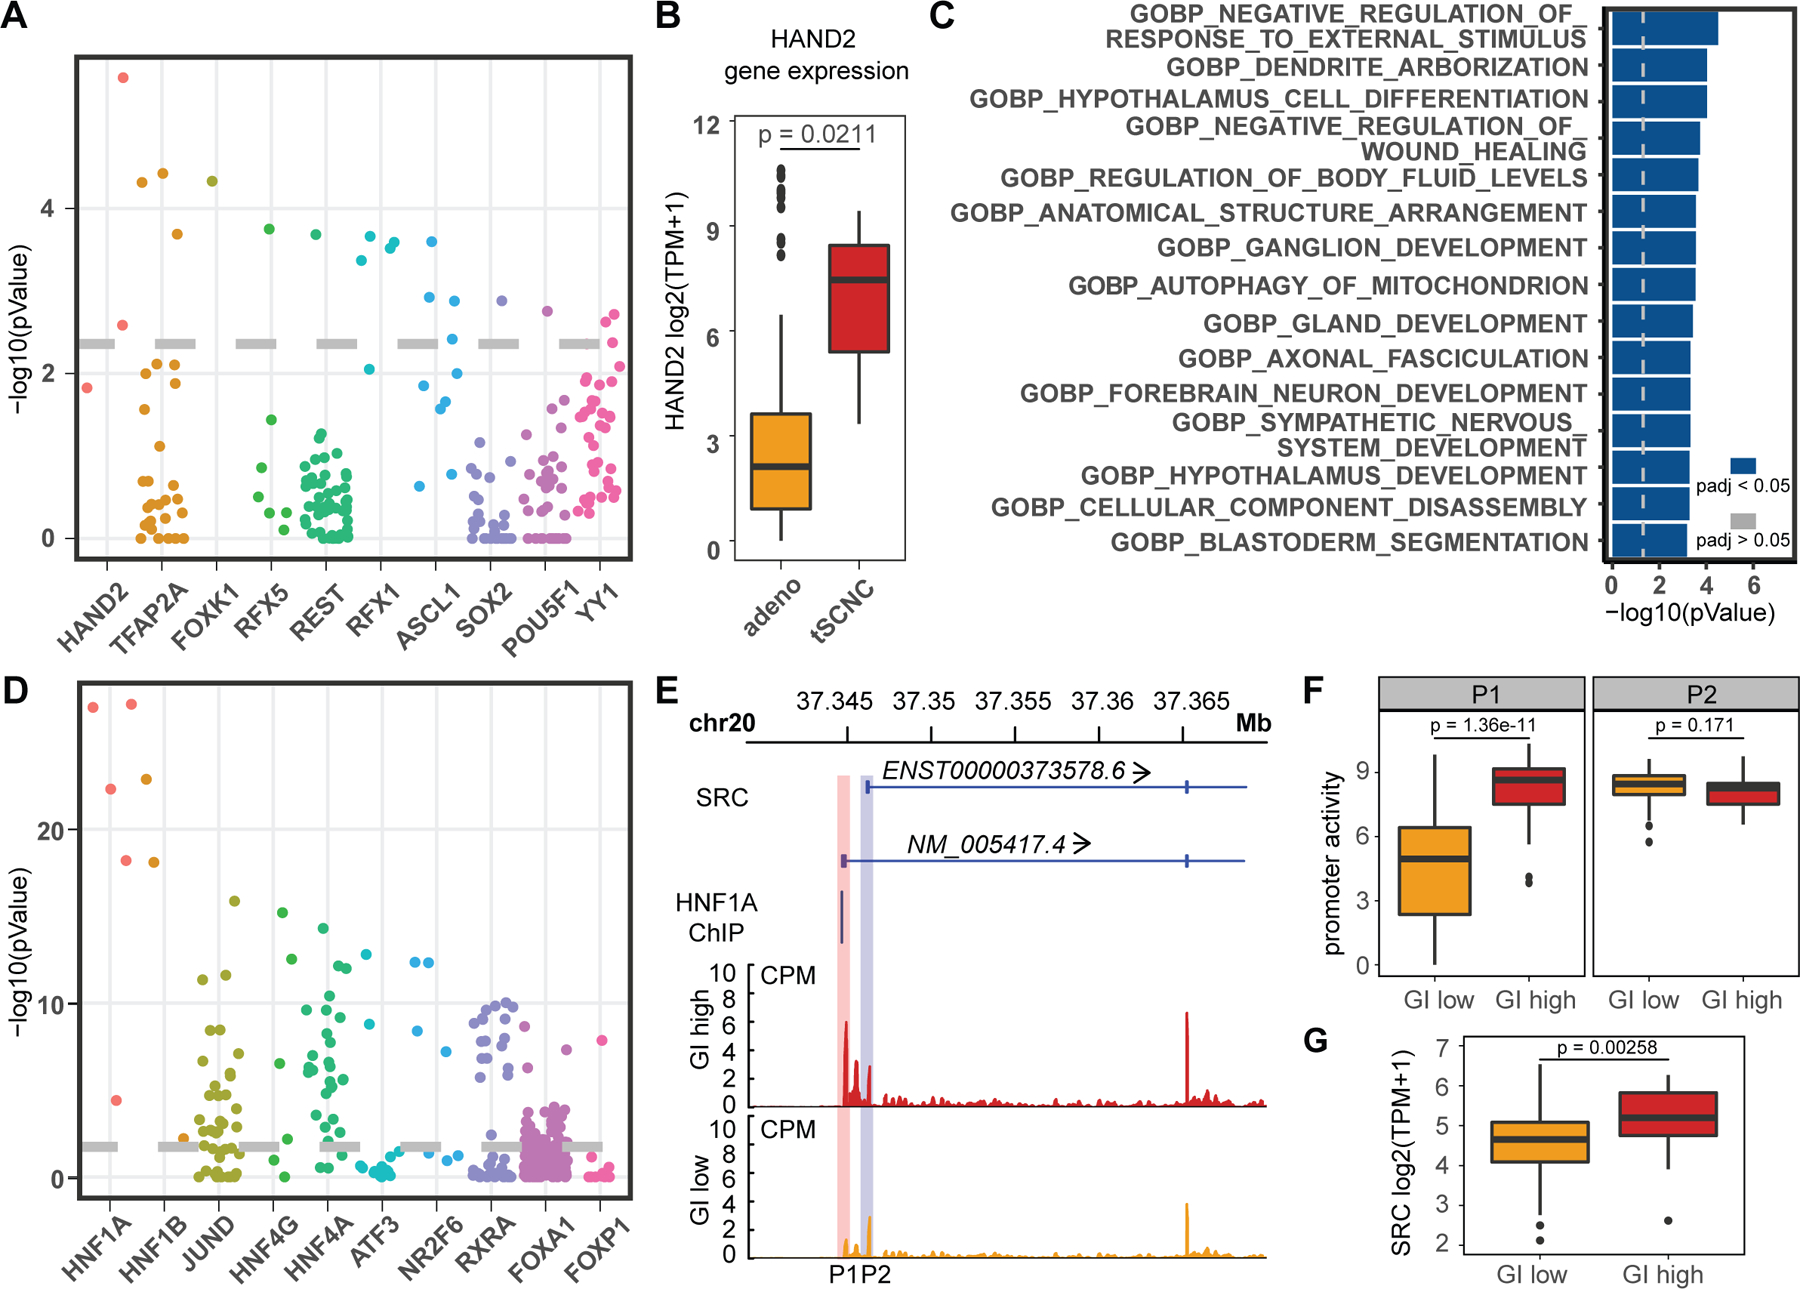
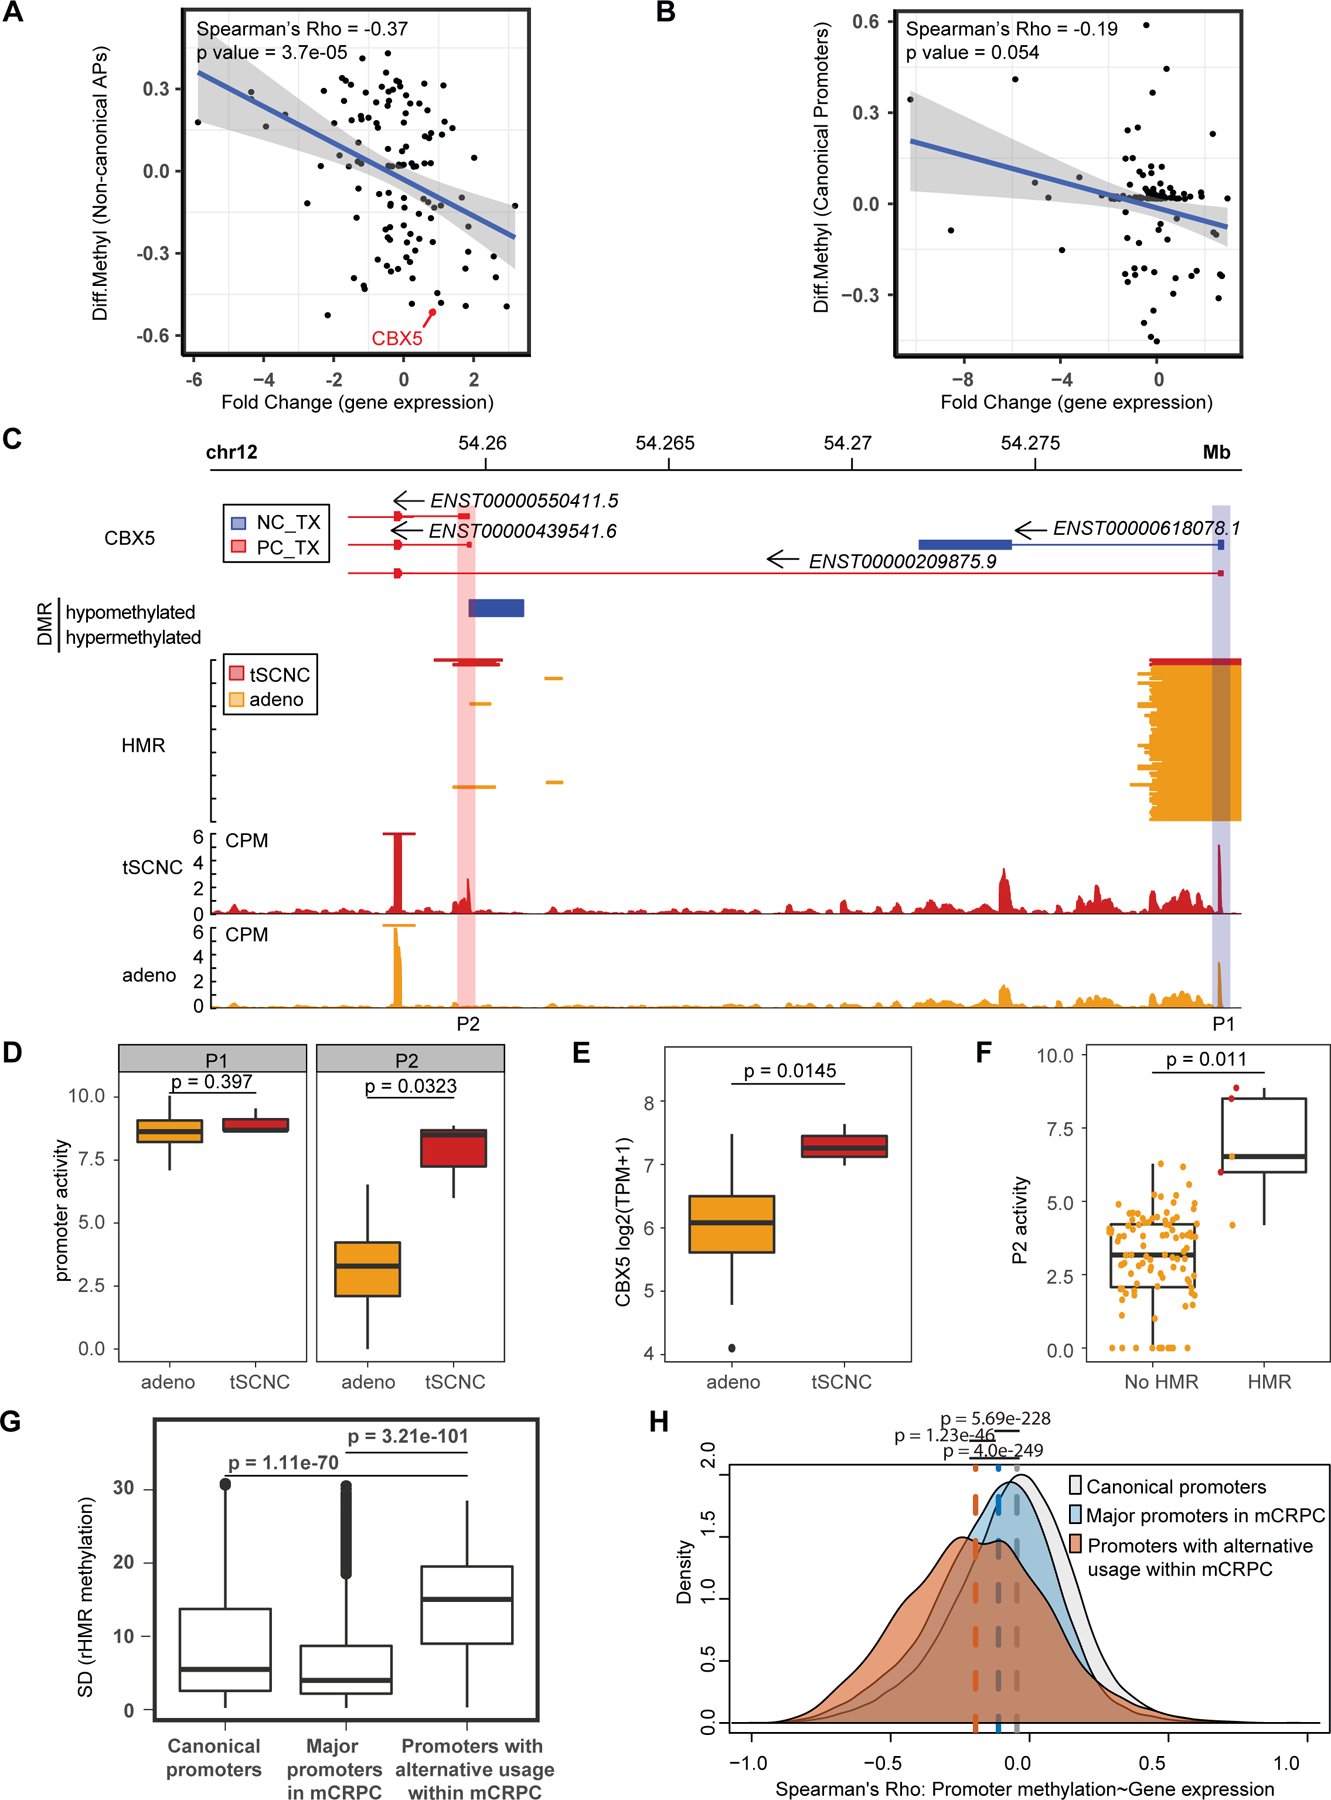
Transcription factor (TF) proteins regulate gene activity by binding to regulatory regions, most importantly at gene promoters. Many genes have alternative promoters (APs) bound by distinct TFs. The role of differential TF activity at APs during tumour development is poorly understood. Here we show, using deep RNA sequencing in 274 biopsies of benign prostate tissue, localized prostate tumours and metastatic castration-resistant prostate cancer, that AP usage increases as tumours progress and APs are responsible for a disproportionate amount of tumour transcriptional activity. Expression of the androgen receptor (AR), the key driver of prostate tumour activity, is correlated with elevated AP usage. We identified AR, FOXA1 and MYC as potential drivers of AP activation. DNA methylation is a likely mechanism for AP activation during tumour progression and lineage plasticity. Our data suggest that prostate tumours activate APs to magnify the transcriptional impact of tumour drivers, including AR and MYC.


Conflict of interest statement

COMPETING INTERESTS

J.J.A. has consulted for or held advisory roles at Astellas Pharma, Bayer and Janssen Biotech Inc. He has received research funding from Aragon Pharmaceuticals Inc., Astellas Pharma, Novartis, Zenith Epigenetics Ltd. and Gilead Sciences Inc. F.Y.F. has consulted for Astellas, Bayer, Blue Earth Diagnostics, BMS, EMD Serono, Exact Sciences, Foundation Medicine, Janssen Oncology, Myovant, Roivant, and Varian, and serves on the Scientific Advisory Board for BlueStar Genomics and SerImmune. F.Y.F. has patent applications with Decipher Biosciences on molecular signatures in prostate cancer unrelated to this work. F.Y.F. has a patent application licensed to PFS Genomics/Exact Sciences. F.Y.F. has patent applications with Celgene unrelated to this work. The remaining authors declare no competing interests.

Figures

Extended Data Figure 1.
Extended Data Figure 1.. Optimization for promoter activity estimation.
A) An overall schematic of the samples, data processing, and principle tools used for the analysis. PAIR: from the Henri Mondor institution, CPCG: Canadian Prostate Cancer Genome Network, WCDT: West Coast Dream Team, t-SCNC: treatment-emergent small cell neuroendocrine carcinoma. B) An illustration of the promoter activity estimation methods. Solid boxes represent exons while the lines represent introns. The promoter (P1, P2, P3) are defined as the first 5’ TSSs (transcription start sites) of overlapping first exons. The splice junction reads (SJ) from the overlapping first exons were summed and log2-normalized to represent the transcriptional activity of the promoters. The activity of the internal promoter P2 driven isoform C (TXC) can be corrected by the split read ratios or split read subtractions method to exclude transcriptional activity from isoform B (TXB) (see Methods for details). TX: transcript, SJ: splice jucntion. C) Correlations between the CAGE (cap analysis of gene expression) tag reads and the promoter activity calculated using RNA-seq data of non-internal promoters without correction, internal promoters without correction, internal promoters corrected by the split read ratios method, and internal promoters corrected by the split read subtractions method. The matching CAGE and RNA-seq data from the same samples were from FANTOM5. Upper row: representative correlation plots showing one human adult testis sample. Lower row: a box plot showing Spearman’s correlation coefficients for all 67 samples with matching CAGE and RNA-seq data. D) Number of high confidence promoters (dark gray, see Methods for details) and non high confidence promoters (light gray) in the non-internal and internal promoters category. E) A representative sample downsampled to 31.25 million (M), 62.5M, 125M, 250M, 500M, and 750M reads from 1000M. The bars show the number of active promoters detected at each read depth (left y axis). Lines connected by points show the number of new promoters detected per million reads, with values indicated on the right axis.
Extended Data Figure 2.
Extended Data Figure 2.. Activation of additional promoters is associated with gene expression upregulation.
A) The number of active promoters normalized to the number of expressed genes for each individual sample grouped by disease stages. Genes with nonzero counts were considered as expressed. B) Upregulated and downregulated genes were identified by differential gene expression analysis. Bar plot shows the percentage of genes in each category that switch between single-promoter active and multiple-promoter active in benign prostate and localized PCa (left) or mCRPC (right). Activated: switch from SP (single-promoter active) in benign to MP (multiple-promoter active) in tumors. Deactivated: switch from MP in benign to SP in tumors. Inactive: SP in both benign and tumors. Constitutively active: MP in both benign and tumors. C) The RNA-seq coverage across gene body from 5’ to 3’ for ten random samples from each of the dataset (PAIR, CPCG, and WCDT) in our data collection. D) The EDASeq bias plot of the positional biases in unnormalized promoter counts of all samples from the RNA-seq datasets (PAIR, CPCG, and WCDT) in our data collection. E) The analysis of number of genes switching from single promoter active in benign prostate to multiple promoters active in localized (left) or mCRPC (right) using the RNA-seq dataset all down-sampled to 80M reads/sample. SP: single -promoter active, MP: multiple-promoter active. *p value < 0.05, **p value < 0.01, ***p value < 0.005 (Fisher’s exact tests). F. Principle component analysis of all samples of different disease stages from three cohorts using the down-sampled RNA-seq dataset.
Extended Data Figure 3.
Extended Data Figure 3.. Alternative promoter usage occurs in cancer related genes.
A) Density plot of the Spearman’s correlation rho values between absolute promoter activity and corresponding gene expression for upregulated APs, downregulated APs and non-differential promoters in genes with differential APs in localized PCa vs benign prostate. B) Pathway enrichment analysis of genes with upregulated APs in mCRPC vs benign. Highlighted in red are pathways enriched for the genes with upregulated APs but not in upregulated genes. Dashed line shows p value 0.05. C) Pathway enrichment analysis result of genes upregulated in mCRPC vs benign prostate. Dashed line shows p value 0.05.
Extended Data Figure 4.
Extended Data Figure 4.. Alternative promoter usage is associated with AR levels.
A) Correlation between the number of upregulated APs in individual mCRPC samples with AR expression levels. B) The percentage of AR and FOXA1 co-binding in the FOXA1 bound upregulated APs in localized PCa and mCRPC (Fisher’s exact test).
Extended Data Figure 5.
Extended Data Figure 5.. Alternative promoter usage is associated with driver transcription factors.
A, B) Unibind results showing significance of overlap between transcription factor (TF) ChIP-seq peaks and upregulated APs in localized PCa (A) or mCRPC (B). Each dot represents one ChIP-seq dataset. TFs were ranked by the most significant ChIP-seq dataset. Dashed line: BH adjusted p value = 0.05. C) Pathway enrichment analysis of genes with APs upregulated in mCRPC vs benign prostate and overlapping with MYC ChIP-seq peaks in LNCaP cells. Dashed line: p value 0.05.
Extended Data Figure 6.
Extended Data Figure 6.. Enriched pathways in genes whose promoters are bound by MYC, EZH2 or both.
Pathway enrichment analyses of genes with promoters overlapping with EZH2 LNCaP ChIP-seq peaks only (A), with MYC LNCaP ChIP-seq peaks only (B), and with both MYC and EZH2 LNCaP ChIP-seq peaks (C). Dashed line: p value 0.05.
Extended Data Figure 7.
Extended Data Figure 7.. Alternative promoter usage reflects lineage plasticity in mCRPC.
A) Unibind results showing significance of overlap between TF ChIP-seq peaks and downregulated APs in t-SCNC vs adenocarcinoma mCRPC. Each dot represents one ChIP-seq dataset. TFs were ranked by the most significant ChIP-seq dataset. Dashed line: BH adjusted p value = 0.05. B) Histogram showing the distribution of gastrointestinal (GI) scores across mCRPC samples. Dashed line splits the fourth quartile vs others.
Extended Data Figure 8.
Extended Data Figure 8.. DNA methylation at alternative promoters is anticorrelated with their activity.
A) Correlation between the promoter activity fold change and methylation differences at differentially active APs between mCRPC t-SCNC and adenocarcinoma mCRPC. B) Unibind results showing significance of overlap between TF ChIP-seq peaks and upregulated APs in mCRPC t-SCNC vs adenocarcinoma that overlapped with differentially hypomethylated regions in t-SCNC. Each dot represents one ChIP-seq dataset. TFs were ranked by the most significant ChIP-seq dataset. Dashed line: BH adjusted p value = 0.05.
Figure 1.
Figure 1.. Activation and upregulation of alternative promoters are associated with increased expression of disease related genes during prostate cancer progression.
A. Upregulated and downregulated genes were identified by differential gene expression analysis. Oncogenes and upregulated genes are enriched for switching from having a single promoter active in benign prostate to multiple promoters active in localized PCa (left) or mCRPC (right). The total number of genes in each category (T) and the number of genes that switched from SP to MP (N) are labeled next to the bars. SP: single-promoter active, MP: multiple-promoter active. (Fisher’s exact tests, two-sided). B. Differentially used alternative promoters were identified based on statistically significant differences in both absolute and relative activities by running the DEXseq differential exon usage analysis using promoter counts, and proActiv in corresponding comparisons (see Methods for details). AP: alternative promoter. C. Principal component analysis of all samples of different disease stages from three cohorts. PAIR: from the Henri Mondor institution, CPCG: Canadian Prostate Cancer Genome Network, WCDT: West Coast Dream Team, t-SCNC: treatment-emergent small cell neuroendocrine carcinoma. D. Density plot of the correlation between absolute promoter activity and corresponding gene expression levels for upregulated APs (red), downregulated APs (blue) and non-differential promoters (gray) in genes with differential APs in mCRPC vs benign. E. Density plot of the percentage of increased activity of upregulated APs over total increased activity of all promoters of the AP-containing genes in localized PCa and mCRPC. The other promoters from the AP-containing genes were plotted as controls. (Student’s t-tests, two-sided).). F. Tracks plot showing the mean normalized RNA-seq coverage of benign and mCRPC samples over the RALBP1 gene on chromosome 18. Two annotated promoters (P1 and P2) are highlighted by shadows. CPM: counts per million reads. G. Box plot showing the relative activity of RALBP1 P1 and P2 in individual samples grouped by benign and mCRPC (Student’s t-test) (n = 8 for benign, n = 101 for mCRPC adeno). Box plots show data from the 25th to the 75th percentile, with the median as a line inside the box. Whiskers extend to 1.5 times the interquartile range (IQR) from the lower and upper quartiles.
Figure 2.
Figure 2.. FOXA1 binding and androgen signaling are associated with alternative promoter usage in PCa.
A. Correlation between the number of upregulated APs in individual localized PCa samples and AR expression levels. 95% confidence interval for the predictions from a linear model is displayed. (Spearman’s correlation test, two-sided) B. Left: The percentage of upregulated APs in localized PCa and canonical promoters of Hallmark AR targets that overlap with localized PCa_specific AR ChIP-seq peaks; Right: The percentage of upregulated APs in mCRPC and canonical promoters of Hallmark AR targets that overlap with mCRPC PDX-specific AR ChIP-seq peaks. (Fisher’s exact test, two-sided). C. Left: The percentage of upregulated APs in localized PCa and canonical promoters of Hallmark AR targets that overlap with localized PCa_specific FOXA1 ChIP-seq peaks; Right: The percentage of upregulated APs in mCRPC and canonical promoters of Hallmark AR targets that overlap with mCRPC PDX-specific FOXA1 ChIP-seq peaks. (Fisher’s exact test, two-sided). D. The percentage of overlapping with FOXA1 ChIP-seq peaks in control and FOXA1 knockdown (shFOXA1) LNCaP cells in upregulated APs in localized PCa (middle) and mCRPC (right) with evidence of FOXA1 binding by FOXA1 ChIP-seq used in Figure 2C. (Fisher’s exact test one-sided). E. The percentage of FOXA1-bound upregulated APs in localized and mCRPC showing downregulated activity upon FOXA1 knockdown (shFOXA1) in LNCaP cells. (Fisher’s exact test, two-sided).
Figure 3.
Figure 3.. MYC is a potential driver of alternative promoter activation in mCRPC.
A. UniBind results for top three TFs in localized PCa and mCRPC. Each dot represents one ChIP-seq dataset (n = 194, 70, 4, 4, 11, and 5 for AR, FOXA1, GATA2, MYC, E2F1, and HIF1A). TFs were ranked by the ChIP-seq dataset with the most significant overlap with upregulated APs. P values were calculated using Fisher’s exact test. Y axis shows the p values without multi-test adjustments, but the horizontal dashed line shows the corresponding Benjamini Hochberg (BH)-adjusted p value 0.05. B. UniBind results showing significance of overlap between TF ChIP-seq peaks and upregulated APs in MYC expression high vs. low mCRPC samples. Each dot represents one ChIP-seq dataset. TFs were ranked by the most significant ChIP-seq dataset. P values were calculated using Fisher’s exact tests. Y axis shows the p values without multi-test adjustments, but the horizontal dashed line shows the corresponding BH-adjusted p value 0.05. C. The percentage of upregulated APs and EZH2 bound upregulated APs in mCRPC that overlapped with MYC ChIP-seq peaks in LNCaP cells. (Fisher’s exact test, two-sided). D. The percentage of upregulated APs and MYC bound upregulated APs in mCRPC that overlapped with EZH2 ChIP-seq peaks in LNCaP cells. (Fisher’s exact test, two-sided). E. The percentage of upregulated APs in mCRPC and canonical promoters of upregulated genes in mCRPC that overlapped with both MYC and EZH2 ChIP-seq peaks in LNCaP cells. (Fisher’s exact test, two-sided). F. Tracks plot showing the mean normalized RNA-seq coverage of benign and mCRPC samples over the BMI1 gene on chromosome 10. Two annotated promoters (P1 and P2) are highlighted by shadows. EZH2 and MYC ChIP-seq peaks in LNCaP cells are displayed. CPM: counts per million reads. G. Box plot showing the absolute activity of BMI1 P1 and P2 in individual samples grouped by benign and mCRPC (Student’s t-test) (n = 8 for benign, n = 101 for mCRPC). Box plots show data from the 25th to the 75th percentile, with the median as a line inside the box. Whiskers extend to 1.5 times the interquartile range (IQR) from the lower and upper quartiles.
Figure 4.
Figure 4.. Alternative promoter usage reflects lineage plasticity in response to therapy.
A. UniBind results showing significance of overlap between TF ChIP-seq peaks and upregulated APs in treatment emergent small cell neuroendocrine carcinoma (t-SCNC) vs adenocarcinoma mCRPC samples. Each dot represents one ChIP-seq dataset. TFs were ranked by the most significant ChIP-seq dataset. P values were calculated using Fisher’s exact tests. Y axis shows the p values without multi-test adjustments, but the horizontal dashed line shows the corresponding BH-adjusted p value 0.05. B. Box plot showing HAND2 expression in mCRPC adenocarcinoma (adeno) and t-SCNC tumors (Student’s t-test) (n = 101 for adeno, n = 3 for tSCNC). Box plots show data from the 25th to the 75th percentile, with the median as a line inside the box. Whiskers extend to 1.5 times the interquartile range (IQR) from the lower and upper quartiles. C. Pathway enrichment analysis of genes with upregulated APs in t-SCNC vs adenocarcinoma that overlapped with HAND2 ChIP-seq peaks. X axis shows the p values without multi-test adjustments, but the coloring was based on BH-adjusted p values. Dashed line shows unadjusted p value 0.05. D. UniBind results showing significance of overlap between TF ChIP-seq peaks and upregulated APs in tumors with high gastrointestinal (GI) scores. Each dot represents one ChIP-seq dataset. TFs were ranked by the most significant ChIP-seq dataset. P values were calculated using Fisher’s exact tests. Y axis shows the p values without multi-test adjustments, but the horizontal dashed line shows the corresponding BH-adjusted p value 0.05. E. Tracks plot showing the mean normalized RNA-seq coverage of mCRPC samples with high and low GI score over the 5’ part of the SRC gene. Two annotated promoters (P1 and P2) are highlighted by shadows. CPM: counts per million reads. F. Box plot showing the relative promoter activity of SRC P1 and P2 in individual samples grouped by GI score high and low (Student’s t-test, two-sided) (n = 79 for GI low, n = 25 for GI high). Box plots show data from the 25th to the 75th percentile, with the median as a line inside the box. Whiskers extend to 1.5 times the interquartile range (IQR) from the lower and upper quartiles. G. Box plot showing the gene expression of SRC in individual samples grouped by GI score levels (Student’s t-test, two-sided) (n = 79 for GI low, n = 25 for GI high). Box plots show data from the 25th to the 75th percentile, with the median as a line inside the box. Whiskers extend to 1.5 times the interquartile range (IQR) from the lower and upper quartiles.
Figure 5.
Figure 5.. Activation of alternative promoters is associated with DNA hypomethylation.
A. Correlation between the gene expression fold change and methylation differences at alternative promoters differentially active between mCRPC t-SCNC and adenocarcinoma. 95% confidence interval for the predictions from a linear model is displayed. (Spearman’s correlation test, two-sided) B. Correlation between the gene expression fold change and methylation differences at canonical promoters of the genes harboring differential APs between mCRPC t-SCNC and adenocarcinoma. 95% confidence interval for the predictions from a linear model is displayed. (Spearman’s correlation test, two-sided) C. Tracks plot showing the mean normalized RNA-seq coverage of mCRPC t-SCNC and adenocarcinoma samples over the 5’ region of the CBX5 gene. Two annotated promoters (P1 and P2) are highlighted by shadows. CPM: counts per million reads. DMR: differentially methylated region. HMR: hypomethylated region. PC_TX: protein-coding transcript; NC_TX: non-coding transcript. D. Box plot showing the activity of CBX5 P1 and P2 in individual samples grouped by t-SCNC and adenocarcinoma (Student’s t-test, two-sided) (n = 101 for adeno, n = 3 for tSCNC). Box plots show data from the 25th to the 75th percentile, with the median as a line inside the box. Whiskers extend to 1.5 times the interquartile range (IQR) from the lower and upper quartiles. E. Box plot showing the gene expression of CBX5 in individual samples grouped by t-SCNC and adenocarcinoma phenotype (Student’s t-test, two-sided) (n = 101 for adeno, n = 3 for tSCNC). Box plots show data from the 25th to the 75th percentile, with the median as a line inside the box. Whiskers extend to 1.5 times the interquartile range (IQR) from the lower and upper quartiles. F. Box plot showing the activity of CBX5 P2 in individual samples grouped by harboring an hypomethylated region (HMR) at P2 or not (Student’s t-test, two-sided) (n = 99 for No HMR, n = 5 for HMR). Box plots show data from the 25th to the 75th percentile, with the median as a line inside the box. Whiskers extend to 1.5 times the interquartile range (IQR) from the lower and upper quartiles. G. Standard deviation of methylation levels at recurrent hypomethylated regions (rHMR) overlapping with canonical promoters (as defined in the GENCODE gene model), major promoters in mCRPC (the most active promoters of each gene), and alternative promoters with differential activity within the mCRPC cohort. (Student’s t-test, two-sided) (n = 16,058 for Canonical promoters, n = 12,468 for Major promoters in mCRPC, n = 490 for Promoters with alternative usage within mCRPC). Box plots show data from the 25th to the 75th percentile, with the median as a line inside the box. Whiskers extend to 1.5 times the interquartile range (IQR) from the lower and upper quartiles. H. Correlation between promoter methylation and gene expression at canonical promoters, major promoters, and alternative promoters with differential activity within the mCRPC cohort. (Student’s t-test, two-sided).

Comment in

Similar articles

Cited by

References

    1. Carninci P et al. Genome-wide analysis of mammalian promoter architecture and evolution. Nat Genet 38, 626–635 (2006). 10.1038/ng1789 - DOI - PubMed
    1. Landry JR, Mager DL & Wilhelm BT Complex controls: the role of alternative promoters in mammalian genomes. Trends Genet 19, 640–648 (2003). 10.1016/j.tig.2003.09.014 - DOI - PubMed
    1. Demircioğlu D et al. A Pan-cancer Transcriptome Analysis Reveals Pervasive Regulation through Alternative Promoters. Cell 178, 1465–1477.e1417 (2019). 10.1016/j.cell.2019.08.018 - DOI - PubMed
    1. Davuluri RV, Suzuki Y, Sugano S, Plass C & Huang TH The functional consequences of alternative promoter use in mammalian genomes. Trends Genet 24, 167–177 (2008). 10.1016/j.tig.2008.01.008 - DOI - PubMed
    1. Greenberg MVC & Bourc’his D The diverse roles of DNA methylation in mammalian development and disease. Nat Rev Mol Cell Biol 20, 590–607 (2019). 10.1038/s41580-019-0159-6 - DOI - PubMed

MeSH terms