. 2024 Jun 13;14(1):13633.
doi: 10.1038/s41598-024-64340-w.

Notum regulates the cusp and root patterns in mouse molar

Affiliations

Notum regulates the cusp and root patterns in mouse molar

Dinuka Adasooriya et al. Sci Rep. .

Abstract

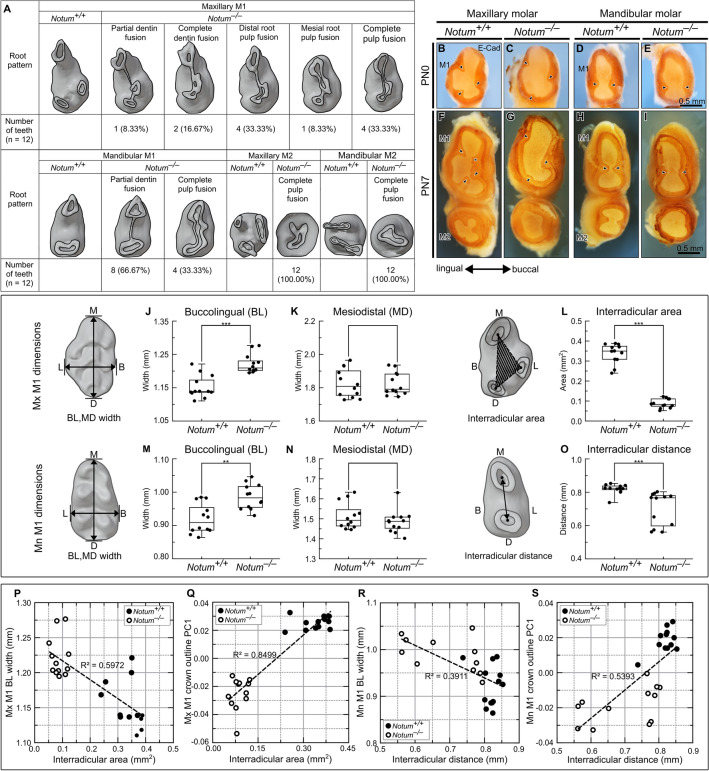
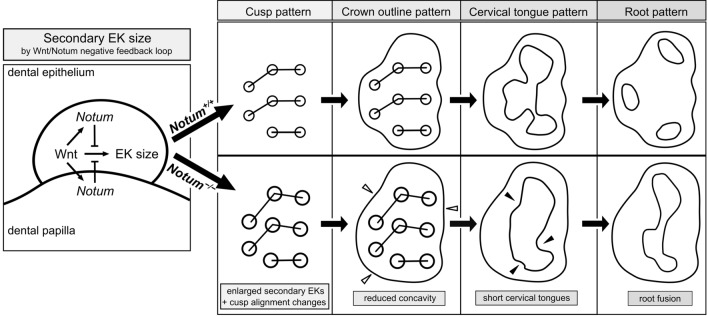
Notum is a direct target of Wnt/β-catenin signaling and plays a crucial role as a Wnt inhibitor within a negative feedback loop. In the tooth, Notum is known to be expressed in odontoblasts, and severe dentin defects and irregular tooth roots have been reported in Notum-deficient mice. However, the precise expression pattern of Notum in early tooth development, and the role of Notum in crown and root patterns remain elusive. In the present study, we identified a novel Notum expression in primary enamel knot (EK), secondary EKs, and dental papilla during tooth development. Notum-deficient mice exhibited enlarged secondary EKs, resulting in broader cusp tips, altered cusp patterns, and reduced concavity in crown outline. These alterations in crown outline led to a reduction in cervical tongue length, thereby inducing root fusion in Notum-deficient mice. Overall, these results suggest that the secondary EK size, regulated by the Wnt/Notum negative feedback loop, has a significant impact on the patterns of crown and root during tooth morphogenesis.

Keywords: Molar; Morphogenesis; Notum protein; Tooth crown; Tooth root; Wnt signaling.


Conflict of interest statement

The authors declare no competing interests.

Figures

Figure 1
Figure 1
Gene expression pattern of Notum in developing molars at embryonic day (E)14 and E16 mouse embryos. (A, B) Single-cell RNA sequencing analysis of E14.5 and E16.5 molars depicts Notum expression with other known enamel knot (EK) marker genes (Fgf4, Shh, Lef1 and Bmp4). Epithelial cells expressing Notum colocalize with cells expressing Shh, Fgf4, Bmp4, and Lef1 at both stages (black arrows in A and B), while mesenchymal cells expressing Notum (white arrows) also express Lef1 and Bmp4. (C−L) In the frontal sections of mandibular molars at E14.5 and E16.5, Notum is expressed in the primary EK (pEK) at E14.5, secondary EK (sEK) at E16.5, and in the thin outer layer of the dental papilla. Fgf4 expression is observed at the primary EK at E14.5 and secondary EKs at E16.5. Shh is expressed in the primary enamel knot at E14.5, and in the inner dental epithelium at E16.5. Lef1 and Bmp4 are expressed in the primary EK at E14.5, secondary EKs at E16.5, and dental papilla. Scale bar, 100 µm.
Figure 2
Figure 2
Morphological changes in crown and root of maxillary and mandibular molars in Notum−/− mice at postnatal day (PN) 14 and PN35. (A−D2) At PN14, first molar (M1), second molar (M2), and third molar (M3) appear slightly larger in Notum−/− mice compared to Notum+/+ mice. Broader cusp tips are observed in Notum−/− molars in both occlusal view and lateral views, particularly in the paracone of maxillary M1 (arrowheads in A2 and B2) and metaconid in mandibular M1 (arrowheads in C1 and D1). (E−H4) At PN35, differences in crown outline and size persist, with Notum−/− molars showing severe attrition. 3D-reconstructed molars reveal root fusion in maxillary and mandibular M1 of Notum−/− mice in lingual and apical views. (I) Heat maps displaying the alterations in the expression level of selected genes in RNA-sequencing analysis of the E14.5 and E16.5 molars of Notum+/+ and Notum−/− mice. Notum is significantly downregulated in Notum−/− mice, while Dkk4 and Fgf20 are significantly upregulated at E16.5. Fgf4 and Lef1 show slight upregulation at both E14.5 and E16.5. Cell adhesion-related genes Rac1 and Cdh1 exhibit slight upregulation and downregulation, respectively, at E16.5. (J−Y) Expression of Fgf4 in developing maxillary M1 and mandibular M1. Fgf4 is expressed in the primary EK of maxillary and mandibular M1 at E14.5 and in secondary EKs from E16.5. At E16.5, E17.5, and E18.5, M1s show the enlarged secondary EKs expressing Fgf4 in Notum−/− mice compared to Notum+/+ mice in maxilla and mandible. B-Anid: buccal anteroconid, L-Anid: lingual anteroconid, Prd: protoconid, Med: metaconid, Hyd: hypoconid, End:entoconid, Hld: hypoconulid. B-An: buccal anterocone, L-An: lingual anterocone, Ans: anterostyle, Pa: paracone, Pr: protocone, Ens: enterostyle, Me: metacone, Hy: hypocone, lin: lingual, buc: buccal. Scale bars in AH4, 1 mm and JY, 0.2 mm. * P < 0.05, NS: non-significant.
Figure 3
Figure 3
Geometric morphometric changes in cusp pattern and crown outline in Notum−/− mice at PN14. (A, G) Cusp landmarks and crown outlines of the maxillary and mandibular first molars (M1). In principal component (PC) analysis, Notum−/− M1 (white circles) and Notum+/+ M1 (black circles) are plotted along the first two PCs (PC1 and PC2) scores (n = 10 per group). Blue and red wireframes or outlines correspond to positive and negative ends of PC1 axis, respectively. Gray wireframes or outlines indicate the procrustes' mean of all samples along the PC1 axis. In discriminant function (DF) analysis, blue and red wireframes or outlines correspond to Notum+/+ M1 and Notum−/− M1, respectively (B−C) In cross-validated DF analysis, Notum−/− M1s are correctly classified into Notum−/− M1 group with a predictive accuracy of 80%, and Notum+/+ M1s are accurately classified into Notum+/+ M1 group with a predictive accuracy of 70%. (D−E) In PC analysis of crown outline in maxillary M1, Notum−/− M1s are clustered separately from the Notum+/+ M1 on PC1 axis. In cross-validated DF analysis, predictive accuracy is 100% for both Notum−/− M1 and Notum+/+ M1. Notum−/− M1s show a significant decrease in concavity at both lingual and buccal outlines (arrowheads in E). (F) Strong direct relationship between cusp pattern PC1 scores and crown outline PC1 scores in maxillary M1 (R2 = 0.66, p = 0.000014). (H−I) In PC analysis of cusp pattern in mandibular M1, Notum−/− M1s are not clustered separately from Notum+/+ M1 along PC1 and PC2 axes. In cross-validated DF analysis, predictive accuracy is 100% for both Notum−/− M1 and Notum+/+ M1. (J−K) In PC analysis of crown outline of mandibular M1, Notum−/− M1s are clustered separately from Notum+/+ M1s on PC1 axis. In cross-validated DF analysis, Notum−/− M1s, which also shows a change in distolingual outline (arrowhead in K), are correctly classified into Notum−/− M1 group and Notum+/+ M1s into Notum+/+ M1 group with a predictive accuracy of 100% and 90%, respectively. (L) No relationship between cusp pattern PC1 scores and crown outline PC1 scores in mandibular M1 (R2 = 0.0746, P = 0.2481).
Figure 4
Figure 4
Relationship of crown outline with root pattern in first molar (M1). (A) Notum−/− mice exhibit root fusion across all molars, ranging from partial dentin fusion to complete pulp fusion. (B−I) From the apical view of maxillary and mandibular M1 at PN0 and PN7, E-cadherin localization in the epithelium depicts cervical tongue configuration. Notum−/− M1s display shorter cervical tongues and wider gaps between cervical tongues compared to Notum+/+ M1. (J−O) Dimensional changes in crown and root of Notum−/− M1. Notum−/− mice show a significant increase in buccolingual width but no change in mesiodistal width in both maxilla and mandible. Maxillary M1 interradicular area is significantly smaller in Notum−/− mice than Notum+/+ mice, and mandibular M1 interradicular distance is shorter in Notum−/− mice than Notum+/+ mice. (P−S) Relationship between crown outline and root pattern. Linear regression analyses reveal strong relationships between interradicular area dimension and buccolingual width in maxillary M1 (R2 = 0.5972, P  < 0.001 in T) but weak in mandibular M1 (R2 = 0.3911, P < 0.001 in V). Strong direct relationship exists between interradicular area dimension and crown outline PC1 scores in both maxillary M1 (R2 = 0.8499, P  < 0.001 in U) and mandibular M1 (R2 = 0.5393, P < 0.001in W). *P  < 0.05, **P < 0.01 and ***P < 0.001. Scale bars, 0.5 mm.
Figure 5
Figure 5
Schematic diagram illustrating Notum activity in the secondary enamel knot and its role in the crown and root patterning. Notum in secondary enamel knot (EK) and dental papilla regulates the size of secondary EK by inhibiting Wnt signaling. Loss of Notum leads to enlarged secondary EKs, resulting in broader cusp tips. Cusp displacement alters crown outline patterns, causing shorter cervical tongues. Subsequently, incomplete fusion between cervical tongues occurs, resulting in the incomplete separation of molar roots in Notum-deficient mice.

Similar articles

Cited by

References

    1. Kakugawa S, et al. Notum deacylates Wnt proteins to suppress signalling activity. Nature. 2015;519:187–192. doi: 10.1038/nature14259. - DOI - PMC - PubMed
    1. Zhang X, et al. Notum is required for neural and head induction via Wnt deacylation, oxidation, and inactivation. Dev. Cell. 2015;32:719–730. doi: 10.1016/j.devcel.2015.02.014. - DOI - PMC - PubMed
    1. Gerhardt B, et al. Notum attenuates Wnt/β-catenin signaling to promote tracheal cartilage patterning. Dev. Biol. 2018;436:14–27. doi: 10.1016/j.ydbio.2018.02.002. - DOI - PMC - PubMed
    1. Choi RB, et al. Notum Deletion From Late-Stage Skeletal Cells Increases Cortical Bone Formation and Potentiates Skeletal Effects of Sclerostin Inhibition. J. Bone Miner. Res. 2021;36:2413–2425. doi: 10.1002/jbmr.4411. - DOI - PMC - PubMed
    1. Vogel P, et al. Dentin dysplasia in notum knockout mice. Vet. Pathol. 2016;53:853–862. doi: 10.1177/0300985815626778. - DOI - PubMed

Substances