. 2024 Dec;29(12):3707-3721.
doi: 10.1038/s41380-024-02611-8. Epub 2024 Jun 14.

Transmissible long-term neuroprotective and pro-cognitive effects of 1-42 beta-amyloid with A2T icelandic mutation in an Alzheimer's disease mouse model

Affiliations

Transmissible long-term neuroprotective and pro-cognitive effects of 1-42 beta-amyloid with A2T icelandic mutation in an Alzheimer's disease mouse model

Marina Célestine et al. Mol Psychiatry. 2024 Dec.

Abstract

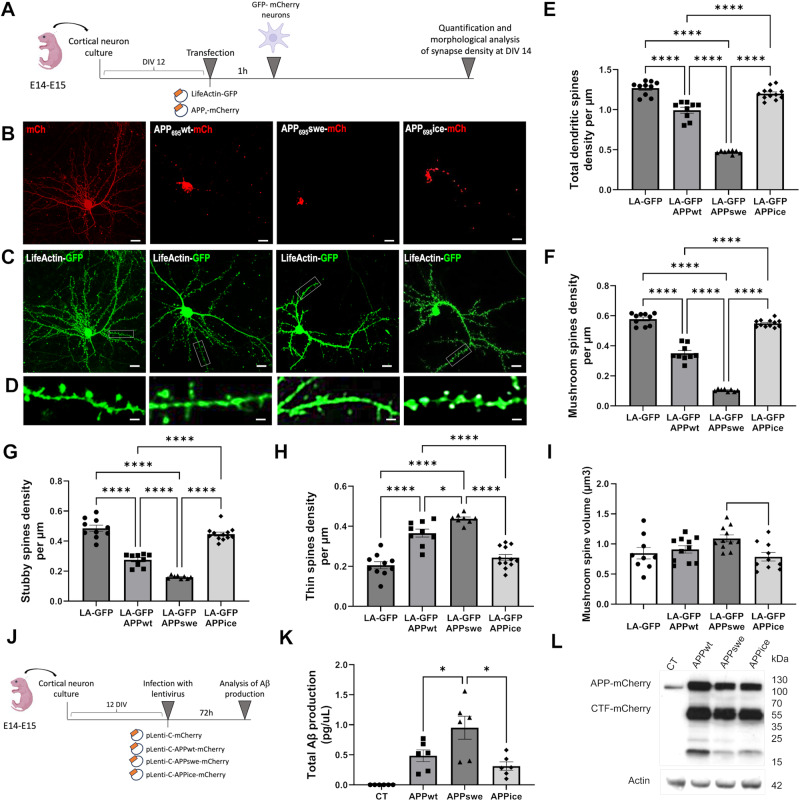
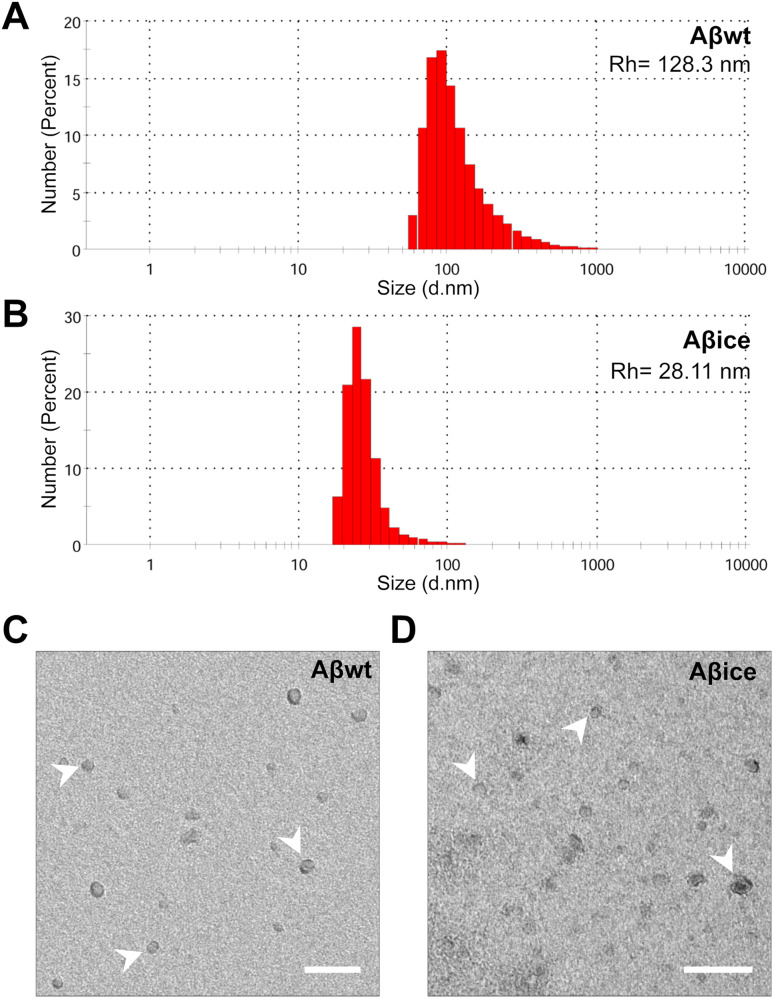
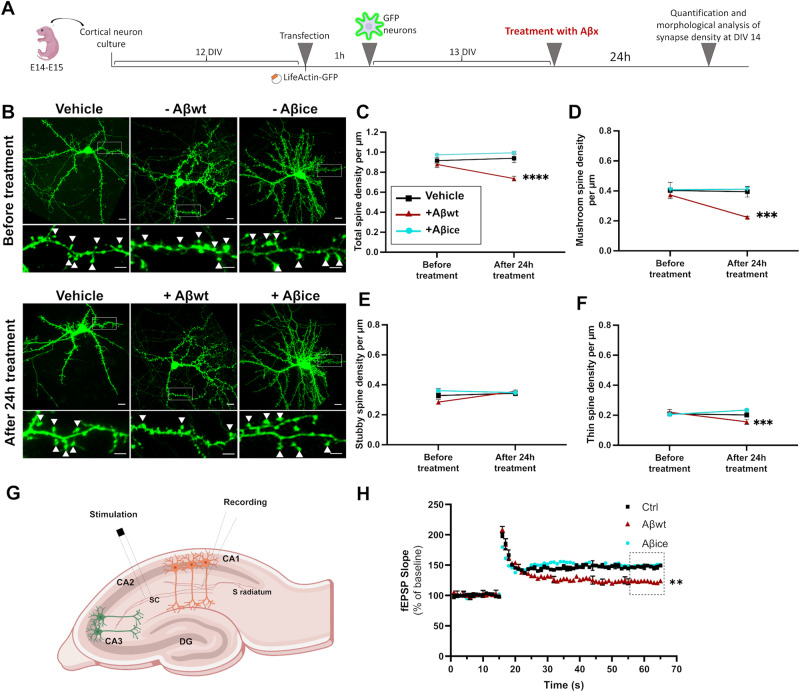
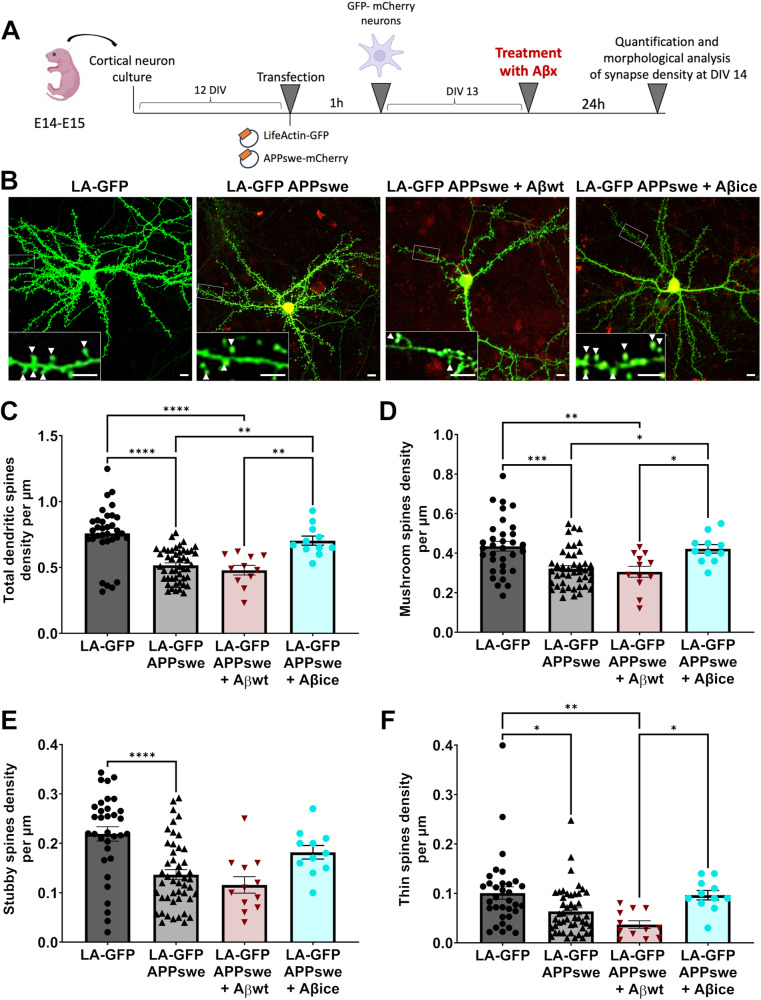
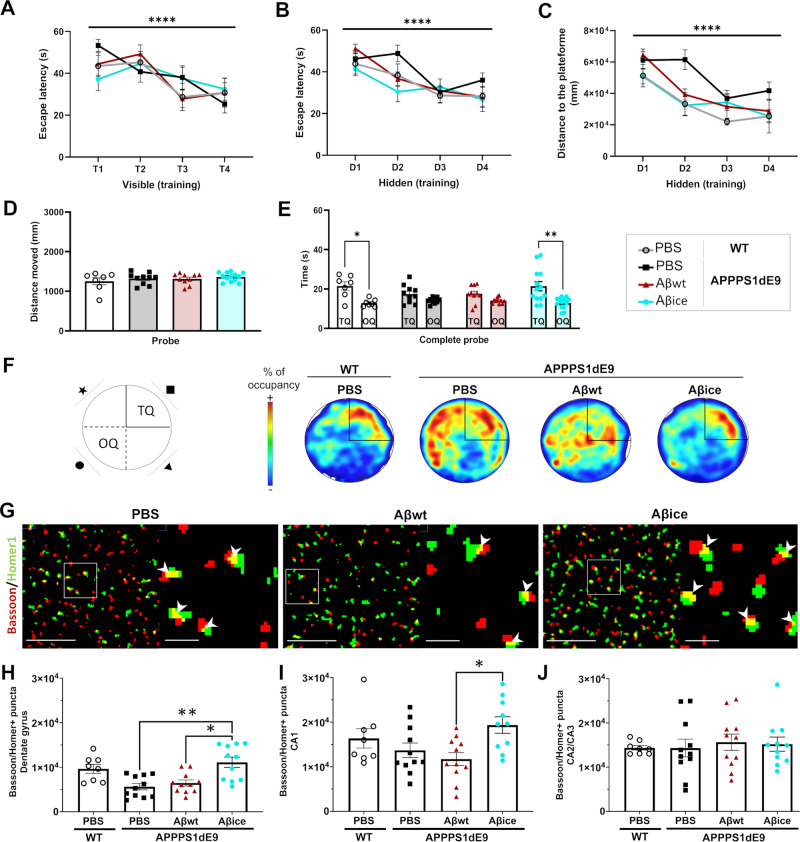
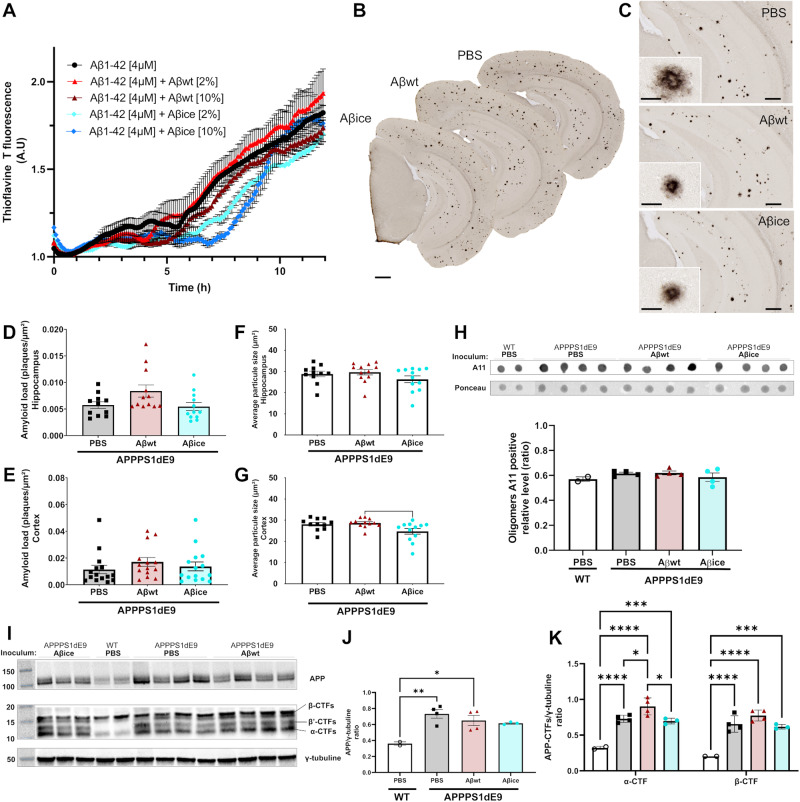
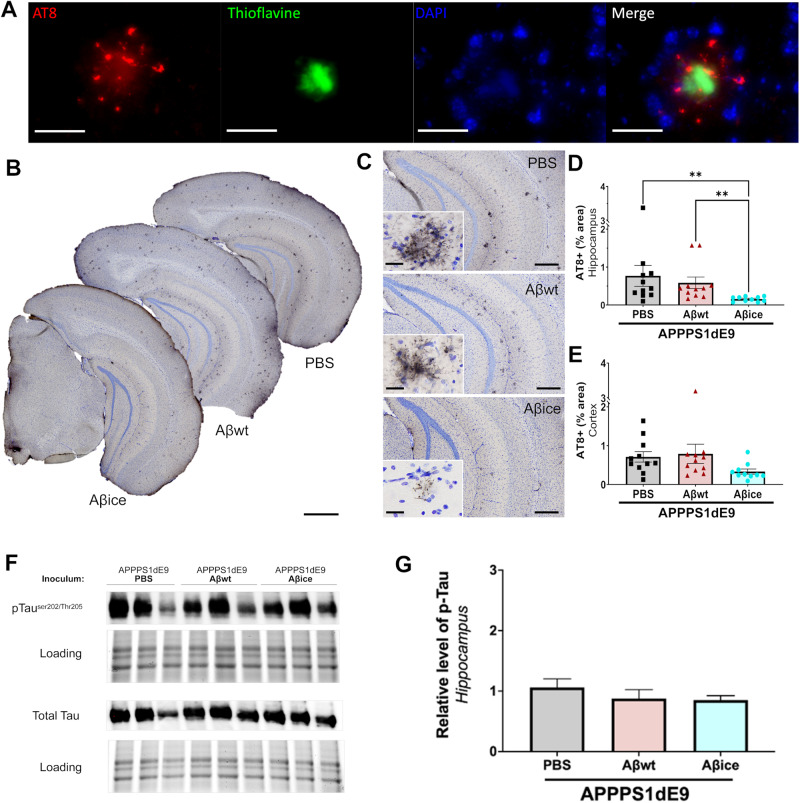
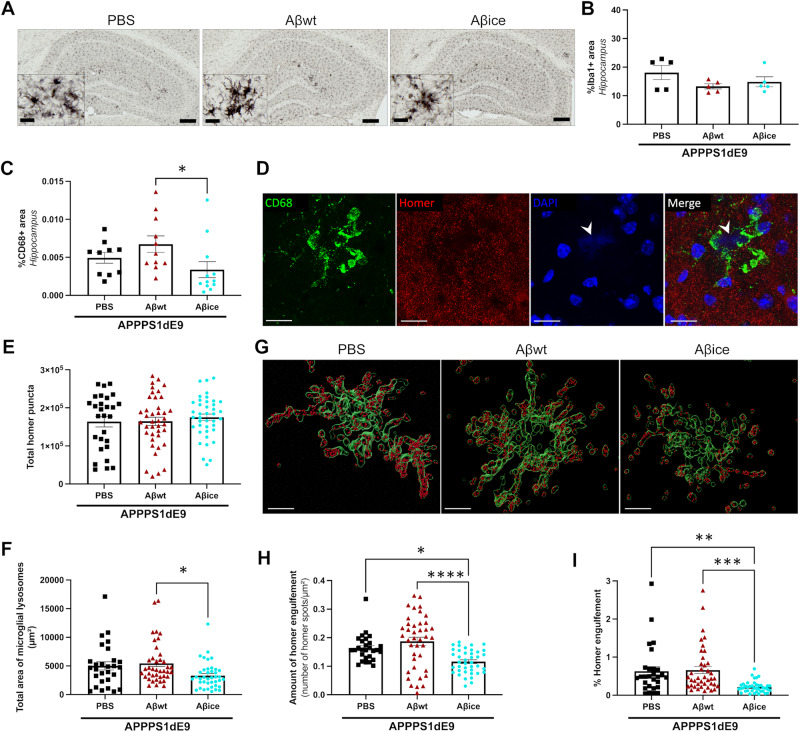
The amyloid cascade hypothesis assumes that the development of Alzheimer's disease (AD) is driven by a self-perpetuating cycle, in which β-amyloid (Aβ) accumulation leads to Tau pathology and neuronal damages. A particular mutation (A673T) of the amyloid precursor protein (APP) was identified among Icelandic population. It provides a protective effect against Alzheimer- and age-related cognitive decline. This APP mutation leads to the reduced production of Aβ with A2T (position in peptide sequence) change (Aβice). In addition, Aβice has the capacity to form protective heterodimers in association with wild-type Aβ. Despite the emerging interest in Aβice during the last decade, the impact of Aβice on events associated with the amyloid cascade has never been reported. First, the effects of Aβice were evaluated in vitro by electrophysiology on hippocampal slices and by studying synapse morphology in cortical neurons. We showed that Aβice protects against endogenous Aβ-mediated synaptotoxicity. Second, as several studies have outlined that a single intracerebral administration of Aβ can worsen Aβ deposition and cognitive functions several months after the inoculation, we evaluated in vivo the long-term effects of a single inoculation of Aβice or Aβ-wild-type (Aβwt) in the hippocampus of transgenic mice (APPswe/PS1dE9) over-expressing Aβ1-42 peptide. Interestingly, we found that the single intra-hippocampal inoculation of Aβice to mice rescued synaptic density and spatial memory losses four months post-inoculation, compared with Aβwt inoculation. Although Aβ load was not modulated by Aβice infusion, the amount of Tau-positive neuritic plaques was significantly reduced. Finally, a lower phagocytosis by microglia of post-synaptic compounds was detected in Aβice-inoculated animals, which can partly explain the increased density of synapses in the Aβice animals. Thus, a single event as Aβice inoculation can improve the fate of AD-associated pathology and phenotype in mice several months after the event. These results open unexpected fields to develop innovative therapeutic strategies against AD.


Conflict of interest statement

Competing interests: The authors declare no competing interests.

Figures

Fig. 1
Fig. 1. Over-expression of APPice in cortical cell cultures protects spine density but does not influence Aβ production.
A Schematic illustration of primary cortical neuron transfection and analysis. Neuronal cells were isolated from the neocortices of 14- to 15-day embryos. Transfection with APPx-mCherry and LifeActin-GFP were performed after 12 DIV. Plasmid were applied to cells for 60 min. Finally, neurons were visualized and their morphology and density were analyzed according to a classification rule [22]. Representative images of cultured cortical neurons over-expressing mCh (control neurons), APPwt-mCh, APPswe-mCh, APPice-mCh (B) and LifeActin-GFP (LA-GFP) (scale bar = 10 µm) (C). D Representative dendrite portions (scale bar = 5 µm). E Reduction of total spine density in APPwt (****p < 0.0001 compared with control neurons and APPice) and APPswe (****p < 0.0001 compared with control neurons, APPwt and APPice) while APPice does not modulate total spine density (p = 0.5 compared with control neurons). F Reduction of mushroom spine density in APPwt (****p < 0.0001 compared with control neurons and APPice) and in APPswe (****p < 0.0001 compared with control neurons, APPwt and APPice) while APPice does not modulate mushroom spine density (p = 0.6 compared with control neurons). G Reduction of stubby spine density in APPwt (****p < 0.0001 compared with control neurons and APPice) and in APPswe (****p < 0.0001 compared with control neurons, APPwt and APPice). H Increase of thin spine density in APPwt (****p < 0.0001 compared with control neurons and APPice) and in APPswe (****p < 0.0001 compared with control neurons and APPice; *p = 0.012 compared with APPwt). I Increase of mushroom spine volume in APPwt (*p < 0.05 compared with control neurons and APPice) and in APPswe (**p < 0.01 compared with control neurons and APPice; *p = 0.012 compared with APPwt), while APPice does not modulate mushroom spine volume (p = 0.6 compared with control neurons). nLA-GFP = 10, nAPPwt = 9, nAPPswe = 8, nAPPice = 12 neurons from at least 3 different cultures. J Schematic illustration of neural infections by viral vectors K Quantification of total Aβ productions from neurons infected with APPwt, APPswe or APPice. Cortical neurons infected with APPswe produce an increased level of Aβ compared with APPwt (*p = 0.045) and APPice (*p = 0.010) while production of Aβ is similar between APPwt and APPice (p = 0.36 in ANOVA group comparison; p = 0.309 in Mann–Whitney test). L Western blot of infected neuron lysate showing no difference in overall APP levels using Y188 antibody. N = 6 different cortical neuron cultures. *p < 0.05, ****p < 0.0001. Data are shown as mean ± s.e.m.
Fig. 2
Fig. 2. Characterization of Aβwt and Aβice samples.
A, B Particle size analysis by dynamic light scattering to assess hydrodynamic radius (Rh). Size distribution by number of particles (%) at 30 µM had peak averages Rh of 128.3 nm for Aβwt (A) and 28.11 nm for Aβice (B). Representative electron microscopy images of Aβ assemblies (arrows) in Aβwt (C) and Aβice (D) solution showing lack of fibrillary assemblies. Scale bars: 100 nm.
Fig. 3
Fig. 3. Exogenous application of Aβice is not synaptotoxic.
A Schematic illustration of primary cortical neuron transfection and analysis. Neuronal cells were isolated from the neocortices of 14- to 15-day embryos. Transfections with LifeActin-GFP plasmid were performed after 12 DIV. Plasmid were applied to cells for 60 mins. Neurons were seeded and maintained at 37 °C. Treatments with 100 nM of Aβice or Aβwt were performed on neuronal cultures at 13 DIV during 24 h. Finally, neurons were visualized at DIV 14 and their morphology and density were analyzed according to a classification rule [22]. B Representative images of primary cultures of cortical neurons expressing LA-GFP before (top), and after (bottom) treatment for 24 h with Aβice or Aβwt. Top row wide field view, scale bar = 10 µm; bottom row: dendrite portions with mushroom spines (white arrows, scale bar = 5 µm). C Quantification of total spine density showed a reduction of total number of spines after treatment with Aβwt, compared to PBS (****p < 0.0001) and Aβice (****p < 0.0001) while no difference was observed after treatment with Aβice compared to PBS (p = 0.46). D Quantification of mushroom spine density showed a reduction of the number of mushroom spines after treatment with Aβwt compared to PBS and Aβice (***p = 0.0004 and p = 0.0001, respectively) while no difference was observed after treatment with Aβice compared to PBS (p = 0.91). E Stubby spine density was not modified after treatment with the different Aβ seeds. F Quantification of thin spine density showed a reduction of the number of thin spines after treatment with Aβwt compared to Aβice (***p = 0.0005). n = 6 neurons from at least 3 different cultures. Data are shown as mean ± s.e.m. Kruskal-Wallis with Dunn’s multiple comparisons. G Long-term potentiation (LTP) in the hippocampal CA1 region was induced by delivering stimulations to the Schaffer collateral/commissural (sc) pathway. Aβwt or Aβice peptides were added to the artificial CSF bath 15 min prior to recording. H Stimulations were delivered after 15 min of stable baseline. Each point on the graph represents the mean ± s.e.m. While Aβice did not modulate LTP (p > 0.9), Aβwt decreased LTP (p = 0.0017) when comparing the last 10 time points of fEPSP slope (% of baseline) to control conditions (Ctrl; without Aβ treatment). n = at least 5 slices per condition. **p < 0.01, *** p < 0.001, **** p < 0.0001.
Fig. 4
Fig. 4. Exogenous application of Aβice protects against Aβ-mediated synaptic alterations.
A Schematic illustration of primary cortical neuron transfection and analysis. Neuronal cells were isolated from the neocortices of 14- to 15-day embryos. Transfection with APPx-mCherry and LifeActin-GFP plasmid were performed after 12 DIV. Plasmid were applied to cells for 60 mins. Neurons were seeded and maintained at 37 °C. Treatments with 100 nM of Aβice or Aβwt were performed on neuronal cultures at 13 DIV during 24 h. Finally, neurons were visualized at DIV 14 and their morphology and density were analyzed according to a classification rule [22]. B Representative images of cultured cortical neurons expressing LA-GFP (left), expressing LA-GFP and APPswe after a 24 h incubation with buffer (middle) or Aβice (right). Scale bar = 10 µm. Inset: Dendrite portions presenting with less mushroom spines (white arrows) in APPswe neurons but not after 24 h incubation with Aβice. Scale bar = 5 µm. C Reduction of total spine density in APPswe and after Aβwt treatment (****p < 0.0001 compared with control LA-GFP alone) while recovery after treatment with Aβice was observed (**p = 0.002 compared with APPswe; **p = 0.003 compared with APPswe + Aβwt). D Reduction of mushroom spine density in APPswe (***p = 0.0002 compared with control LA-GFP alone) and after Aβwt treatment (**p = 0.004 compared with control LA-GFP alone) while a recovery of mushroom spine density was observed after treatment with Aβice (*p = 0.036 compared with APPswe; **p = 0.042 compared with APPswe + Aβwt). Quantification of E stubby spine and F thin spine density showing a reduction of stubby and thin spine number in APPswe (E ****p < 0.0001; F *p = 0.017 compared with control LA-GFP) and after Aβwt treatment (F **p = 0.0045 compared with control LA-GFP; *p = 0.039 compared with APPswe + Aβice). Quantification of both do not change after treatment with Aβice (D p = 0.116 ; E p = 0.211 compared with APPswe). nLA-GFP = 33, nAPPswe = 47, nAPPswe + AβWT = 12; nAPPswe + Aβice = 11 neurons n = 6 neurons from at least 3 different cultures. *p < 0.05, **p < 0.01, ***p < 0.001 ****p < 0.0001. Data are shown as mean ± s.e.m.
Fig. 5
Fig. 5. Aβice intrahippocampal infusion rescues spatial memory and increases synaptic density.
Spatial memory was evaluated using Morris water maze tasks at 4 months post-inoculation. A During the visible platform phase, escape latencies decreased across the four trials (F(2.950, 177.0) = 11.76, p < 0.0001). No difference was observed between the groups (F(4, 63) = 0.07, p > 0.9). WT mice and APPswe/PS1dE9 mice inoculated with PBS, Aβwt or Aβice had comparable learning abilities, as suggested by the decrease in (B) time to find the platform (for the days: F(1.69, 82.98) = 18.65; p < 0.0005) and (C) the distance moved (for the days: F(2.894, 101.3) = 20.74, p < 0.0005) throughout the 4 training day. D The distance moved during the probe test was similar between groups. E During the probe test evaluating spatial memory, the time spent in the target quadrant (TQ) was significantly higher than the time spent in the opposite one (OQ) in WT mice (p = 0.038) and Aβice-inoculated APPswe/PS1dE9 mice (p = 0.003). F Representative heatmap images of probe test. Increased red color intensity represents increased time spent in a given location. Conversely, a cooler color indicates a shorter time spent in the location. The TQ is represented. Unlike WT animals, PBS and Aβwt-inoculated APPswe/PS1dE9 mice were unable to find the target platform. Aβice rescued this phenotype. G Representative views of original Bassoon/Homer segmented and co-localized puncta (white arrow). Scale bars: main images: 5 µm; Insets: 1 µm (HJ). In the dentate gyrus (H), a decrease of co-localized puncta between Bassoon and Homer synaptic markers is observed in APPswe/PS1dE9 animals treated with PBS (13.9%) or Aβwt compared to WT animals. An increase of co-localized puncta between Bassoon and Homer synaptic markers is observed in Aβice-inoculated mice in (H) the dentate gyrus (H: PBS- versus Aβice-inoculated APPswe/PS1dE9: p = 0.005 and Aβwt- versus Aβice-inoculated APPswe/PS1dE9: p = 0.03) and (I) the CA1 (I:Aβwt- versus Aβice-inoculated APPswe/PS1dE9: p = 0.01). Synaptic density in the CA2/3 (J) was similar between groups (p = 0.86). nWTPBS = 7, nAPP/PS1PBS = 10, nAβwt = 11, nAβice = 12 mice.*p < 0.05, **p < 0.01, ***p < 0.001 ****p < 0.0001. Data are shown as mean ± s.e.m.
Fig. 6
Fig. 6. Aβ aggregation, Aβ deposition and APP processing profiles at 4 mpi.
A Kinetics of synthetic Aβ1-42 aggregation monitored by Thioflavin T (ThT) fluorescence in the absence and presence of Aβwt and Aβice seeds (data issued from three independent kinetic experiments). Aggregation experiments were performed in triplicate. The aggregation curves were normalized to maximal values of ThT fluorescence at plateau. An elongation of the lag time was observed by seeding with Aβice [10%] compared to Aβ1-42 alone (p = 0.035, Kruskal-Wallis test). B Representative images of 4G8 immunolabeling showing Aβ plaque deposition in the brain of APPswe/PS1dE9 mice after PBS, Aβwt or Aβice inoculation in the dentate gyrus. C Representative images of Aβ plaque deposition in the hippocampus. Magnified views showed no difference in the morphology of Aβ plaques between groups. D, E Quantification of amyloid load (4G8-positive Aβ plaques per µm²) revealed no difference between groups in the hippocampus (D p = 0.09) and in the cortex (E p = 0.2). nAPP/PS1PBS = 10, nAβwt = 11, nAβice = 12 mice. Average amyloid plaque size in the hippocampus (F) and cortex (G). A reduction in the average amyloid plaque size is observed in the cortex of Aβice-inoculated APPswe/PS1dE9 mice compared to Aβwt-inoculated APPswe/PS1dE9 (p = 0.028). H Dot blot analysis for oligomeric species (A11) in sarkosyl-soluble extract from the hippocampus of APPswe/PS1dE9 mice after PBS, Aβwt or Aβice inoculation at 4mpi. Similar relative expression levels of A11 are observed between groups. I Western-blot analysis (APP-Cter-17 antibody [52]) of total endogenous APP, APP-CTFs and tubulin in hippocampus lysates (S100K fractions) obtained from wild-type and APPswe/PS1dE9 mice after PBS, Aβwt or Aβice inoculation. Full length APP runs at an apparent molecular size of 110 kDa, β-, β′- and α-CTF are detected at 16 kDa, 12 kDa and 11 kDa respectively. Tubulin staining was used as a marker and loading control. J The semi-quantification of total APP reveals similar levels of APP in PBS-, Aβwt- or Aβice-inoculated APPswe/PS1dE9 mice. APP levels were significantly higher in PBS- (**p = 0.007) and Aβwt- (*p = 0.029) inoculated APPswe/PS1dE9 mice than WT mice. K Semi-quantification of β-CTF/C99 and α-CTF/C83. An increase level of both fragments were observed in PBS- (****p < 0.0001), Aβwt- (****p < 0.0001) or Aβice- (***p = 0.0001) inoculated APPswe/PS1dE9 mice compared with PBS-inoculated WT mice. Similar level of CTFs were shown between PBS- and Aβice-inoculated APPswe/PS1dE9 mice (p = 0.99). An increase level of α-CTF was observed in Aβwt-inoculated APPswe/PS1dE9 mice compared with PBS- (*p = 0.035) and Aβice- (*p = 0.018) inoculated APPswe/PS1dE9 mice. nWTPBS = 2, nAPP/PS1PBS = 4, nAPP/PS1Aβwt = 4, nAPP/PS1Aβice = 3 mice. *p < 0.05, **p < 0.01, ***p < 0.001, ****p < 0.0001. Data are shown as mean ± s.e.m. Scale bars: B: 500 µm; C main images = 100 µm, Insets = 20 µm.
Fig. 7
Fig. 7. Aβice reduces Tau pathology.
A Representative images of AT8-Thioflavine S double labeling showing AT8-positive neurites surrounding an amyloid plaque (Thioflavine). B Representative images of AT8 immunolabeling showing neuritic plaques in the brain of APPswe/PS1dE9 mice after PBS, Aβwt or Aβice inoculation in the dentate gyrus. C Representative images of Tau-positive neuritic plaques in the hippocampus. Magnified views showed no difference in the morphology of neuritic plaques between groups. Quantification of overall AT8-labeled phospho-Tau (percentage of AT8-positive area) revealed decrease of AT8-positive area in the hippocampus (D) of Aβice-inoculated APPswe/PS1dE9 mice compared with PBS- (**p = 0.002) and Aβwt-inoculated (**p = 0.003) APPswe/PS1dE9 mice. AT8 staining was not significantly different in the cortex of the different groups (E). nAPP/PS1PBS = 10, nAβwt = 11, nAβice = 12 mice. **p < 0.01. Data are shown as mean ± s.e.m. Scale bars: A 25 µm; B: 500 µm; C main images = 100 µm, Insets = 20 µm. F Western-blot analysis of phosphorylated Tau (AT8 antibody) and total Tau in hippocampal lysates of APPswe/PS1dE9 mice after PBS, Aβwt or Aβice inoculation. The phosphorylated Tau and total Tau run at an apparent molecular size of 58 kDa. G Semi-quantification of phosphorylated Tau level in the hippocampus of inoculated APPswe/PS1dE9 mice. The phosphorylated form was normalized versus the total form of Tau. The level of pTau was similar between groups (p = 0.10; nAPP/PS1PBS = 3, nAβwt = 3, nAβice = 3 mice). Data are shown as mean ± s.e.m.
Fig. 8
Fig. 8. Reduction of synaptic microglial engulfment in Aβice-inoculated APPswe/PS1dE9 mice.
A Representative images of Iba1 immunolabeling showing microglia in the hippocampus of APPswe/PS1dE9 mice after PBS, Aβwt, or Aβice inoculation. Scale bar: main images = 100 µm, Insets = 20 µm. B Quantification of Iba1 staining revealed similar microglial density in the hippocampus at 4mpi (p = 0.383; Kruskal-Wallis with Dunn’s multiple comparisons). nAPP/PS1-PBS = 5, nAβwt = 5, nAβice = 5 mice. C Quantification of total CD68 in the hippocampus showed an increased lysosomal microglia density in Aβwt-inoculated APPswe/PS1dE9 mice compared to Aβice-inoculated APPswe/PS1dE9 mice (p = 0.019). No difference was observed between PBS- and Aβice-inoculated APPswe/PS1dE9 mice (p = 0.383). Kruskal-Wallis with Dunn’s multiple comparisons. nAPP/PS1-PBS = 10, nAβwt = 11, nAβice = 12 mice. D Co-immunolabeling of lysosomal microglia (CD68, green), post-synaptic (Homer, red) and DAPI (blue) markers. Scale bars= 20 µm E Quantification of total Homer puncta revealed no difference between groups. F Quantification of CD68-positive areas revealed a decrease of microglial lysosomes area in Aβice-inoculated APPswe/PS1dE9 mice compared to Aβwt-inoculated APPswe/PS1dE9 mice (p = 0.01) but no significative difference with PBS-inoculated APPswe/PS1dE9 mice. G CD68-positive lysosomes (green) and Homer spot (red) are 3D-reconstructed to assess phagocytosis of post-synaptic compartment in APPswe/PS1dE9 mice after PBS, Aβwt, or Aβice inoculation. Scale bars= 10 µm. H Quantification of Homer spot inside CD68-positive lysosomes revealed a decreased amount of homer microglial engulfment in Aβice-inoculated APPswe/PS1dE9 mice compared to PBS- (p = 0.014) and Aβwt-inoculated APPswe/PS1dE9 mice (p < 0.0001). I Quantification of the number of Homer spot engulfed versus the total Homer puncta revealed a decreased microglial engulfment of homer marker in Aβice-inoculated APPswe/PS1dE9 mice compared to PBS- (p = 0.003) and Aβwt-inoculated APPswe/PS1dE9 mice (p = 0.0003). Kruskal-Wallis with Dunn’s multiple comparisons. nAPP/PS1-PBS = 7, nAβwt = 10, nAβice = 10 mice. *p < 0.05, **p < 0.01, ***p < 0.001, ****p < 0.0001. Data are shown as mean ± s.e.m.

Similar articles

References

    1. Hampel H, Hardy J, Blennow K, Chen C, Perry G, Kim SH, et al. The amyloid-β pathway in Alzheimer’s disease. Mol Psychiatry. 2021;26:5481–503. - PMC - PubMed
    1. Spires-Jones TL, Hyman BT. The intersection of amyloid beta and tau at synapses in Alzheimer’s disease. Neuron. 2014;82:756–71. - PMC - PubMed
    1. Jonsson T, Atwal JK, Steinberg S, Snaedal J, Jonsson PV, Bjornsson S, et al. A mutation in APP protects against Alzheimer’s disease and age-related cognitive decline. Nature. 2012;488:96–9. - PubMed
    1. Benilova I, Gallardo R, Ungureanu AA, Cano VC, Snellinx A, Ramakers M, et al. The Alzheimer disease protective mutation A2T modulates kinetic and thermodynamic properties of amyloid-beta (A beta) aggregation. J Biol Chem. 2014;289:30977–89. - PMC - PubMed
    1. Kokawa A, Ishihara S, Fujiwara H, Nobuhara M, Iwata M, Ihara Y, et al. The A673T mutation in the amyloid precursor protein reduces the production of beta-amyloid protein from its beta-carboxyl terminal fragment in cells. Acta Neuropathol Commun. 2015;3:ARTN 66. - PMC - PubMed

MeSH terms

LinkOut - more resources