. 2024 Nov;31(11):1680-1691.
doi: 10.1038/s41594-024-01332-4. Epub 2024 Jun 13.

The human ATAD5 has evolved unique structural elements to function exclusively as a PCNA unloader

Affiliations

The human ATAD5 has evolved unique structural elements to function exclusively as a PCNA unloader

Feng Wang et al. Nat Struct Mol Biol. 2024 Nov.

Abstract

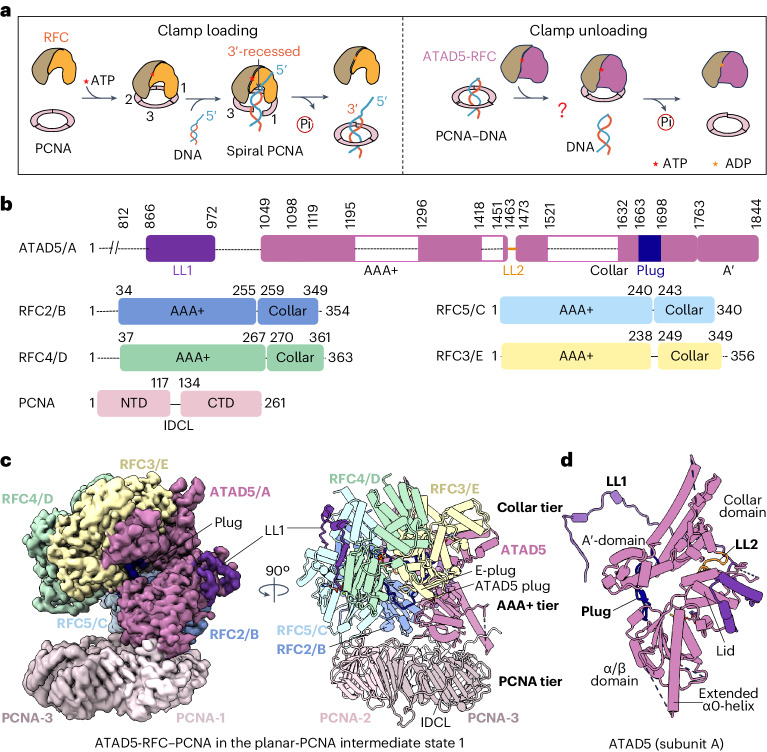
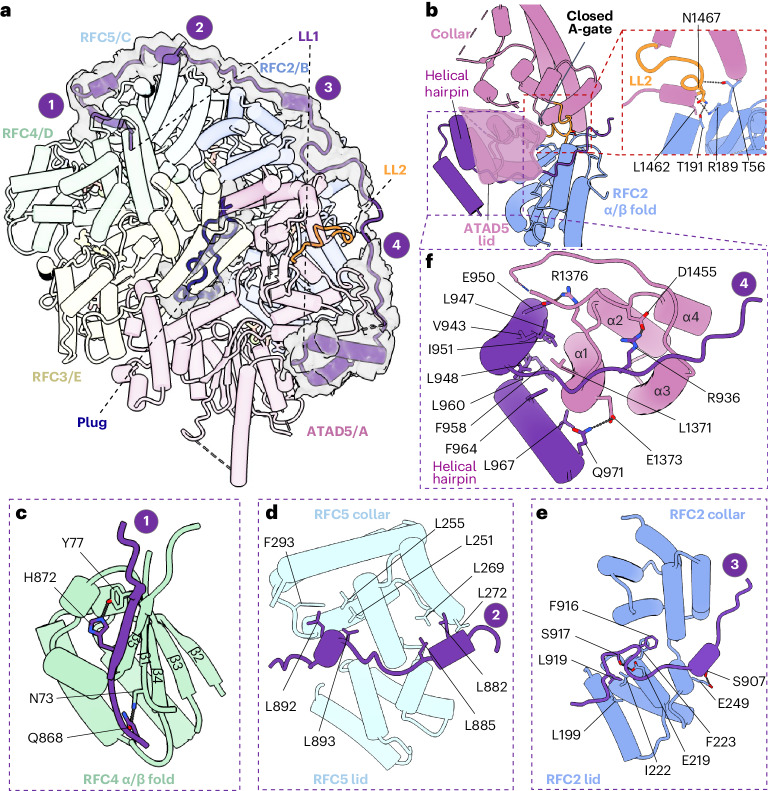
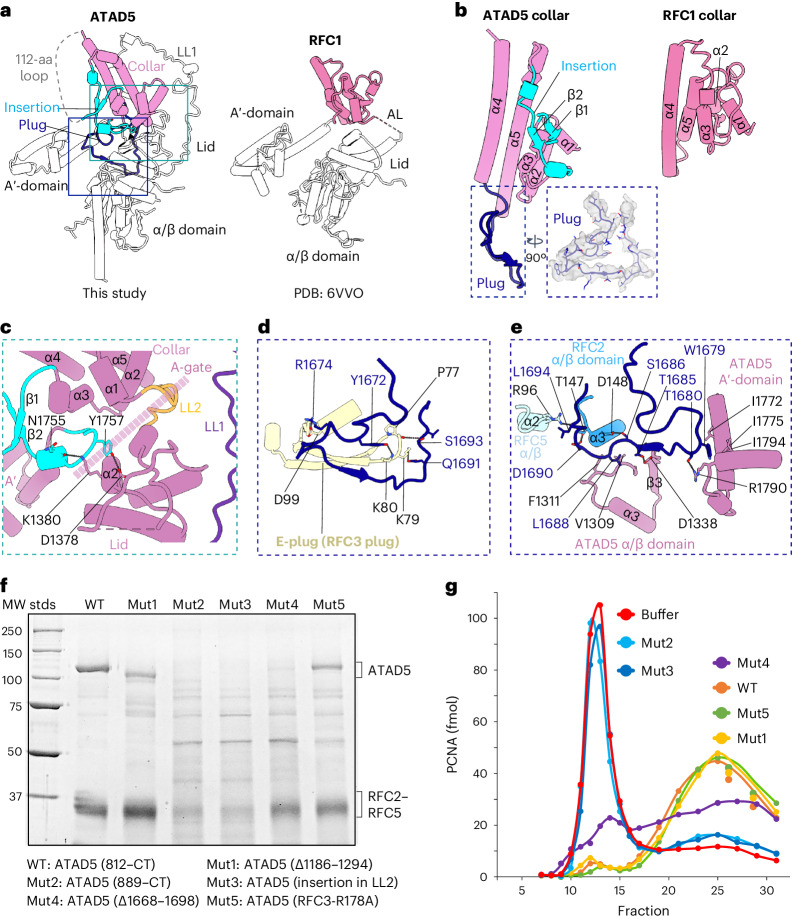
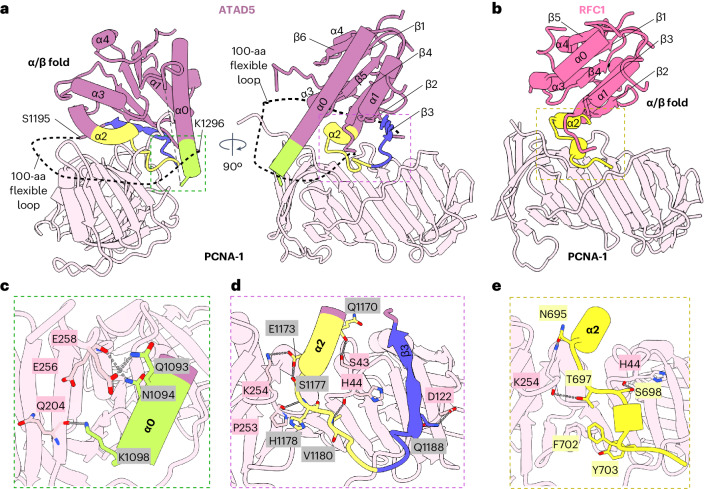
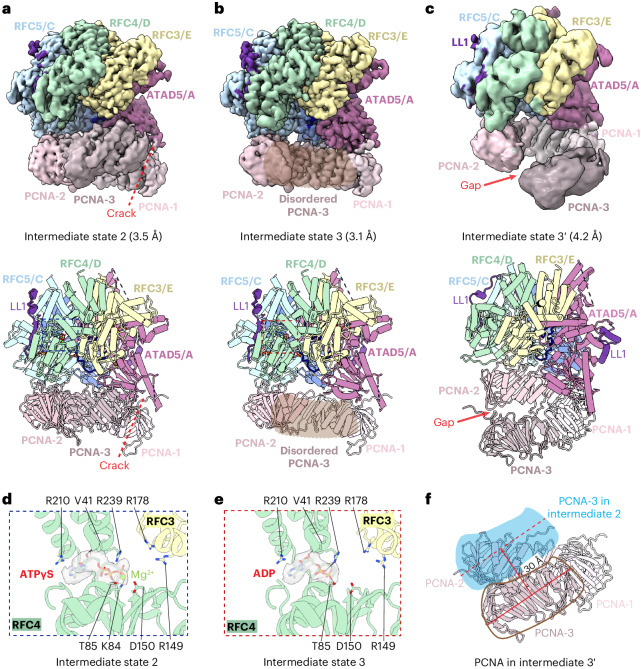
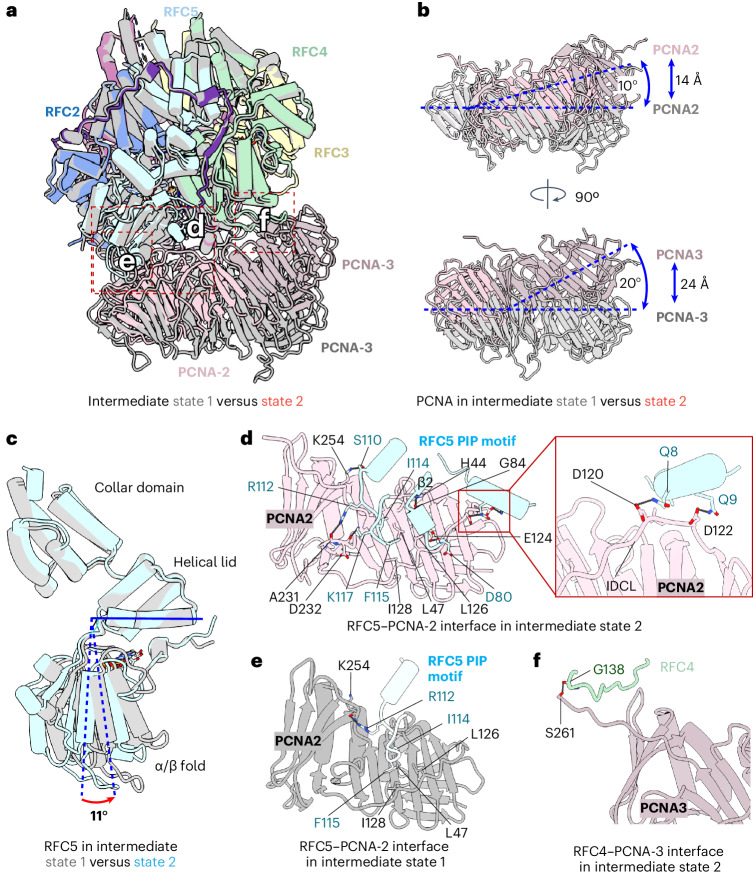
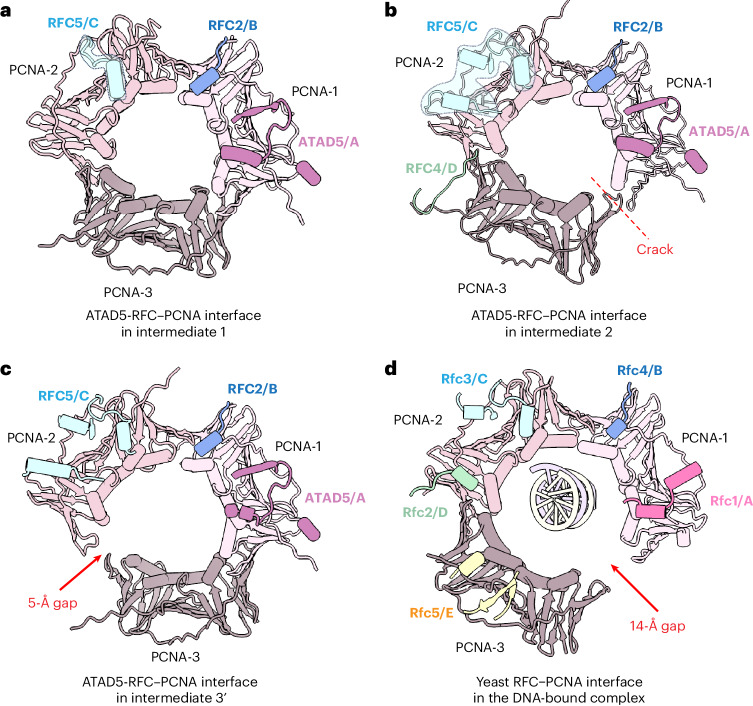
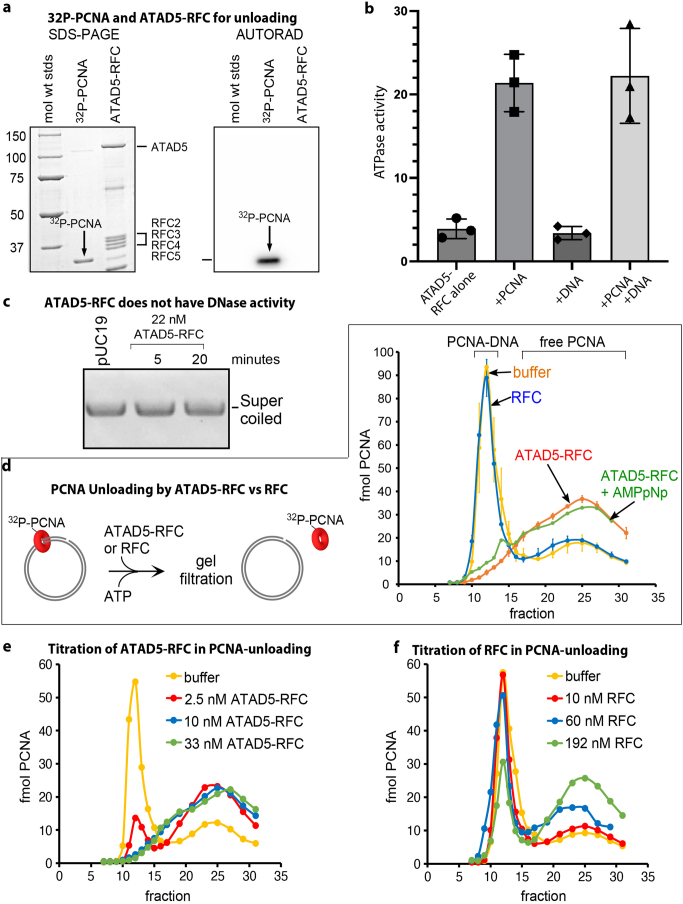
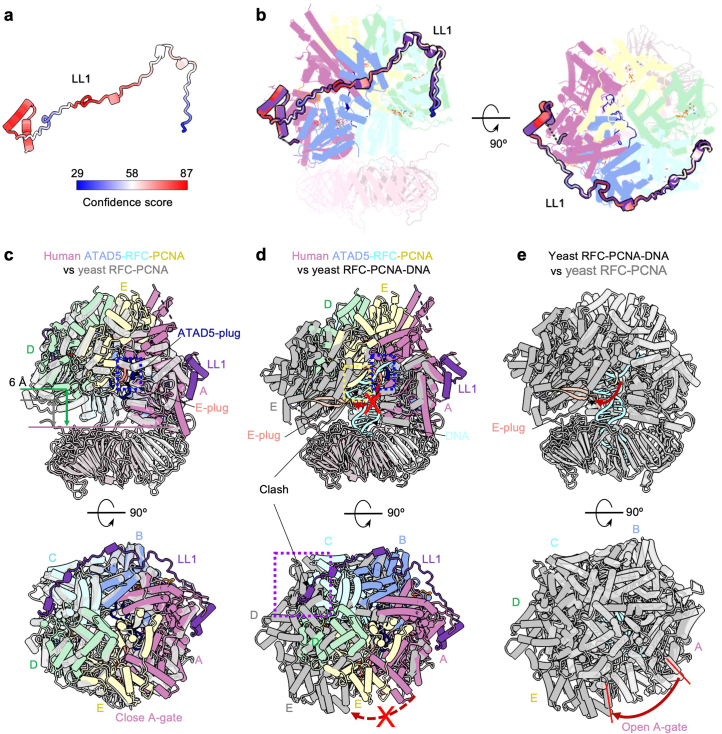
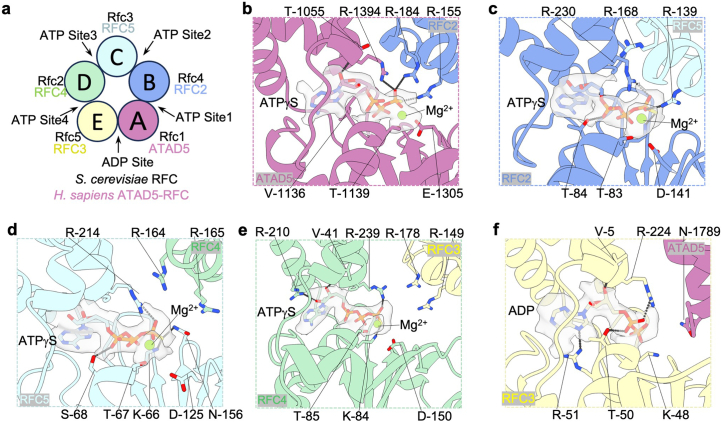
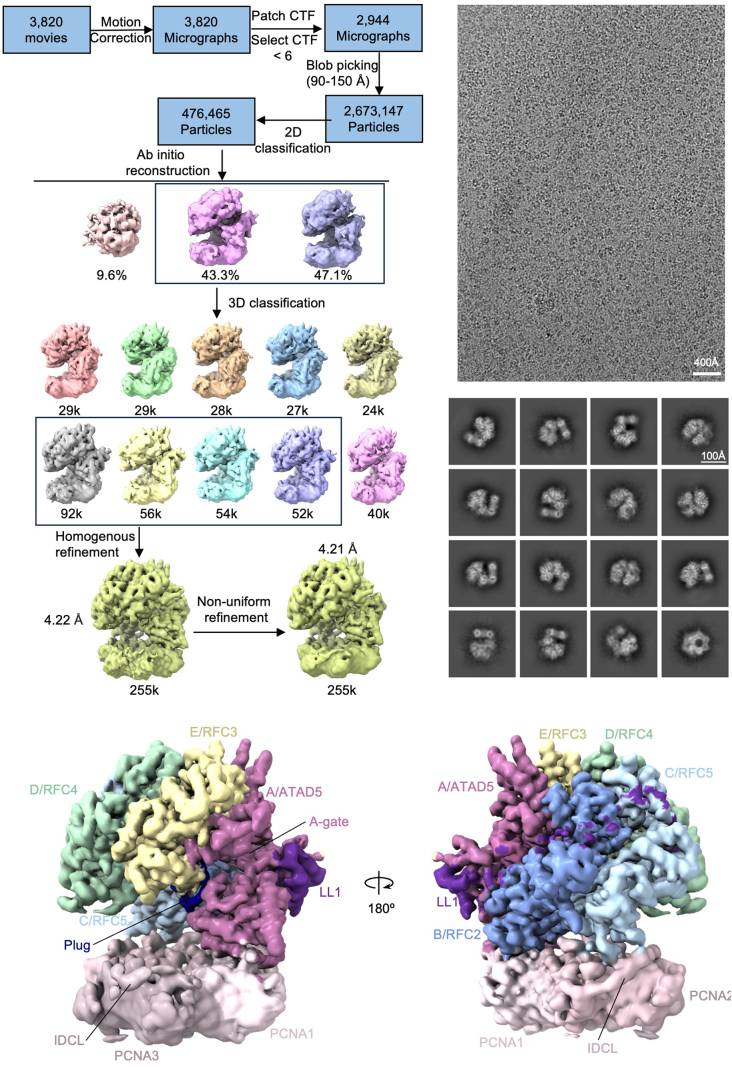
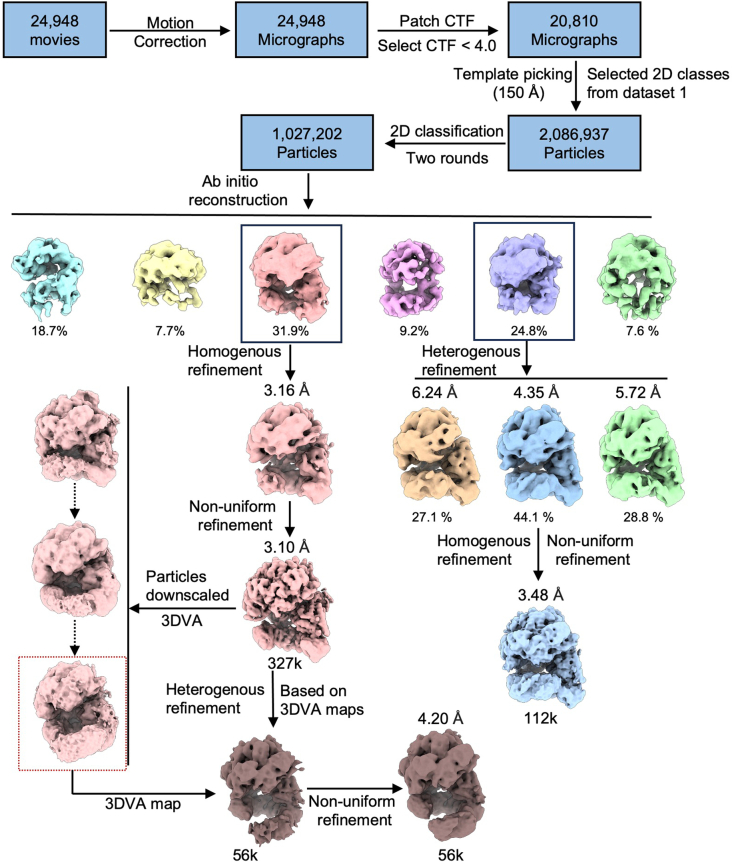
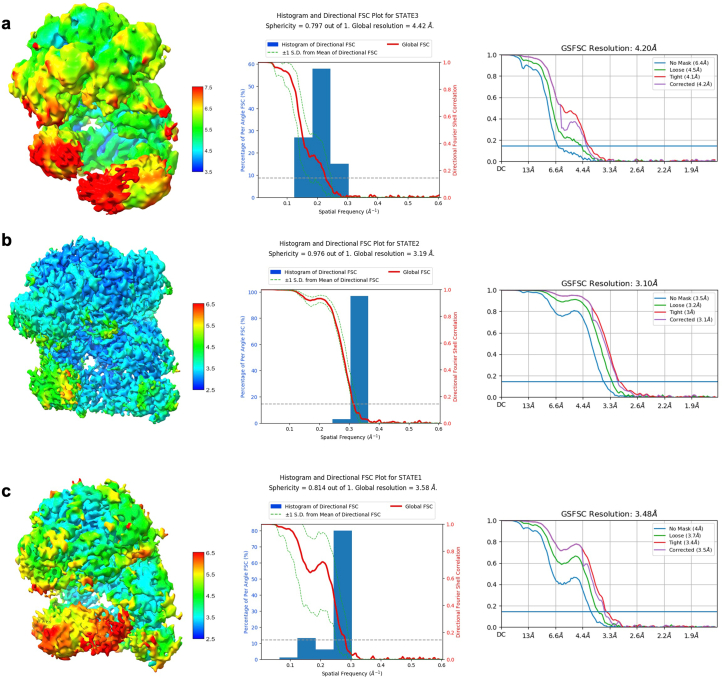
Humans have three different proliferating cell nuclear antigen (PCNA) clamp-loading complexes: RFC and CTF18-RFC load PCNA onto DNA, but ATAD5-RFC can only unload PCNA from DNA. The underlying structural basis of ATAD5-RFC unloading is unknown. We show here that ATAD5 has two unique locking loops that appear to tie the complex into a rigid structure, and together with a domain that plugs the DNA-binding chamber, prevent conformation changes required for DNA binding, likely explaining why ATAD5-RFC is exclusively a PCNA unloader. These features are conserved in the yeast PCNA unloader Elg1-RFC. We observe intermediates in which PCNA bound to ATAD5-RFC exists as a closed planar ring, a cracked spiral or a gapped spiral. Surprisingly, ATAD5-RFC can open a PCNA gap between PCNA protomers 2 and 3, different from the PCNA protomers 1 and 3 gap observed in all previously characterized clamp loaders.


Conflict of interest statement

Competing interests The authors declare no competing interests.

Figures

Fig. 1
Fig. 1. Cryo-EM structure of the human ATAD5-RFC–PCNA complex.
a, The human PCNA clamp is loaded onto DNA by RFC (left) and unloaded from DNA by ATAD5-RFC (right). Although PCNA loading by RFC is well established, how ATAD5-RFC unloads PCNA from DNA and how ATAD5-RFC dissociates from unloaded PCNA have been unclear. b, Domain architectures of ATAD5, RFC2–RFC5 and PCNA. The five subunits in ATAD5-RFC are also labeled A to E. The two locking loops (LL1 in purple and LL2 in orange) and an insertion plug are highlighted. c, EM map (postprocessed with DeepEMhancer) and atomic model of the ATAD5-RFC bound to a closed PCNA ring; individual subunits are colored. The ATAD5 LL1 and plug are highlighted in purple and blue, respectively. The three PCNA molecules are numbered based on the direction of their contact with subunits A to E in RFC and ATAD5-RFC. d, Structure of the largest subunit of ATAD5 (subunit A), with domains and key features labeled.
Fig. 2
Fig. 2. The ATAD5 LL1 locks the A-gate and prevents conformational changes in ATAD5-RFC.
a, Top view of ATAD5-RFC. The bound nucleotide in each subunit is shown as sticks, and Mg2+ in spheres. The EM densities for LL1 and the plug are shown as transparent gray surfaces. LL1 is divided into numbered four regions, to better show detailed interactions in c-e. b, LL1 and LL2 lock the A-gate shut by stabilizing the ATAD5 lid and collar. The zoomed inset shows detailed interactions of LL2 with the RFC2 α/β fold. c-e, Close-up views of the first to third regions in LL1 interacting with RFC4 (c), RFC5 (b) and RFC2 (e). f, Close-up view of the fourth region of LL1 (the helix hairpin) interacting with the ATAD5 lid domain. Key interacting residues are shown as sticks and labeled. H-bonds are shown as dashed lines.
Fig. 3
Fig. 3. The unique ATAD5 plug occupies the central chamber of the unloader complex.
a, Side-by-side comparison of human ATAD5 and RFC1 (PDB 6VVO). The collar domain is colored, and all other regions are shown in light gray. The plug and associated insertion regions in the ATAD5 collar domain are colored blue and cyan, respectively. The disordered 112-aa connecting loop is shown by a dashed cyan line. b, Comparison of the collar domains of ATAD5 (left) and RFC1 (right). The conserved α-helices in both collar domains are labeled. Bottom: the ATAD5 plug is shown as sticks and is superimposed with the EM density in semitransparent gray surface view. c, Close-up of the cyan box in a, showing the ATAD5-plug-associated insertion region near the closed A-gate. The insertion region interacts with the ATAD5 lid domain to help LL1 and LL2 lock the A-gate. Key residues in the interaction are shown as sticks and labeled. d,e, Two close-up views of the blue box in a, in the context of the ATAD5-RFC pentamer. The ATAD5 plug forms a short antiparallel β-sheet with the conserved E-plug (d) and is stabilized by the AAA+ domains of RFC2, RFC3 and RFC5 (d,e). The ATAD5 plug also bridges the α/β fold and the A′ domain to rigidify ATAD5 (e). H-bonds are shown as dashed lines, and key interacting residues are shown in sticks and labeled. f, SDS–PAGE (8%) of 4 μg each of WT ATAD5-RFC and the five ATAD5-RFC mutants (Mut1–Mut5). Mut1–Mut4 contain either deletions or insertions in the truncated ATAD5 (Δ1–812). Mut5 has an amino acid replacement in the Arg finger residue of RFC3. The gel analysis was performed once. The label ‘MW stds’ refers to molecular weight standards. CT, C terminus. g, Comparison of unloading activity of WT ATAD5-RFC with ATAD5-RFC mutants; 6.5 nM ATAD5-RFC (either WT or mutants) was incubated with 32P-labeled PCNA–DNA and 2 mM ATP for 5 min at 37 °C, followed by gel filtration to determine whether the 32P-labeled PCNA is unloaded from DNA. The x axis label ‘Fraction’ refers to individual gel filtration fractions collected for activity assay. This experiment was performed once. Source data
Fig. 4
Fig. 4. The AAA+ module of ATAD5 contains a PCNA-binding interface larger than that of RFC1.
a, The interface between ATAD5 and PCNA-1. The ATAD5 non-canonical PIP box is colored yellow, and the two additional PCNA-binding regions are colored mint green and blue. The secondary structures in the α/β fold are labeled. b, The interface between human RFC1 and PCNA-1 (PDB: 6VVO). RFC1 binds PCNA-1 by only the conserved PIP box (yellow). c, Close-up view of the interactions between the ATAD5 α0 and PCNA-1 (dashed green square in a). d, Close-up view of interactions of the ATAD5 PIP box and the extended β3-strand with PCNA-1 (dashed magenta square in a). e, Close-up view of the interactions of the conserved RFC1 PIP box with PCNA-1 (dashed yellow square in b). Residues involved in the interactions are shown in sticks and labeled in c-e.
Fig. 5
Fig. 5. ATP hydrolysis by RFC4 underlies the transition of the PCNA crack from the right to the left of PCNA-3.
a-c, EM maps (top; postprocessed with DeepEMhancer) and atomic models (bottom) of ATAD5-RFC bound to PCNA in intermediate states 2 (a), 3 (b) and 3′ (c). Maps and structures are colored by individual subunits, as in Fig. 1b. d,e, Close-up views of the nucleotide-binding regions in RFC4 (subunit D) in intermediates 2 (d) and 3 (e), corresponding to areas marked by the blue and red squares at the bottom of a and b. The nucleotides and interacting residues are shown as sticks and labeled. f, The open (gapped) PCNA structure in the intermediate state 3′. The PCNA structure of intermediate state 2 is superimposed, but only the position of its PCNA-3 is shown (in cyan), to reveal a 30-Å movement of PCNA-3 between intermediate state 2 and intermediate state 3′.
Fig. 6
Fig. 6. Conformational change in RFC5 underlies a lock-washer to planar-ring transition of PCNA.
a, Superimposition of ATAD5-RFC–PCNA in intermediate states 1 and 2. Intermediate state 2 is shown in color, and state 1 in gray. b, Two side views of the superimposed PCNA structures showing that PCNA-2 and PCNA-3 undergo large rigid-body movements from a right-handed spiral to a planar ring. c, Overlay of RFC5 (subunit C) in intermediate state 2 (cyan) and in state 1 (gray). The α/β domain rotates 11° with respect to the helical lid. df, Close-up views of the three boxed regions in a, showing detailed interactions between the RFC5 PIP motif and PCNA-2 in intermediate state 2 (d), between the RFC5 PIP motif and PCNA-2 in intermediate state 1 (e) and between RFC4 and PCNA-3 in intermediate state 2 (f). The red box in d is enlarged on the right to show the RFC5 N terminus interacting with PCNA-2. Key residues are shown as sticks and labeled.
Fig. 7
Fig. 7. The PCNA ring is opened by ATAD5-RFC and by RFC at different locations.
a-c, Top views of the interfaces between ATAD5-RFC and the PCNA ring in intermediate states 1 (a), 2 (b) and 3′ (c). Structures are shown in cartoons and colored by individual subunits. The structural elements of the ATD5–RFC subunits contacting the PCNA are labeled. The red arrow in c points to the 5-Å gap between PCNA-2 and PCNA-3. d, Top view of the interface between yeast RFC and PCNA (PDB: 7TFI). All RFC subunits contact the PCNA ring. The red arrow points to the 14-Å gap between PCNA-3 and PCNA-1. PCNA-3 is in the lowest position in ATAD5-RFC–PCNA (c), but is in the highest position in RFC–PCNA (d).
Extended Data Fig. 1
Extended Data Fig. 1. Cryo-EM analysis of purified human ATAD5-RFC bound to PCNA.
a, SDS-PAGE gel of purified human PCNA (lane 2) and ATAD5-RFC (lane 3). The N-terminal 811 residues were truncated in the largest subunit ATAD5. This experiment was done once. b, Selected 2D class averages of the pre-assembled PCNA clamp and DNA complex by mixing the purified human PCNA and the DNA substrate. c, A typical raw micrograph of the in vitro assembled ATAD5-RFC–DNA–PCNA complex. A total of 18,828 such raw micrographs were recorded. d, Selected 2D class averages of four reaction mixtures incubated for either 3, 6, 10, or 20 min. The images demonstrate the interaction between PCNA and ATAD5-RFC, and despite the addition of DNA in the mixtures, no DNA was bound to these complexes. Source data
Extended Data Fig. 2
Extended Data Fig. 2. ATAD5-RFC ATPase and unloading activities.
a, 8% SDS-PAGE of PCNA and ATAD5-RFC. Autoradiography of the PAGE on the right, showing 32P-labeling of PCNA. This experiment was done once. b, ATP hydrolyzed/min by ATAD5-RFC alone or with PCNA and/or DNA. Average activity ± s.e.m. is shown for n = 3 independent experiments. c, Native agarose gel of pUC19 stained with ethidium bromide, showing that ATAD5-RFC did not linearize or degrade the DNA. This experiment was done once. d, 10 nM ATAD5-RFC (red) or RFC (blue) was incubated with 32P-PCNA-DNA and 2 mM ATP for 5 min, followed by gel filtration to determine whether the 32P-PCNA is unloaded from DNA. 2 mM AMPPNP supported PCNA unloading by ATAD5-RFC (green). Experiments were performed in duplicate, and the data points are the average of two determinations performed on different days. The yellow line is a buffer control. See Methods for details. e, Titration of ATAD5-RFC in the unloading of 32P-PCNA from DNA. f, Titration of RFC in the unloading of 32P-PCNA from DNA. Source data
Extended Data Fig. 3
Extended Data Fig. 3. Workflow of cryo-EM data processing and 3D reconstruction of ATAD5-RFC bound to the closed-ring PCNA.
CryoSPARC (version 3.2.0) was used for image processing and 3D reconstruction, yielding the final EM map at 3.04 Å average resolution.
Extended Data Fig. 4
Extended Data Fig. 4. Resolution estimation of the 3D map of ATAD5-RFC-closed PCNA.
a, Color-coded local resolution map of the ATAD5-RFC-closed PCNA EM map. b, The directional anisotropy of the ATAD5-RFC-closed PCNA 3D map as quantified by the 3D-FSC server (https://3dfsc.salk.edu/). The 3D map has a good anisotropic property with a sphericity of 0.891. c, The gold standard Fourier shell correlation curves of the final 3D map.
Extended Data Fig. 5
Extended Data Fig. 5. Comparison of ATAD5-RFC–PCNA with Alpha-fold2 predicted model regions and yeast RFC–PCNA–(DNA) structures.
a, The Alpha-Fold2 predicted ATAD5 LL1 model colored by the prediction confidence score per residue. b, Superimposition of the predicted LL1 model with the cryo-EM structure, revealing their high similarity. c, Superimposition of human ATAD5-RFC-PCNA (color) with yeast RFC–PCNA (gray, PDB ID 7THI) in a front side (upper) and top view (lower). LL1 interacts with subunit D of ATAD5-RFC and moves up the subunit by 6 Å compared to the yeast RFC-PCNA. d, Superimposition of ATAD5-RFC–PCNA (color) with yeast RFC–PCNA–DNA (dark gray, dsDNA in cyan, PDB ID 7TID). The plug loop (blue) stabilizes the E-plug of ATAD5-RFC and sterically clashes with DNA in yeast RFC–PCNA–DNA. LL1 sterically clashes with subunit C of yeast RFC-PCNA-DNA. Unlike in yeast RFC–PCNA–DNA, the ATAD5-RFC E-plug cannot twist and the A-gate cannot open. e, Superimposition of yeast RFC–PCNA–DNA with yeast RFC–PCNA, showcasing the E-plug movement and the A-gate opening as indicated by red arrows.
Extended Data Fig. 6
Extended Data Fig. 6. Subunit arrangement and the nucleotide binding in intermediate state 1 of the ATAD5-RFC–PCNA complex.
a, The arrangement of human ATAD5-RFC subunits as compared to that of the yeast RFC, showing different numbering scheme between the yeast and human PCNA loaders. Nucleotide binding sites at subunit interfaces are indicated. b-f, Detailed view of the nucleotide-binding site in RFC subunit A/ATAD5 (b), B/RFC2 (c), C/RFC5 (d), and D/RFC4 (e) and E/RFC3 (f) of the ATAD5-RFC-closed PCNA complex. The bound ATPγS or ADP are shown in sticks with their respective EM density superimposed in semitransparent gray surface. The Mg2+ ion resolved in subunits A-D are in green spheres. The EM densities for the five bound nucleotides are surface rendered at a same threshold. Residues coordinating the nucleotides are in sticks and labeled.
Extended Data Fig. 7
Extended Data Fig. 7. Cryo-EM of the ATAD5-RFC–PCNA complex obtained from mixture of ATAD5-RFC and PCNA in the absence of DNA.
The EM map in the lower panels is indistinguishable from the EM map of the ATAD5-RFC–PCNA determined from the mixture in the presence of DNA as shown in Extended Data Fig. 3.
Extended Data Fig. 8
Extended Data Fig. 8. Workflow of cryo-EM data processing and 3D reconstruction of ATAD5-RFC–cracked PCNA.
CryoSPARC (version 3.2.0) was used for processing this dataset, leading to an EM map for the ATAD5-RFC bound to a gapped PCNA ring at an average resolution of 3.10 Å and another EM map of ATAD5-RFC bound to a cracked PCNA ring at an overall resolution of 3.48 Å. 3DVA analysis of the particles belong to the gapped 3.10 Å map led to the capture of ATAD5-RFC bound to a cracked ring with a tilted PCNA-3 at an overall resolution of 4.20 Å.
Extended Data Fig. 9
Extended Data Fig. 9. Local resolution estimation of the three EM maps of the ATAD5-RFC–PCNA.
a, Resolution estimation of the ATAD5-RFC-cracked PCNA in intermediate state 3’. b, Resolution estimation of the ATAD5-RFC-cracked PCNA in intermediate state 3. c, Resolution estimation of the ATAD5-RFC-cracked PCNA in intermediate state 2. Left panels are color-coded local resolution map of the ATAD5-RFC-cracked PCNA EM map. Middle panels are directional anisotropy of the 3D map as measured by the 3D-FSC server (https://3dfsc.salk.edu/). Right panels are gold standard Fourier shell correlation curves of the three EM maps.
Extended Data Fig. 10
Extended Data Fig. 10. Nucleotide binding in ATAD5-RFC–PCNA in the cracked-PCNA intermediate state 2 and the open-PCNA intermediate state 3.
a-b, Top views of the ATAD5-RFC in cracked-PCNA intermediate state 2 (a) and the open-PCNA intermediate state 3 (b). c-d, Detailed view of the nucleotide-binding site in ATAD5 and RFC2, 5, 3 in intermediate states 2 (c) and 3 (d). In all panels, the nucleotides are in sticks superimposed with the EM densities rendered at the same threshold in semi-transparent surfaces. And resolved Mg2+ ion in ATAD5 and RFC2, 5 are in green spheres. Residues interacting with the nucleotides are in sticks and labeled.

Similar articles

Cited by

References

    1. Kuriyan, J. & O’Donnell, M. Sliding clamps of DNA polymerases. J. Mol. Biol.234, 915–925 (1993). - PubMed
    1. González-Magaña, A. & Blanco, F. J. Human PCNA structure, function and interactions. Biomol10, 570 (2020). - PMC - PubMed
    1. Moldovan, G.-L., Pfander, B. & Jentsch, S. PCNA, the maestro of the replication fork. Cell129, 665–679 (2007). - PubMed
    1. Joyce, C. M. & Steitz, T. A. Function and structure relationships in DNA polymerases. Annu. Rev. Biochem.63, 777–822 (1994). - PubMed
    1. Krishna, T. S., Kong, X. P., Gary, S., Burgers, P. M. & Kuriyan, J. Crystal structure of the eukaryotic DNA polymerase processivity factor PCNA. Cell79, 1233–1243 (1994). - PubMed

MeSH terms

Substances

LinkOut - more resources