. 2024 Jun 13;14(1):13665.
doi: 10.1038/s41598-024-64215-0.

Increasing magnitude of color differences amplifies category effects

Affiliations

Increasing magnitude of color differences amplifies category effects

Kashi Li et al. Sci Rep. .

Abstract

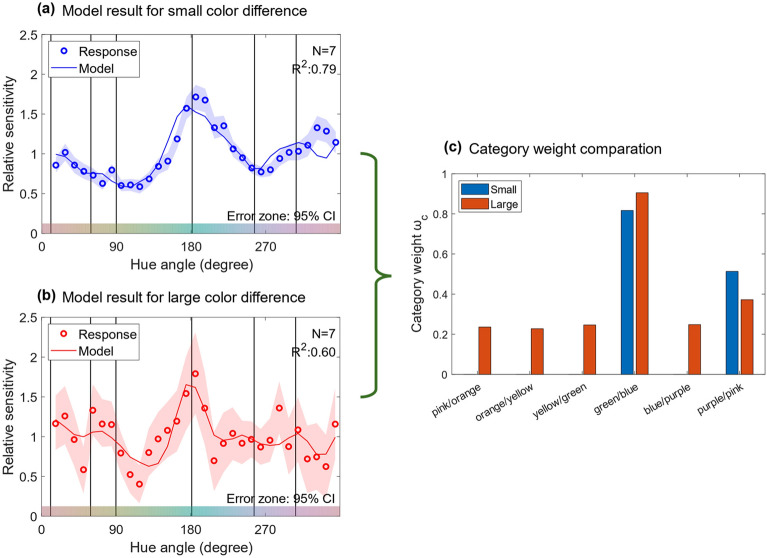
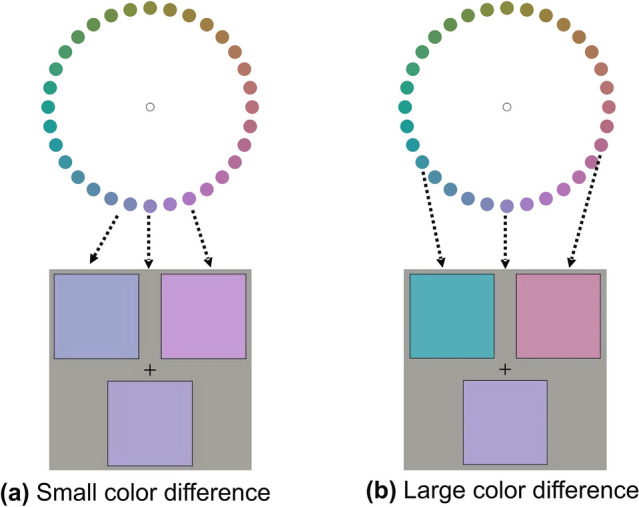
Previous studies have identified differences in sensitivity characteristics between color discrimination and perception of suprathreshold color differences. However, it remains highly unclear how color difference sensitivity changes with increasing magnitudes of color difference along various color hues. This study aimed to quantify the sensitivity transition across various magnitudes of color differences and uncover the underlying mechanisms. Color discrimination sensitivities were measured using an adaptive staircase method for 32 isoluminant pedestal colors in the u'v' chromaticity diagram. For suprathreshold color differences, we employed the Maximum Likelihood Difference Scaling (MLDS) method to measure sensitivity to various color difference levels for the same 32 colors. Our findings confirmed the differences in sensitivity characteristics between discrimination and suprathreshold color difference perception. Furthermore, we observed increased sensitivities at many color category boundaries in suprathreshold color difference perception. By investigating the relation between the category effects and the color difference size levels through a model simulation, our findings suggest that the influence of color categories on the perception of color differences may become more pronounced as the magnitude of color differences increases.


Conflict of interest statement

The authors declare no competing interests.

Figures

Figure 1
Figure 1
Normalized color discrimination sensitivity averaged across all observers. The horizontal axis represents the hue angle of the pedestal color, and the vertical axis represents the normalized discrimination sensitivity. The error zone (gray shaded area) indicates the 95% confidence intervals, which were computed through a parametric bootstrap procedure with 10,000 iterations.
Figure 2
Figure 2
Response probabilities for small and large color differences in MLDS experiment. The horizontal axis represents the perceptual color difference between the left and right pairs in the MLDS model, which was estimated in MLDS model fitting. The vertical axis represents the probability of the response “left stimulus pair had larger color difference.” The data points marked with “o” depict the actual response probabilities from the observers, whereas the data points marked with “.” represent the response probabilities derived from the response model in MLDS. The small color differences are denoted by blue dots, while the large color differences are denoted by the red dots.
Figure 3
Figure 3
Results of suprathreshold color difference experiment. (a) The perceptual scale for small color differences. (b) The perceptual scale for large color differences. (c) The normalized sensitivity for small color differences. (d) The normalized sensitivity for large color differences. The horizontal axis represents the hue angle. The vertical axis represents the perceptual scale or normalized sensitivity. The error zones are the 95% confidence intervals obtained from the parametric bootstrap procedure with 10,000 repetitions. These perceptual scales and sensitivities were computed from responses made by seven observers.
Figure 4
Figure 4
Normalized sensitivities of color discrimination, small suprathreshold color differences, and large suprathreshold color differences. The horizontal axis represents the hue angle, and the vertical axis represents the normalized sensitivity. The error zone (shaded area) indicates the 95% confidence intervals, which were computed through a parametric bootstrap procedure involving 10,000 iterations.
Figure 5
Figure 5
Relative sensitivities for small and large suprathreshold color difference. The horizontal axis represents the hue angle, and the vertical axis represents the relative sensitivities (see text for details). The blue and red lines represent the small and large color differences, respectively. The vertical black lines represent the category boundaries measured in an additional experiment.
Figure 6
Figure 6
Concept of model analysis to represent relative color difference sensitivity. (a) Gaussian models that describe category effects. (b) Munsell color difference that forms the baseline sensitivity. (c) Our model sensitivity represented as the sum of (a) and (b).
Figure 7
Figure 7
Results of model fitting to relative sensitivity for (a) small color differences and (b) large color differences. Circles represent the relative sensitivities measured in the experiment, and the solid line represents the model output. (c) Category weights of six category boundaries (wc (c=1,2,6)) in the model for small and large color differences. The blue and red bars show the category weights for the small and large color differences, respectively.
Figure 8
Figure 8
Normalized sensitivity of three levels of color differences superimposed on category boundaries. The line charts are the same as Fig. 4.
Figure 9
Figure 9
Stimulus colors on the CIE 1976 u'v' chromaticity diagram. We sampled them from this hue circle and represented them by their hue angle. For instance, the color on the positive u' axis was written as “0°” color.
Figure 10
Figure 10
Stimulus example in HFP experiment. Four squares with the same color were displayed in the screen center. The numbers were debugging information that was forgotten to be removed: “U:19.090000” and “D: 18.55000” represent the upper and lower thresholds (cd/m2) set by the observer, “18.630000” represented the current luminance of the stimuli, “97 67 74” represents the RGB DAC values of the stimuli, and “76 79 76” represents the RGB DAC values of the background. Although the values were visible to the observers, they were not informed of the meanings of the values.
Figure 11
Figure 11
Stimulus in color discrimination experiment.
Figure 12
Figure 12
Stimulus in suprathreshold color difference experiment.
Figure 13
Figure 13
Example of color combinations with (a) small and (b) large color differences. The colors indicated by the arrows are used in the stimuli.
Figure 14
Figure 14
Stimulus presentation sequence in color category experiment.

Similar articles

Cited by

References

    1. Giesel M, Hansen T, Gegenfurtner KR. The discrimination of chromatic textures. J. Vis. 2009;9(9):11. doi: 10.1167/9.9.11. - DOI - PubMed
    1. Krauskopf J, Karl G. Color discrimination and adaptation. Vis. Res. 1992;32(11):2165–2175. doi: 10.1016/0042-6989(92)90077-V. - DOI - PubMed
    1. Witzel C, Gegenfurtner KR. Categorical sensitivity to color differences. J. Vis. 2013;13(7):1. doi: 10.1167/13.7.1. - DOI - PubMed
    1. Hillis JM, Brainard DH. Do common mechanisms of adaptation mediate color discrimination and appearance? Uniform backgrounds. J. Opt. Soc. Am. A. 2005;22(10):2090–2106. doi: 10.1364/JOSAA.22.002090. - DOI - PMC - PubMed
    1. Mei M, Leat SJ, Hovis J. Supra-threshold contrast matching and the effects of contrast threshold and age. Clin. Exp. Optom. 2007;90(4):272–281. doi: 10.1111/j.1444-0938.2007.00162.x. - DOI - PubMed