. 2024 Jul;25(7):3090-3115.
doi: 10.1038/s44319-024-00174-x. Epub 2024 Jun 13.

ADAMTS2 promotes radial migration by activating TGF-β signaling in the developing neocortex

Affiliations

ADAMTS2 promotes radial migration by activating TGF-β signaling in the developing neocortex

Noe Kaneko et al. EMBO Rep. 2024 Jul.

Abstract

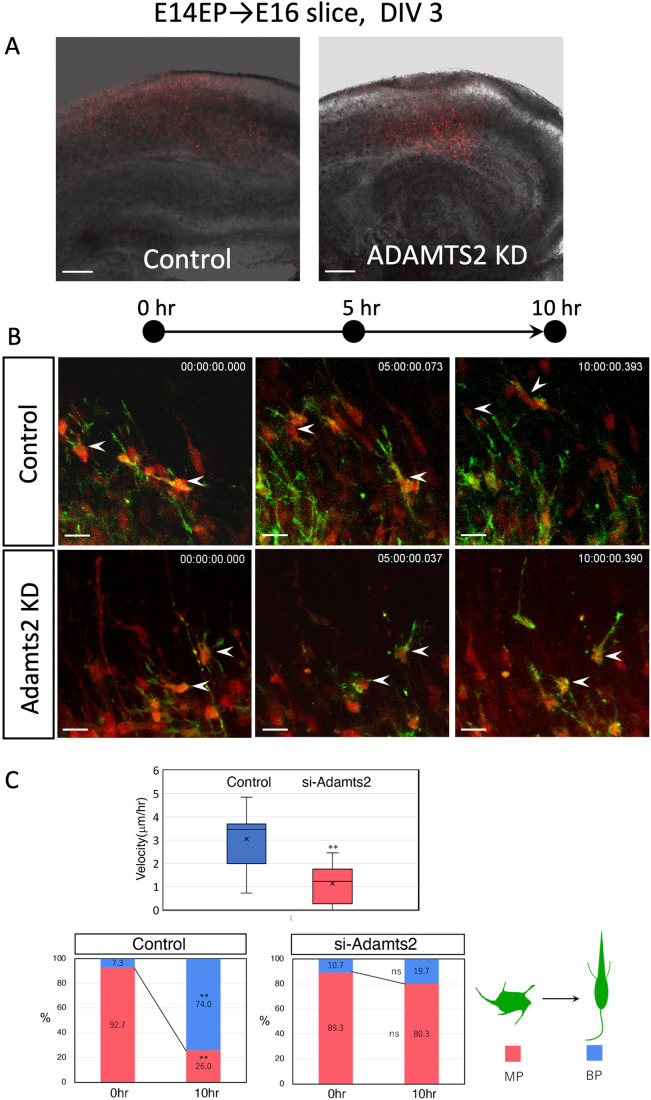
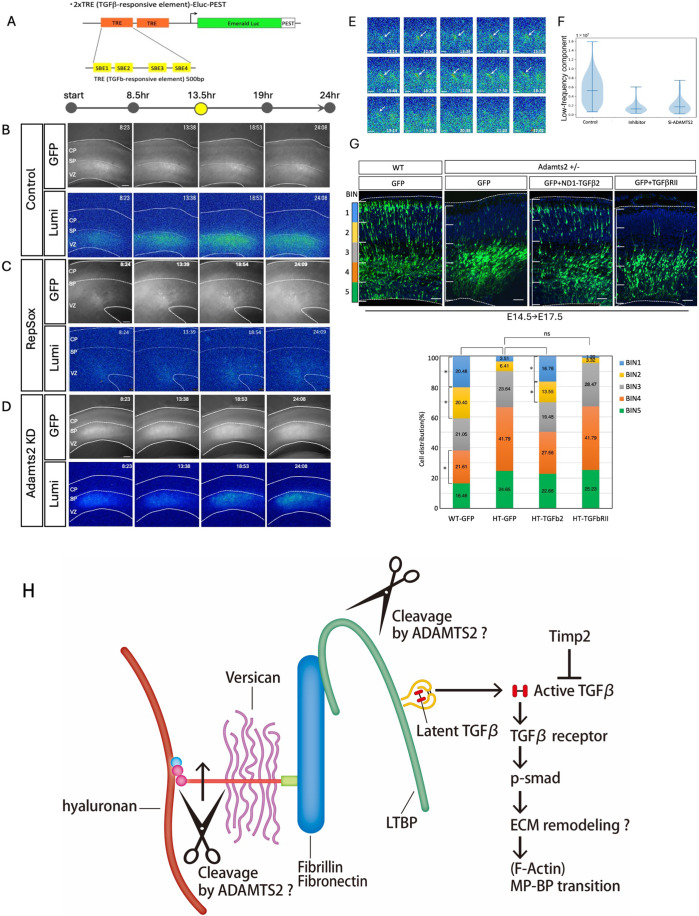
The mammalian neocortex is formed by sequential radial migration of newborn excitatory neurons. Migrating neurons undergo a multipolar-to-bipolar transition at the subplate (SP) layer, where extracellular matrix (ECM) components are abundantly expressed. Here, we investigate the role of the ECM at the SP layer. We show that TGF-β signaling-related ECM proteins, and their downstream effector, p-smad2/3, are selectively expressed in the SP layer. We also find that migrating neurons express a disintegrin and metalloproteinase with thrombospondin motif 2 (ADAMTS2), an ECM metalloproteinase, just below the SP layer. Knockdown and knockout of Adamts2 suppresses the multipolar-to-bipolar transition of migrating neurons and disturbs radial migration. Time-lapse luminescence imaging of TGF-β signaling indicates that ADAMTS2 activates this signaling pathway in migrating neurons during the multipolar-to-bipolar transition at the SP layer. Overexpression of TGF-β2 in migrating neurons partially rescues migration defects in ADAMTS2 knockout mice. Our data suggest that ADAMTS2 secreted by the migrating multipolar neurons activates TGF-β signaling by ECM remodeling of the SP layer, which might drive the multipolar to bipolar transition.

Keywords: ADAMTS2; Cerebral Cortex; ECM; Radial Migration; TGF-β.


Conflict of interest statement

The authors declare no competing interests.

Figures

Figure 1
Figure 1. Radial neuronal migration and the ECM molecules expressed in the SP layer.
(A) A schematic model of radial neuronal migration in the neocortex (left) with a schematic representation of the distribution of various ECM molecules around the SP layer (right). (B) Immunostaining with antibodies for neurocan confirmed that neurocan is specifically highly expressed in the SP layer. RT-PCR using E16 cortical RNA revealed that the versican V0 isoform is a primary subtype. The immunohistochemical signals of cleaved versican were also detected in the SP layer (arrowheads). The upper dashed line shows the cerebral surface, and the lower dashed line shows the border of the ventricular surface. (C) CHase ABC treatment disturbed radial neuronal migration. Slices prepared from E16.5 cortices (EP of GFP at E14.5) were cultured with or without CHaseABC for 3 days (left). In the control slices, many GFP-labeled neurons migrated to the upper part of the cortex, whereas neurons were accumulated beneath the SP layer in the CHaseABC-treated slices. Time-lapse imaging of control migrating neurons revealed that neurites that did not become leading process degenerated (white arrows), whereas neurites became thicker if determined to be leading process (yellow arrows). In contrast, CHase ABC-treated neurons remained multipolar without leading processes. Time-lapse imaging was performed for 50 h after adding CHaseABC; images for 3 h after 32.5 h are shown. (D) Vertical migration velocity of neurons in the CHaseABC-treated slices. Migration velocity was measured by tracking from time-lapse imaging, and ten cells per group were measured. (E) In situ zymography using DQ-gelatin revealed ECM protease activities in the SP layer. FITC signals were visualized by proteolysis of DQ-gelatin. The MZ and SP layer were distinctly FITC-positive (a, a’). b–c’, The slices incubated with metalloproteinase inhibitors (1,10-phenanthroline and GM6001) did not show these signals (b–c’). Data information: In (D), Each group plots measurement data from 10 cells each. The statistical significance was measured by unpaired, two-tailed t-tests (*p < 0.05; **p < 0.01; ***p < 0.001). Scale bars: (B) 50 μm; (C-left and E) 100 μm; (C-right) 10 μm; MZ marginal zone, CP cortical plate, SP subplate, IZ intermediate zone, VZ ventricular zone.
Figure 2
Figure 2. Migrating neurons express ADAMTS2 in the SP layer.
(A) Left: A schematic representation of the FACS microarray analyses of migrating neurons. Right: FACS microarray analyses revealed that the expression of Adamts2 mRNA was increased during radial migration. (B) Adamts2 mRNA was localized at the upper part of IZ, the lower part of the SP layer, and the CP. Arrowheads refer to mRNA signals. (C) Double staining of ADAMTS2-ISH and anti-GFP antibody-IMH revealed that GFP-positive migrating neurons express Adamts2 mRNA. Data information: In (B), data represents the average values from three independent experiments. The statistical significance for each pair was measured by unpaired, two-tailed t-tests (*p < 0.05; **p < 0.01; ***p < 0.001). Scale bars: (B) 100 μm; (C-left) 50 μm; (C-middle) 20 μm; (C-right) 10 μm. MZ marginal zone, CP cortical plate, SP subplate, IZ intermediate zone, SVZ subventricular zone, VZ ventricular zone.
Figure 3
Figure 3. Adamts2 is involved in the regulation of radial neuronal migration.
(A) GFP-expression plasmids were co-electroporated with si-RNA for Adamts2 at E14.5, and the distribution of GFP-positive neurons was analyzed at E17.5 and E18.5. Compared with the control, knockdown of Adamts2 resulted in the retardation of radial neuronal migration. Many neurons were stacked just below the SP layer at E17.5 and E18.5. A part of the neurons remained in the middle of migration at E18.5 (N = 18 sections for each group; three fetuses from two mother mice were collected, and we used three sections from each brain for quantification. A graph quantifying the migration status of each experiment is shown on the right side of each. (B) Neuronal migration was impaired by overexpression of Adamts2 (N = 7 sections for each group; two or three fetuses from three mother mice were collected, and we used one section from each brain for quantification). (C) The impairment of migration by Adamts2 knockdown was rescued by co-electroporation of Adamts2 expression vectors (N = 5 sections for each group; one or two fetuses from three mother mice were collected, and we used one section from each brain for quantification). Data information: In (A), (B), control, and si-RNA knockdown or Adamts2 overexpression brains were recovered and counted in pairs on the same litter. In (C), control, knockdown, and rescued brains were recovered from the same litter. The statistical significance for each pair was measured by unpaired, two-tailed t-tests (*p < 0.05; **p < 0.01; ***p < 0.001). Scale bars, 50 μm.
Figure 4
Figure 4. Time-lapse imaging of Adamts2 knockdown revealed that knockdown neurons are impaired in multipolar-bipolar conversion.
(A) CAG-Lifeact (F-actin labeling) and RFP plasmids were electroporated at E14.5 and cultured slices were prepared at E16.5. Time-lapse imaging was performed for 24 h. Images of slices after 3 days in culture. Many cells were remained under the SP layer in the Adamts2-knockdown slices. (B) The localization of F-actin (Lifeact:green) was disturbed in the knockdown slices (see Movie EV2). In the control slices, MpNs transformed into bipolar neurons after 10 h (arrowheads), whereas Adamts2-knockdown neurons remained multipolar for 10 h. (C) The migration speed in the direction of the brain surface was measured (top left) (N = 10 cells each). The speed of Adamts2-knockdown neurons was significantly low compared with that of the control. The number of multipolar and bipolar cells was counted at the start of imaging and after 10 h (N = 3 slices from three independent experiments). Knockdown of Adamts2 suppressed the multipolar-to-bipolar transition (Bottom). Data information: The statistical significance for each pair was measured by unpaired, two-tailed t-tests (*p < 0.05; **p < 0.01; ***p < 0.001). Scale bars: (A) 100 μm; (B) 10 μm.
Figure 5
Figure 5. TGF-β signaling-related proteins are localized at the SP layer.
(AH) Cortical sections from Lpar1-EGFP mice, in which SP neurons expressed EGFP, were immunostained with antibodies against TGF-β signaling-related proteins. Timp2 and p-Smad were expressed at the upper part and the lower part of the SP layer, respectively. (I, I’) TGF-βRII immunoreactivities were localized at the SP layer and the upper part of the intermediate zone. (J) The expression of CTGF, a direct downstream target of TGF-β signaling, was down-regulated in the cerebral cortex of Adamts2 KO mice. The expression levels of CTGF were measured by Q-PCR using mRNAs isolated from the cerebral cortex (N = 3 sections for each group: three different embryos (E18) were used for collecting cerebral cortex). All sections were E15.5. Data information: The statistical significance for each pair was measured by unpaired, two-tailed t-tests (*p < 0.05; **p < 0.01; ***p < 0.001). Scale bars, 100 μm.
Figure 6
Figure 6. Perturbation of TGF-β signaling impaired radial neuronal migration.
(A) Overexpression of TGF-βRII in the migrating neurons impaired radial neuronal migration (N = 8 sections for each group; two fetuses from two mother mice were collected, and we used two sections from each brain for quantification. Control and overexpression were counted in pairs on the same litter). (B) Inhibitors of TGF-β receptor (50 μM RepSox and 1 μM LDN212854) disturbed radial neuronal migration in the cultured slices (N = 3 slices from three independent experiments). A graph quantifying the migration status of each experiment (A, B) is shown on the right side of each. (C) Selected images from the time-lapse recordings of F-actin dynamics shown in Movie EV3 (left). CAG-Lifeact and RFP plasmids were electroporated at E14.5. The brain slices were prepared at E16.5 and cultured in the presence or absence of 50 μM RepSox. The multipolar-to-bipolar transition was impaired in the presence of the inhibitor. Arrows indicate neurites. In control, cells became bipolar and had leading process, whereas those in the TGFβ inhibitor-treated group were observed to have multipolar neurites. Morphological analyses indicated that the multipolar-to-bipolar transition was impaired in the inhibitor-treated slices (N = 4 imaging areas from two experiments) (right). Data information: The statistical significance for each pair was measured by unpaired, two-tailed t-tests (*p < 0.05; **p < 0.01; ***p < 0.001). Scale bars: (A, B) 50 μm; (C) 10 μm.
Figure 7
Figure 7. Time-lapse imaging of TGF-β signaling during radial neuronal migration.
(A) The plasmid construct used for luminescent imaging of TGF-β signaling. TGF-β-responsive elements were tandemly inserted into the upstream of Emerald Luc conjugated with the PEST sequence. (BD) 2xTRE-Eluc-Pest plasmids were electroporated at E14.5 along with GFP-expression plasmids. The luminescence imaging was performed using cultured slices prepared at E16.5. Compared with the control (B), the luminescence signals were diminished when 50 μM RepSox was added (C), or Adamts2 si-RNA was co-electroporated (D). (E) Enlarged images revealed that a control migrating neuron transiently showed strong luminescence emission during the multipolar-to-bipolar transition from 12 to 18 h. Arrows indicate migrating neurons with positive luminescent signals. (F) Quantification of the luminescence signals (N = 3 slices from three independent experiments). The data were taken 4.5 h after the start of imaging. (G) Overexpression of TGF-β2 rescues the migration impairment phenotype of the Adamts2 KO heterozygous mouse cortex. Plasmids expressing TGF-β2 or TGF-βRII under the NeuroD1 promoter were used to determine if they could rescue the phenotype of impaired radial migration in the Adamts2 KO heterozygous mouse embryonic cortex. The phenotype was rescued by overexpression of TGF-β2 but not by overexpression of TGF-βRII. In utero electroporation was performed at E14.5, and the brains were fixed at E17.5. Compared with heterozygous brains in which GFP was electroporated (HT-GFP), the proportion of neurons distributed in BIN 1 and 2 significantly increased in the TGF-β2 rescued brains (HT-TGFb2) (N = 6 sections for each group. Three sections from two brains each were analyzed). A graph quantifying the migration status is shown at the bottom. (H) Hypothetical model for the functions of ADAMTS2. The migrating multipolar neurons transiently secrete ADAMTS2 around the bottom part of the SP layer, which cleaves TGF-β-related ECM proteins such as LTBP1 and versican. After these initial cleavages, active TGF-β- is released from the ECM, which initiates the activation process of TGF-β signaling, leading to the multipolar-to-bipolar transition and switching of the migration mode. Data information: The statistical significance for each pair was measured by unpaired, two-tailed t-tests (*p < 0.05; **p < 0.01; ***p < 0.001). Scale bars: (E) 10 μm; (G) 50 μm.
Figure EV1
Figure EV1. The subplate layer is rich in ECM components.
(A) In situ hybridization databases revealed that mRNAs of genes encoding ECM proteins are localized at the subplate layer in the developing mouse cortex (arrowheads). The data for Fibronectin 1, Collagen XIa1, and PTPRZ1 are from Allen brain atlas and the data for LTBP1 is from Gene Paint. (B) Immunohistochemistry of Fibrillin-2 indicated that this protein is localized at subplate (SP) and intermediate zone. The migrating neurons were labeled with EGFP by in utero electroporation at E14. The immunoreactivities for LTBP-1 were localized at SP and ventricular zone (VZ). In this section, SpNs were labeled by EGFP.
Figure EV2
Figure EV2. In situ zymography using DQ-gelatin revealed that ECM protease activity (green) occurred in the SP layer.
(A) RFP expression plasmids were electroporated in utero at E14.5, and brains were dissected at E17.5. Cultured slices were prepared using these electroporated brains and were incubated with DQ-gelatin. Image acquisition began 30 min after incubation, and time-lapse imaging was performed every 10 min for ~16 h. Enlarged images reveal that the migrating neurons exhibited gelatinolytic activities near the SP layer (indicated by arrows in a–b”). (B) Example of another slice. When the region (a) is enlarged, cells before entering the SP (cell 1) are green-negative, but cells entering the SP (cells 2, 3 and 4) are green-positive and show gelatinase activity. However, cells that have passed through the SP layer (cells 5, 6) are also green-negative. Scale bars, 50 μm for (A), (B), 10 μm for (A-a-b”) and (B-a-a”).
Figure EV3
Figure EV3. Neuron-specific overexpression of Adamts2.
Adamts2 cDNA was subcloned under the NeuroD1 promoter and used for in utero electroporation experiments. In utero electroporation was performed at E14, and the brains were dissected at E17. The number of cells distributed in the five bins was counted. Neuron-specific overexpression of Adamts2 resulted in impaired migration (N = 5 sections for each group; two fetuses from two mother mice were collected, and we used one or two sections from each brain for quantification. Control and overexpression were counted in pairs on the same litter) The statistical significance for each pair of the same bin was measured by unpaired, two-tailed t-tests (*p < 0.05; **p < 0.01; ***p < 0.001) Scale bars; 100 μm.
Figure EV4
Figure EV4. Impaired radial neuronal migration in the brain of Adamts2 knockout heterozygous mice.
Adamts2 KO mice showed significant migration defects in heterozygous (HT) mice, but not in homozygous (HM) mice. N = 6 sections; two fetuses from three mother mice for WT and HT, N = 4 sections; two fetuses from two mother mice for HM. The statistical significance for each pair of the same bin was measured by unpaired, two-tailed t-tests (*p < 0.05; **p < 0.01; ***p < 0.001). Scale bars; 100 μm.
Figure EV5
Figure EV5. Adamts3 rescued the migration defects caused by Adamts2 knockdown.
Adamts3 and Adamts14 cDNAs were subcloned directly under the NeuroD1 promoter and used for the rescue experiments of Adamts2 knockdown. In utero electroporation was performed at E14, and the brains were dissected at E17 (A). The number of cells distributed in the five bins was counted (B). When Adamts3-expression plasmid was introduced with Adamts2 si-RNA, the migration phenotype was rescued. In the case of Adamts14, the migration phenotype was not rescued. N = 5–7 slices from three brains to six brains collected from two mother mice were used for the analysis. The statistical significance for each pair of the same bin was measured by unpaired, two-tailed t-tests (*p < 0.05; **p < 0.01; ***p < 0.001). Scale bars, 50 mm.

References

    1. Arning A, Hiersche M, Witten A, Kurlemann G, Kurnik K, Manner D, Stoll M, Nowak-Gottl U. A genome-wide association study identifies a gene network of ADAMTS genes in the predisposition to pediatric stroke. Blood. 2012;120:5231–5236. doi: 10.1182/blood-2012-07-442038. - DOI - PubMed
    1. Asano K, Nelson CM, Nandadasa S, Aramaki-Hattori N, Lindner DJ, Alban T, Inagaki J, Ohtsuki T, Oohashi T, Apte SS, et al. Stromal versican regulates tumor growth by promoting angiogenesis. Sci Rep. 2017;7:17225. doi: 10.1038/s41598-017-17613-6. - DOI - PMC - PubMed
    1. Bekhouche M, Colige A. The procollagen N-proteinases ADAMTS2, 3 and 14 in pathophysiology. Matrix Biol. 2015;44-46:46–53. doi: 10.1016/j.matbio.2015.04.001. - DOI - PubMed
    1. Bekhouche M, Leduc C, Dupont L, Janssen L, Delolme F, Vadon-Le Goff S, Smargiasso N, Baiwir D, Mazzucchelli G, Zanella-Cleon I, et al. Determination of the substrate repertoire of ADAMTS2, 3, and 14 significantly broadens their functions and identifies extracellular matrix organization and TGF-beta signaling as primary targets. FASEB J. 2016;30:1741–1756. doi: 10.1096/fj.15-279869. - DOI - PubMed
    1. Colige A, Sieron AL, Li SW, Schwarze U, Petty E, Wertelecki W, Wilcox W, Krakow D, Cohn DH, Reardon W, et al. Human Ehlers-Danlos syndrome type VII C and bovine dermatosparaxis are caused by mutations in the procollagen I N-proteinase gene. Am J Hum Genet. 1999;65:308–317. doi: 10.1086/302504. - DOI - PMC - PubMed

Substances