. 2024 Jul;21(7):1196-1205.
doi: 10.1038/s41592-024-02303-9. Epub 2024 Jun 13.

CellRank 2: unified fate mapping in multiview single-cell data

Affiliations

CellRank 2: unified fate mapping in multiview single-cell data

Philipp Weiler et al. Nat Methods. 2024 Jul.

Abstract

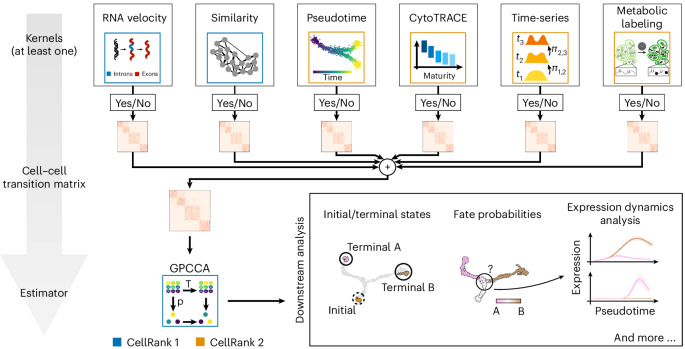
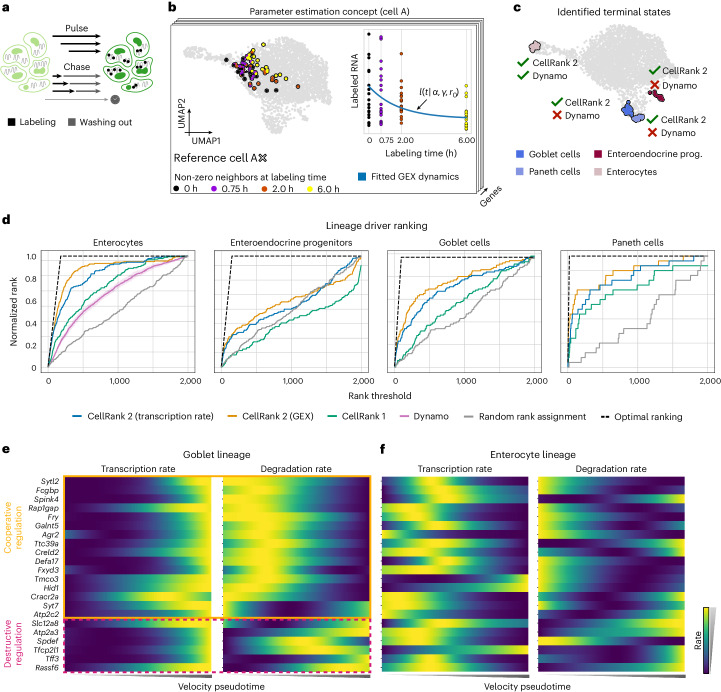
Single-cell RNA sequencing allows us to model cellular state dynamics and fate decisions using expression similarity or RNA velocity to reconstruct state-change trajectories; however, trajectory inference does not incorporate valuable time point information or utilize additional modalities, whereas methods that address these different data views cannot be combined or do not scale. Here we present CellRank 2, a versatile and scalable framework to study cellular fate using multiview single-cell data of up to millions of cells in a unified fashion. CellRank 2 consistently recovers terminal states and fate probabilities across data modalities in human hematopoiesis and endodermal development. Our framework also allows combining transitions within and across experimental time points, a feature we use to recover genes promoting medullary thymic epithelial cell formation during pharyngeal endoderm development. Moreover, we enable estimating cell-specific transcription and degradation rates from metabolic-labeling data, which we apply to an intestinal organoid system to delineate differentiation trajectories and pinpoint regulatory strategies.


Conflict of interest statement

F.T. consults for Immunai, Singularity Bio, CytoReason, Cellarity and Curie Bio Operations and has ownership interest in Dermagnostix and Cellarity. D.P. is on the scientific advisory board of Insitro. The other authors declare no competing interests.

Figures

Fig. 1
Fig. 1. CellRank 2 provides a unified framework for studying single-cell fate decisions using Markov chains.
CellRank 2 uses a modular design. Data and problem-specific kernels calculate a cell–cell transition matrix inducing a Markov chain (MC); of these kernels, at least one has to be used, but multiple can be combined via a kernel combination (Methods). Estimators analyze the MC to infer initial and terminal states, fate probabilities and lineage-correlated genes. Using fate probabilities and a pseudotime allows for studying gene expression changes during lineage priming. Features inherited from the original CellRank implementation are indicated in blue and new features are in orange.
Fig. 2
Fig. 2. Leveraging pseudotemporal ordering for cellular fate mapping.
a, The PseudotimeKernel biases the edges of a phenotypic similarity-based nearest-neighbor graph toward increasing pseudotime, defining cell–cell transition probabilities. b,c, UMAP embedding of 24,440 peripheral blood mononuclear cells, colored by cell type (cDC; G/M progenitor, granulocyte/myeloid progenitor; HSC; MK/E prog, megakaryocyte/erythrocyte progenitors; pDC). We illustrate the well-known differentiation hierarchy in black (b) as well as projected velocity fields based on the PseudotimeKernel (c, left) and RNA velocity (c, right). d, Correlating fate probabilities with gene expression recovers known lineage drivers for the pDC lineage,. We show lineage-specific trends as proposed in our earlier work by fitting generalized additive models to gene expression (y axis) in pseudotime (x axis); the contribution of each cell to each lineage is weighted according to CellRank 2-recovered fate probabilities. Colors correspond to lineages as shown in b.
Fig. 3
Fig. 3. The CytoTRACEKernel recovers temporal gene activation.
a,b, UMAP embedding of 31,029 embryoid body cells, colored by original cluster annotation (CPs, cardiac precursors; EN, endoderm; EPs, epicardial precursors; ESC, embryonic stem cell; Hem., hemangioblast; ME, mesoderm; NC, neural crest; NE, neuroectoderm; NS, neuronal subtypes; Post. EN, posterior endoderm; SMPs, smooth muscle precursors; a, left), embryo stage (E) (a, right) and pseudotimes from the CytoTRACEKernel (b). c, Terminal states inferred using the CytoTRACEKernel. d, UMAP embedding colored by fate probabilities (top) and gene expression of recovered drivers (bottom) of the endoderm lineage. e, Smoothed gene expression along the CytoTRACE pseudotime for the automatically identified top 50 lineage-correlated genes, sorted according to their pseudotime peak. Genes identified in the original publication (left) and known drivers (right) additionally recovered with CellRank 2 are indicated.
Fig. 4
Fig. 4. Inferring state trajectories through time-resolved measurements.
a, The RealTimeKernel combines across time-point transitions from WOT with within-time-point transitions from gene expression similarity to account for the asynchrony observed in many cellular processes. All views are combined in a single transition matrix. b, By including within-time-point information, the RealTimeKernel enables recovering more granular state transitions; WOT only considers transitions between consecutive time points. c, UMAP embedding of pharyngeal organ development (n = 55,044 cells) colored by embryonic day (E; left) and original cell type annotation (right; cTEC, mTEC, UBB); gray color encodes early, uncommitted cells. d, Using the RealTimeKernel, CellRank 2 correctly identifies 10 out of 11 terminal states. The black outline highlights mTECs and potential precursor cells. e,f, Fate probabilities toward the mTEC terminal state (left) and top 20 lineage-correlated genes identified (right) based on the RealTimeKernel (e) or WOT’s pullback distribution (f). We highlight TFs in yellow and known mTEC development genes in green. CellRank 2 identifies putative drivers by correlating fate probabilities with gene expression, WOT by comparing high- and low-probability cells.
Fig. 5
Fig. 5. Quantifying lineage-specific regulation strategies through metabolic labeling.
a, Cells are metabolically labeled in pulse–chase experiments followed by simultaneous sequencing. Pulse experiments involve incubation with nucleoside analogs for varying durations; in chase experiments, cellular mRNA fully incorporates nucleoside analogs during a long incubation, followed by washing out of these nucleosides for varying durations. b, For each cell, gene and labeling duration, we identify the number of neighbors such that a predefined number of cells with non-trivial counts are included in the neighborhood, illustrated here for an exemplary cell A. These cells are then used to estimate cell and gene-specific transcription and degradation rates α and γ, respectively, to model the dynamics of labeled mRNA. c, UMAP embedding highlighting terminal states identified using CellRank 2 and dynamo. Green ticks indicate that a method recovered the corresponding terminal state, and red crosses indicate that the terminal state was not identified. d, Ranking of drivers for each lineage identified by different methods. Dynamo identified only enterocytes as terminal and, thus, provides a gene ranking only for this lineage. For dynamo, the mean gene ranking and corresponding 95% confidence band are shown (Methods). e, Inferred transcription (left) and degradation (right) rates of top-ranked known drivers of the goblet lineage. f, Same as e, but along the enterocyte lineage.
Extended Data Fig. 1
Extended Data Fig. 1. Guiding kernel choice in CellRank 2.
CellRank 2 implements various kernels suitable for different data modalities and experimental designs. The diagram may be used as a guide to identify the most suitable kernel. Note that assumptions change as methods evolve; for example, more recent inference schemes for RNA velocity account for non-constant kinetic rates.
Extended Data Fig. 2
Extended Data Fig. 2. CellRank 2 scales to large cell numbers.
a. Runtime (left) and peak memory consumption (right) to compute fate probabilities with CellRank (orange) and CellRank 2 (blue). Both methods were run on subsets of a reprogramming dataset containing over 100, 000 cells. Box plots indicate the median (center line), interquartile range (hinges), and whiskers at 1.5x interquartile range (N = 10 runs each). b. The CellRank 2 adaptation of CytoTRACE scales to a mouse organogenesis atlas of 1.3 million cells, whereas CytoTRACE fails above 80, 000 cells. Box plots indicate the median (center line), interquartile range (hinges), and 1.5x interquartile range (whiskers) (50, 000 cells, original: N = 6 runs; 60, 000 cells, original: N = 8 runs; 80, 000 cells, original: N = 9 runs; otherwise: N = 10 runs). c. Runtime for calculating macrostates and fate probabilities using the RealTimeKernel with (brown) and without (green) thresholded transition matrix. Box plots indicate the median (center line), interquartile range (hinges), and 1.5x interquartile range (whiskers) (N = 10 runs each).
Extended Data Fig. 3
Extended Data Fig. 3. Performance of the VelocityKernel compared to the PseudotimeKernel.
a. UMAP embedding of entire hematopoiesis dataset. Cell types are colored according to the original publication (HSC: hematopoietic stem cell, MK/E prog: megakaryocyte/erythrocyte progenitors, G/M progenitor: Granulocyte/Myeloid progenitor, pDC: plasmacytoid dendritic cell, cDC2: classical dendritic cells). b. Terminal states identified by the PseudotimeKernel (left) and VelocityKernel with RNA velocity (right) inferred using scVelo’s dynamical model. c. Initial state identified by the PseudotimeKernel. d. Fate probabilities towards each identified terminal state based on the PseudotimeKernel (top) and VelocityKernel (bottom). The VelocityKernel does not identify the cDC terminal state. e. Log-transformed ratio of cross-boundary correctness of cell type transitions of the PseudotimeKernel and VelocityKernel (HSC: hematopoietic stem cell, MK/E prog: megakaryocyte/erythrocyte progenitors, G/M progenitor: Granulocyte/Myeloid progenitor, pDC: plasmacytoid dendritic cell, cDC2: classical dendritic cells). Values larger than zero correspond to the PseudotimeKernel outperforming the VelocityKernel; significance was tested using one-sided Welch’s t-tests (Methods). Box plots indicate the median (center line), interquartile range (hinges), and 1.5x interquartile range (whiskers) (HSC to pDC: N=62 cells, p = 0.12; HSC to cDC: N=38 cells, p = 0.11; HSC to G/M progenitor: N=659 cells, p = 1.48 × 10−15; G/M progenitor to CD14+ monocytes: N=435 cells, p = 2.51 × 10−9; HSC to MK/E prog: N=489 cells, p = 1.88 × 10−13; MK/E prog to proerythroblast: N=513 cells, p = 1.38 × 10−9; proerythroblast to erythroblast: N=1052 cells, p = 4.93 × 10−75; erythroblast to normoblast: N=499 cells, p = 1.19 × 10−10). f. The number of identified terminal states is plotted against the number of macrostates specified. In the optimal scenario (dashed black), a new terminal state is identified for every added macrostate. The terminal state identification score (TSI) is defined by the area under a given curve relative to the optimal identification (Methods).
Extended Data Fig. 4
Extended Data Fig. 4. Developing the CytoTRACEKernel.
a. Similar to the CytoTRACE publication, we compute the CytoTRACE score by (i) calculating the number of genes expressed per cell (GEC), (ii) computing each gene’s Pearson correlation with GEC, (iii) mean-aggregating imputed expression of the top 200 correlated genes (Methods). Box plots indicate the median (center line), interquartile range (hinges), and 1.5x interquartile range (whiskers); the shown box plots are schematics. b. Force-directed layout embedding (FLE) of 22, 370 Caenorhabditis (C.) elegans muscle and mesoderm cells undergoing embryogenesis, colored by estimated embryo time (left; 130 − 830 minutes), CytoTRACE pseudotime computed using CellRank 2 (middle) and the original implementation (right). c. Quantitative comparison of the two implementations of the CytoTRACE pseudotime on bone marrow (using 10x and SmartSeq2), C. elegans embryogenesis (subsetted to ciliated neurons, hypodermis and seam, and muscle and mesoderm), and zebrafish embryogenesis. The x axis (y axis) displays Spearman’s rank correlation between CellRank 2-CytoTRACE (original CytoTRACE) and ground-truth (GT) time labels. Ground-truth labels were derived from either embryo time or stages as in b. (C. elegans and zebrafish embryogenesis) or from manually assigned maturation labels from the original CytoTRACE study (bone marrow).
Extended Data Fig. 5
Extended Data Fig. 5. The CytoTRACEKernel recovers developmental progression, and terminal and initial states faithfully.
a. Distribution of pseudotimes from the CytoTRACEKernel (left), DPT (center), and Palantir (right), stratified by embryo stage (top row) and colored according to Fig. 3a. Box plots indicate the median (center line), interquartile range (hinges), and 1.5x interquartile range (whiskers) (E0-E3: N = 4574 cells, E6-E9: N = 7368 cells, E12-E15: N = 6241 cells, E18-E21: N = 6543 cells, E24-E27: N = 6302 cells); UMAP embeddings (bottom) are colored by pseudotime. b. Terminal states (left) and initial state (right) inferred using the CytoTRACEKernel.
Extended Data Fig. 6
Extended Data Fig. 6. Developing the RealTimeKernel.
a. Force-directed layout embedding (FLE) of 165, 892 mouse embryonic fibroblasts (MEFs) reprogramming towards various endpoints during an 18-day time course, colored according to modified original annotations (IPS: induced pluripotent stem; left) or sequencing time points (right). Dotted (solid) circles indicate known initial (terminal) states. b. FLE showing simulated random walks from day 0 cells without (left; corresponds to WOT) and with (right; corresponds to the RealTimeKernel) intra-time point transitions; black (yellow) dots denote a random walk’s start (end); green ticks (red crosses) indicate known terminal states that are (are not) explored by random walks. c. Initial state identified by the RealTimeKernel. d. Evaluation of the effect of thresholding the transition matrix in the RealTimeKernel. Each dot corresponds to one cell’s fate probability towards one of four terminal states, computed with thresholding (x axis) and without thresholding (y axis). The color coding is in agreement with a.e. Identification of terminal states with increasing number of macrostates using the VelocityKernel (CR 1; blue) or RealTimeKernel (CR2; orange).
Extended Data Fig. 7
Extended Data Fig. 7. The RealTimeKernel models fate decisions on a continuous domain.
a. Force-directed layout embedding (FLE) of 165, 892 mouse embryonic fibroblasts (MEFs) reprogramming towards various endpoints during an 18-day time course, colored according to modified original annotations (IPS: induced pluripotent stem; left) or sequencing time points (right). Dotted (solid) circles indicate known initial (terminal) states. b,c. Violin plots showing pseudotime distribution for each of 36 experimental time points, using CellRank 2’s real-time-informed pseudotime (b.), DPT (c., left), or Palantir (c., right) (Methods). Box plots indicate the median (center line), interquartile range (hinges), and whiskers at 1.5x interquartile range. c. DPT (center), or Palantir (right) (Day 0: N = 4556 cells, Day 0.5: N = 3449 cells, Day 1: N = 3648 cells, Day 1.5: N = 1956 cells, Day 2: N = 6981 cells, Day 2.5: N = 6734 cells, Day 3: N = 6777 cells, Day 3.5: N = 7355 cells, Day 4: N = 8962 cells, Day 4.5: N = 7127 cells, Day 5: N = 7227 cells, Day 5.5: N = 6550 cells, Day 6: N = 8422 cells, Day 6.5: N = 3111 cells, Day 7: N = 6507 cells, Day 7.5: N = 5061 cells, Day 8: N = 3815 cells, Day 8.25: N = 3829 cells, Day 8.5: N = 3573 cells, Day 8.75: N = 3088 cells, Day 9: N = 2982 cells, Day 9.5: N = 2266 cells, Day 10: N = 2051 cells, Day 10.5: N = 1941 cells, Day 11: N = 2238 cells, Day 11.5: N = 2164 cells, Day 12: N = 2429 cells, Day 12.5: N = 2253 cells, Day 13: N = 2145 cells, Day 13.5: N = 2034 cells, Day 14: N = 3758 cells, Day 14.5: N = 2723 cells, Day 15: N = 3717 cells, Day 15.5: N = 4851 cells, Day 16: N = 3422 cells, Day 16.5: N = 4645 cells, Day 17: N = 3678 cells, Day 17.5: N = 4068 cells, Day 18: N = 3799 cells). d-g. Cell-specific fate change over pseudotime (RealTimeKernel, left) or experimental time (WOT, right) for the IPS (d.), neural (e.), stromal (f.), and trophoblast lineage (g.). For the RealTimeKernel, dashed vertical lines denote the mean pseudotime over all cells from a given experimental time point, recapitulating the correct ordering from b.
Extended Data Fig. 8
Extended Data Fig. 8. Initial and terminal state identification of pharyngeal endoderm development.
a. UMAP embedding of pharyngeal endoderm development dataset (left) and identified initial state population (right). Cells are colored according to cell types identified in the original study. b. Identified number of terminal states with increasing number of macrostates using the full pharyngeal endoderm development dataset. c. UMAP embedding of subsetted pharyngeal endoderm dataset (right) and identified initial state (right); cells are colored according to the original study. d. Same as b. but for the subsetted case.
Extended Data Fig. 9
Extended Data Fig. 9. Putative mTEC progenitors.
a. UMAP embedding of subsetted pharyngeal endoderm dataset; cells are colored according to the original study. b. The fate probabilities towards each terminal state are estimated using the RealTimeKernel. c. A cluster of putative mTEC progenitors is identified by cells with fate probabilities towards mTEC larger than 0.5. d. UMAP embedding colored by WOT’s pullback at E10.5 clipped to the 99 percentile. e. Gene ranking of potential mTEC drivers based on WOT’s pullback distribution at E11.5, compared to the gene ranking based on the pullback at E10.5, as shown in Fig. 4f. f. Gene ranking when performing classical differential expression analysis on clusters ‘mTEC progenitors’ and ‘Other progenitors’ as shown in c.
Extended Data Fig. 10
Extended Data Fig. 10. Terminal state analysis for metabolically labeled intestinal organoids.
a. UMAP embedding of intestinal cells colored according to their cell type (TA cells: transit-amplifying cells) according to the original publication; black arrows indicate the known differentiation hierarchy. b. UMAP embedding highlighting terminal states identified with CellRank 1. c. Terminal state purity resulting from our metabolic-labeling-based vector field (CellRank 2) or classical RNA velocity (Cellrank 1). d. Terminal state identification using either CellRank 1 (CR 1) or CellRank 2 (CR 2) compared to an optimal identification (Optimal ident.) strategy. e. UMAP embedding highlighting terminal states identified by dynamo. f. The ranking score metric for each method and terminal state. The metric quantifies the degree of optimality of a gene ranking compared to an optimal ranking. Dynamo only identified the trajectory leading up to enterocytes.

References

    1. Haghverdi L, Büttner M, Wolf FA, Buettner F, Theis FJ. Diffusion pseudotime robustly reconstructs lineage branching. Nat. Methods. 2016;13:845–848. doi: 10.1038/nmeth.3971. - DOI - PubMed
    1. Qiu X, et al. Reversed graph embedding resolves complex single-cell trajectories. Nat. Methods. 2017;14:979–982. doi: 10.1038/nmeth.4402. - DOI - PMC - PubMed
    1. Street, K. et al. Slingshot: cell lineage and pseudotime inference for single-cell transcriptomics. BMC Genomics19, 477 (2018). - PMC - PubMed
    1. Wolf, F. A. et al. PAGA: graph abstraction reconciles clustering with trajectory inference through a topology preserving map of single cells. Genome Biol.20, 59 (2019). - PMC - PubMed
    1. Setty M, et al. Characterization of cell fate probabilities in single-cell data with Palantir. Nat. Biotechnol. 2019;37:451–460. doi: 10.1038/s41587-019-0068-4. - DOI - PMC - PubMed

LinkOut - more resources