. 2024 Jul;27(7):1309-1317.
doi: 10.1038/s41593-024-01676-6. Epub 2024 Jun 13.

Fear learning induces synaptic potentiation between engram neurons in the rat lateral amygdala

Affiliations

Fear learning induces synaptic potentiation between engram neurons in the rat lateral amygdala

Marios Abatis et al. Nat Neurosci. 2024 Jul.

Abstract

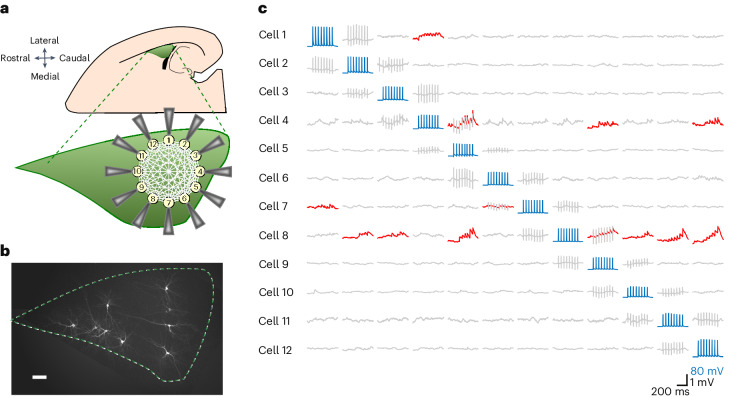
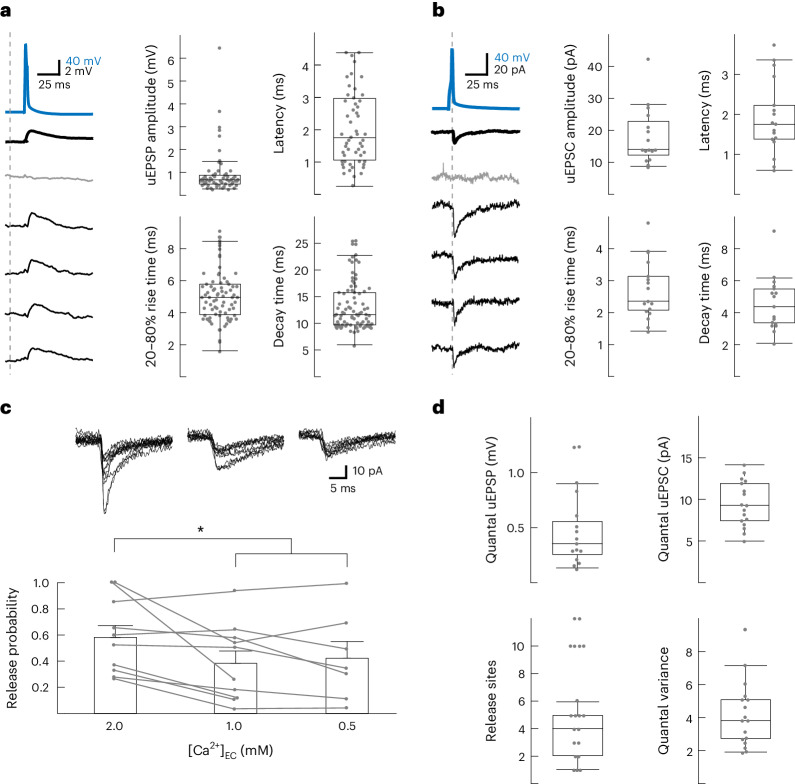
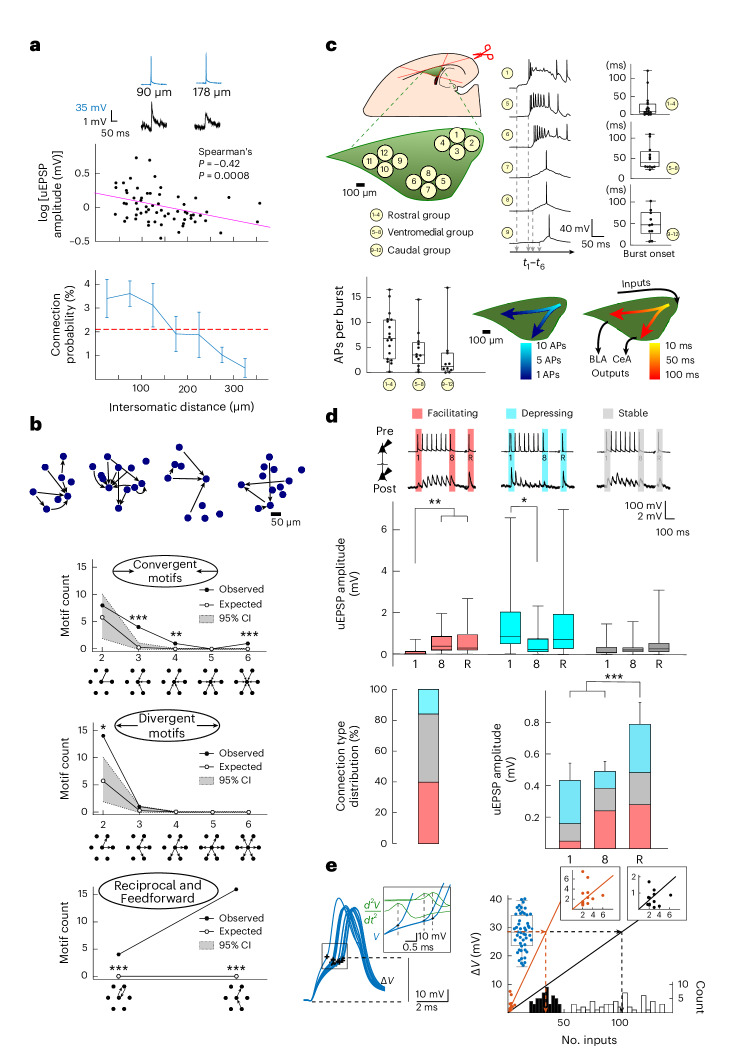
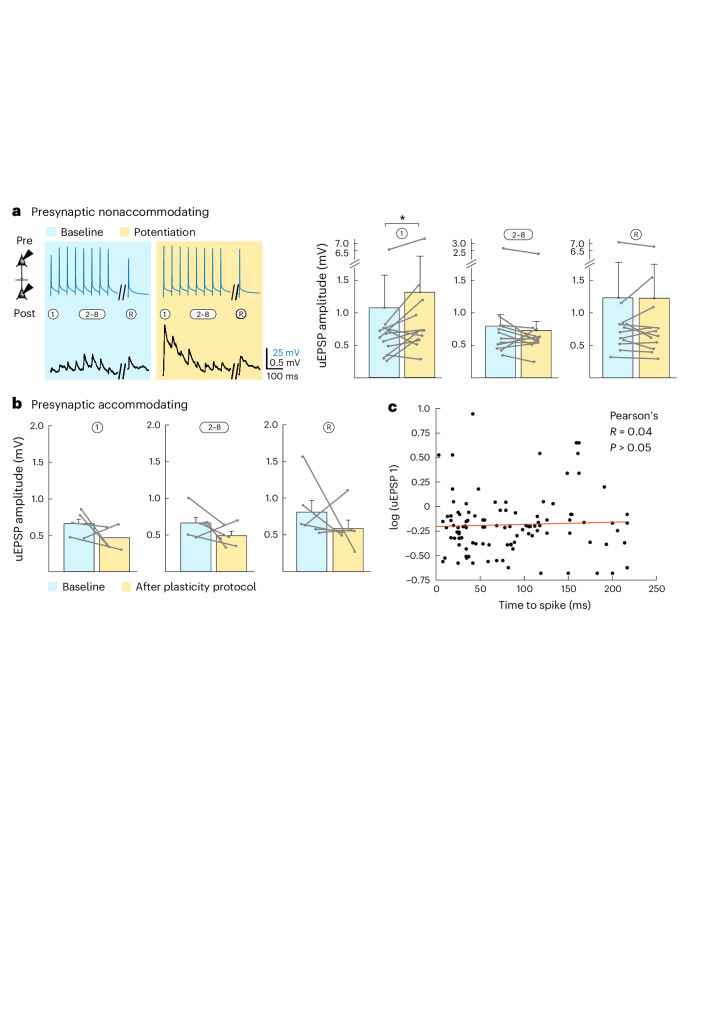
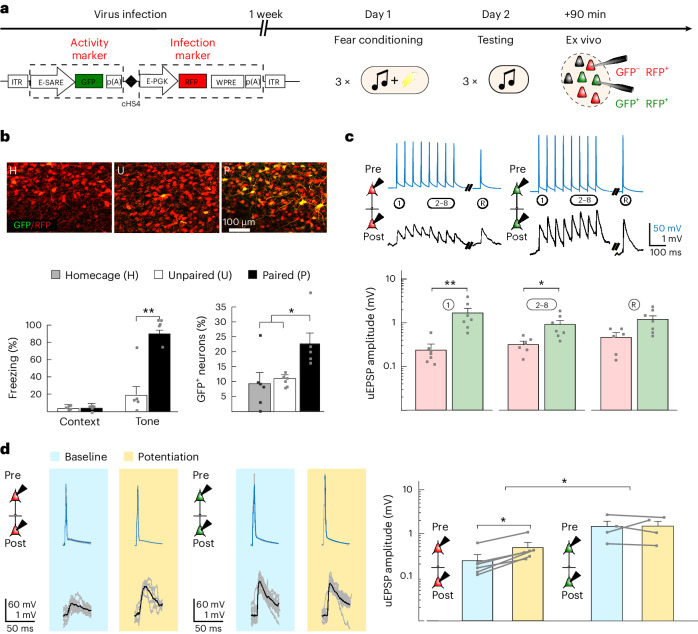
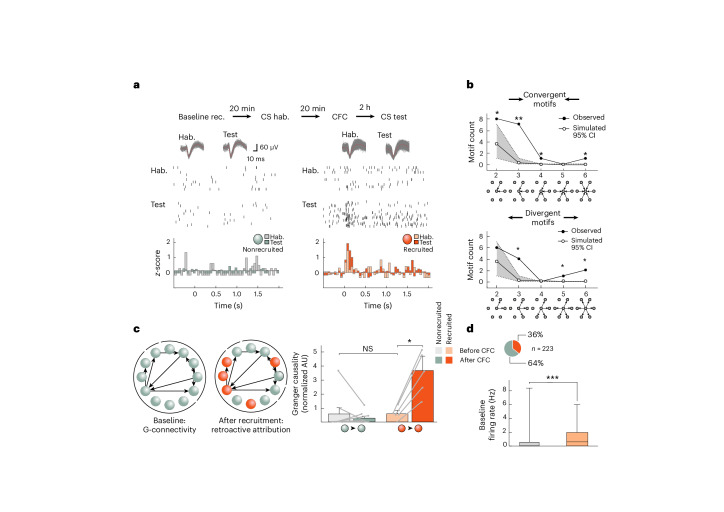
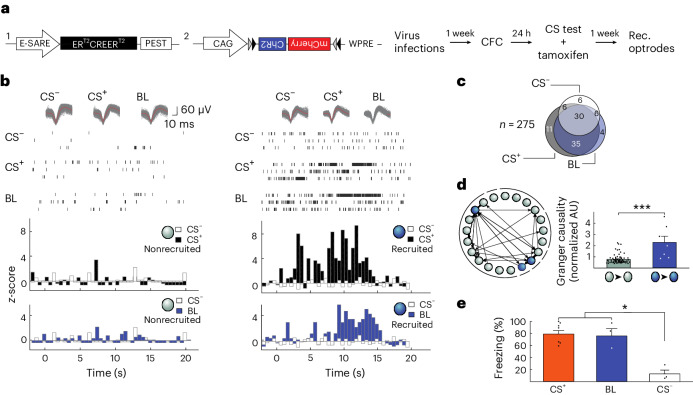
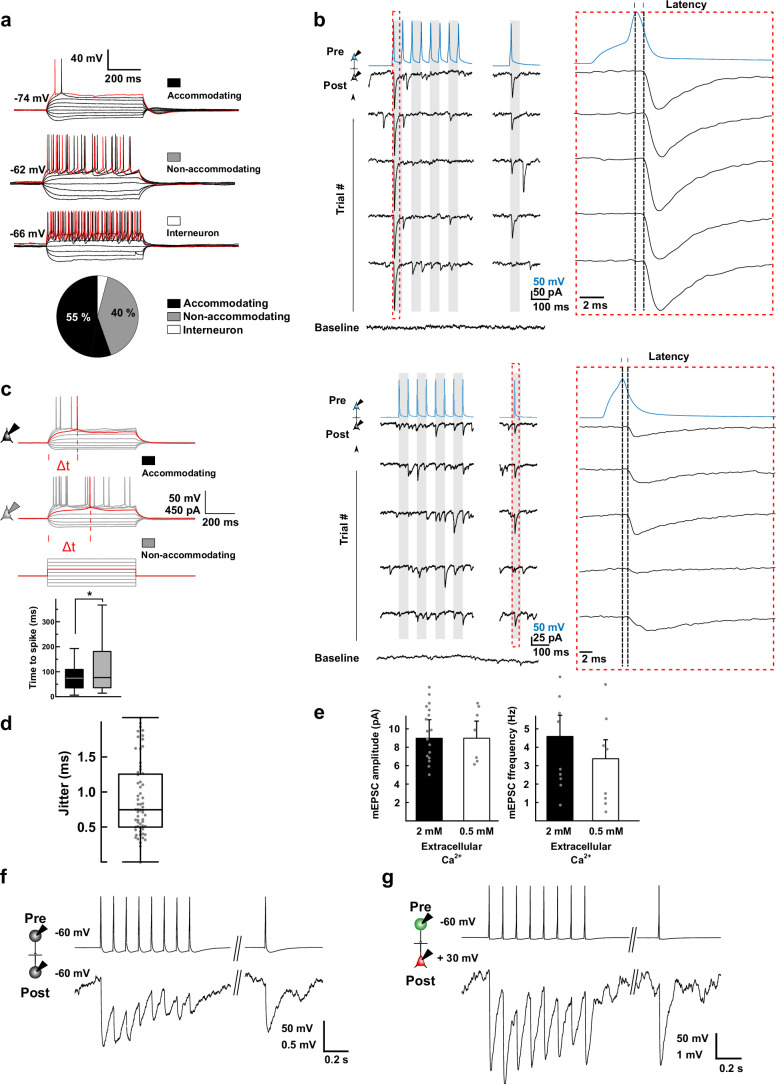
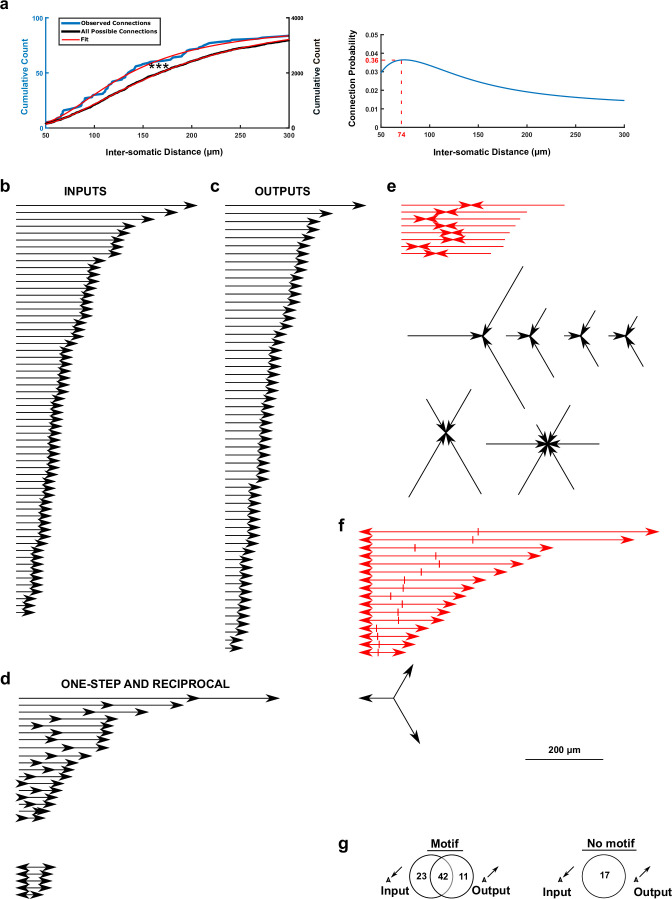
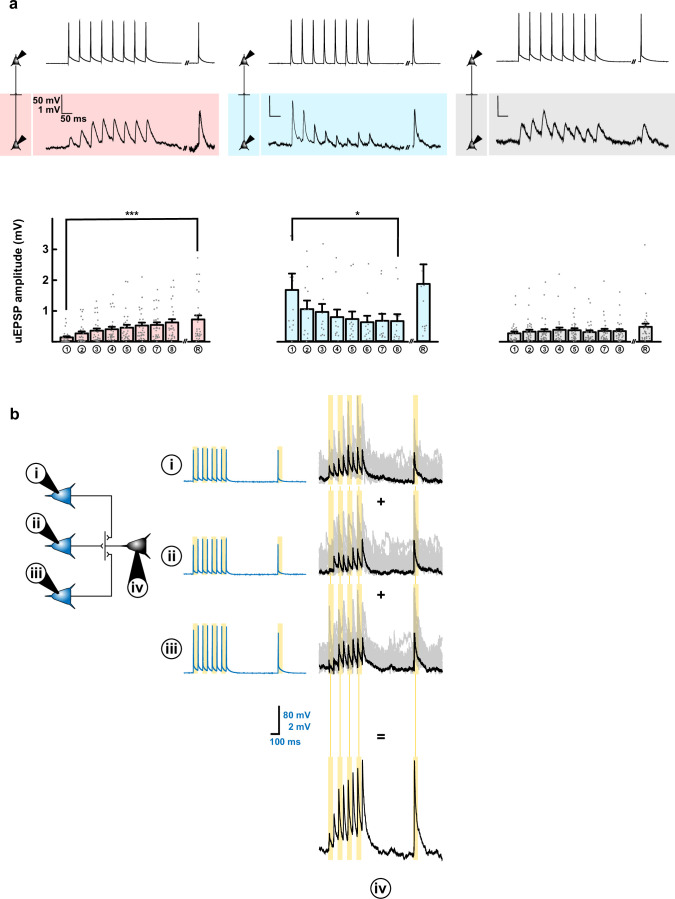
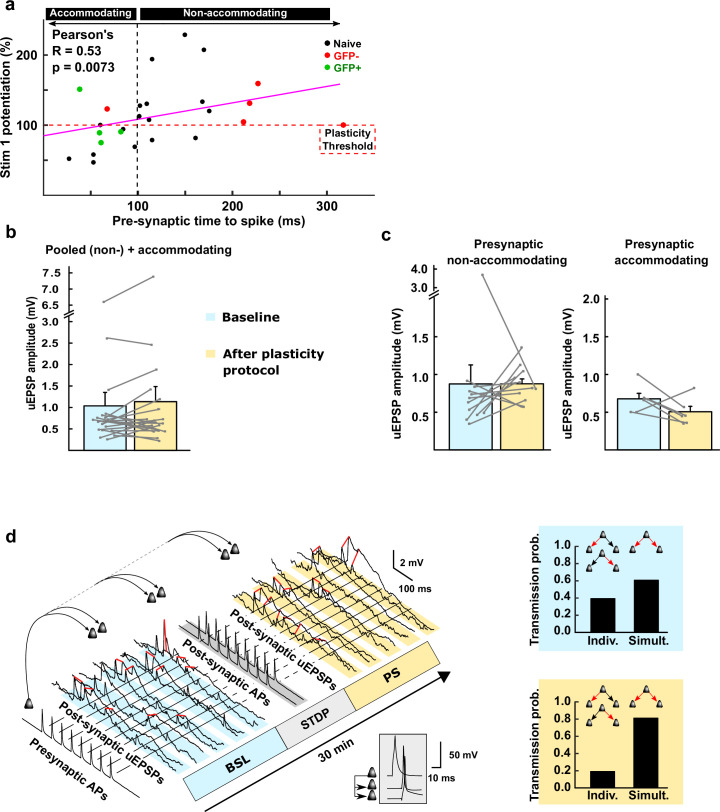
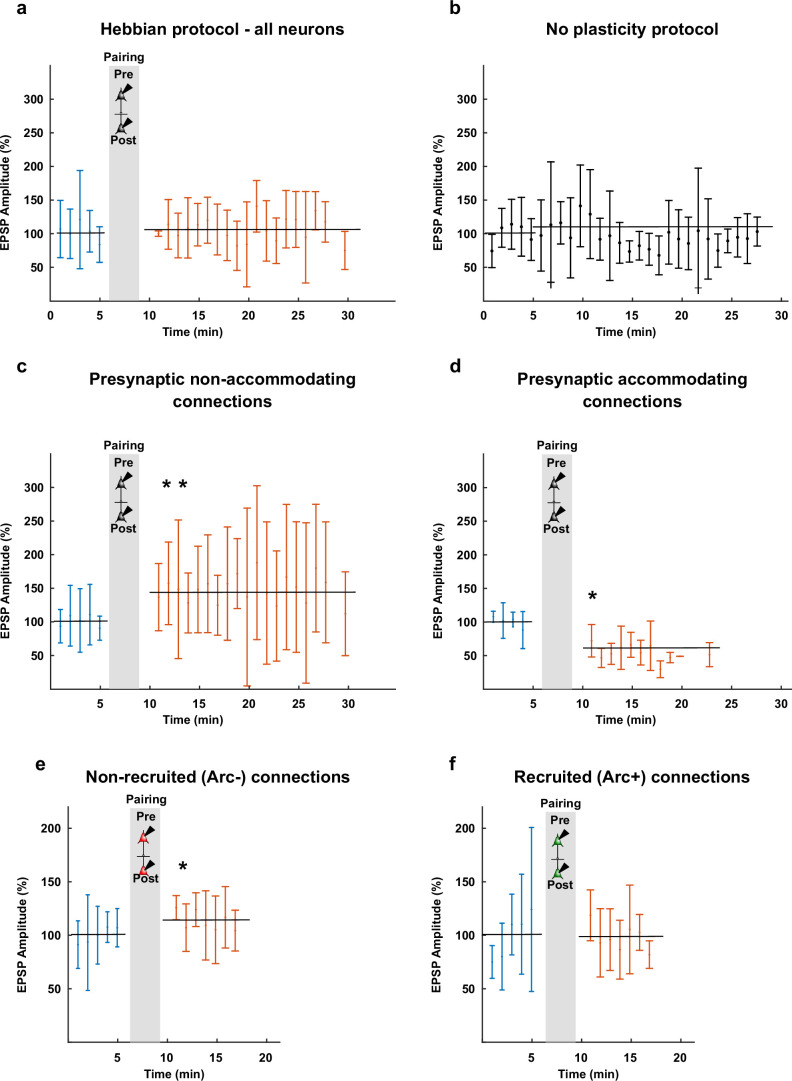
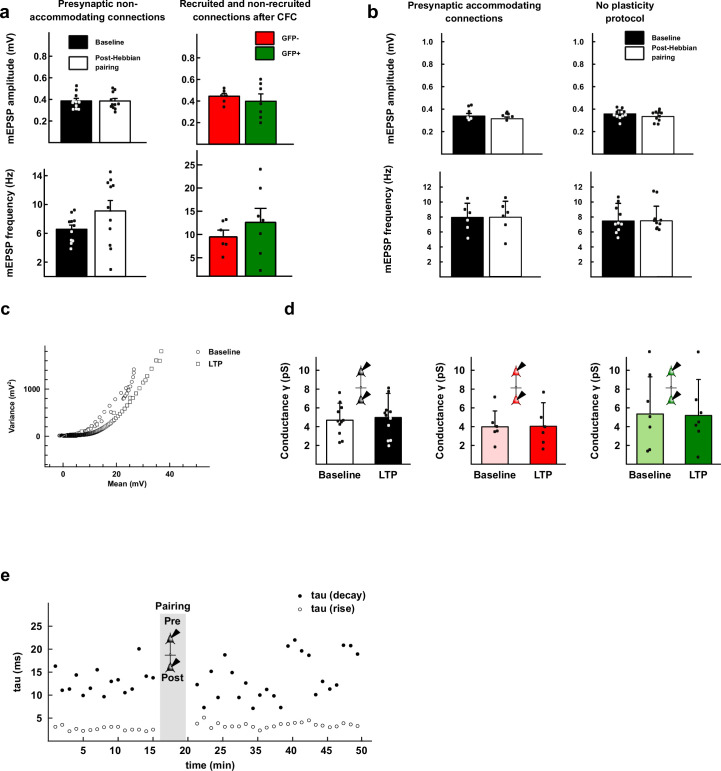
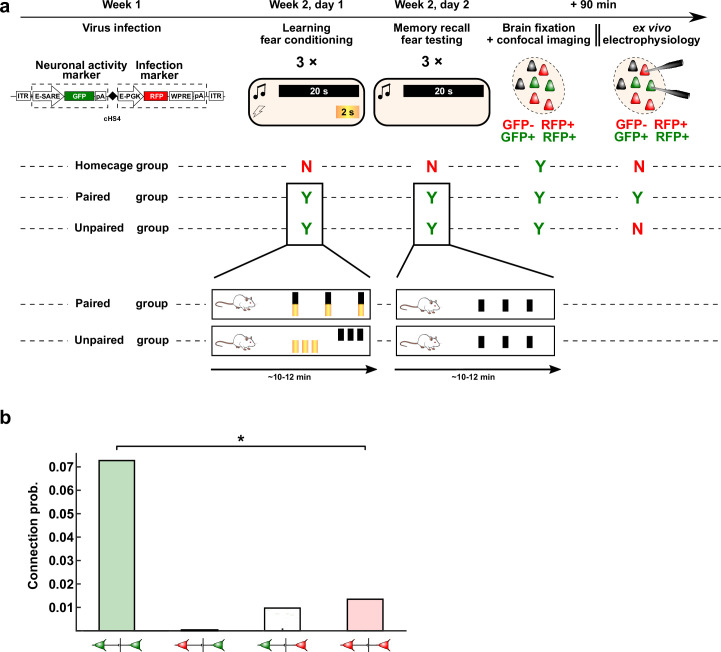
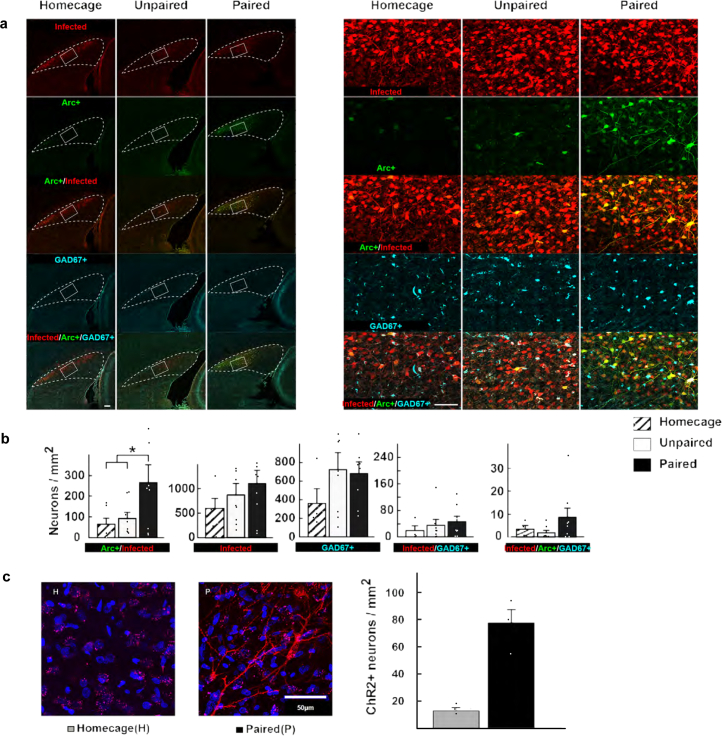
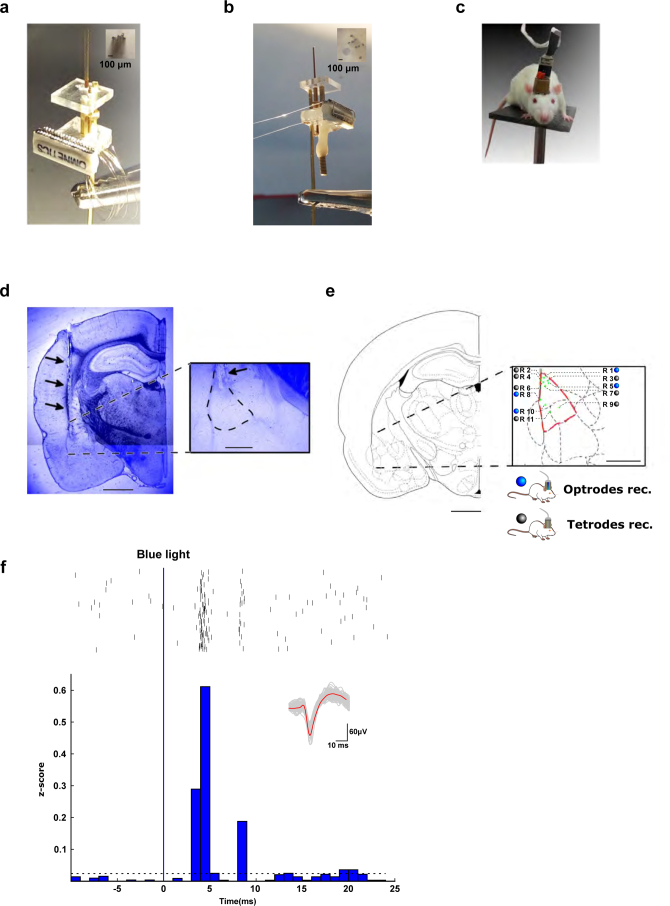
The lateral amygdala (LA) encodes fear memories by potentiating sensory inputs associated with threats and, in the process, recruits 10-30% of its neurons per fear memory engram. However, how the local network within the LA processes this information and whether it also plays a role in storing it are still largely unknown. Here, using ex vivo 12-patch-clamp and in vivo 32-electrode electrophysiological recordings in the LA of fear-conditioned rats, in combination with activity-dependent fluorescent and optogenetic tagging and recall, we identified a sparsely connected network between principal LA neurons that is organized in clusters. Fear conditioning specifically causes potentiation of synaptic connections between learning-recruited neurons. These findings of synaptic plasticity in an autoassociative excitatory network of the LA may suggest a basic principle through which a small number of pyramidal neurons could encode a large number of memories.


Conflict of interest statement

The authors declare no competing interests.

Figures

Fig. 1
Fig. 1. Schematic view of 12 whole-cell patch-clamp recordings in acute horizontal brain slices and post hoc fluorescent biocytin staining.
a, The preparation involved half-hemisphere horizontal slices from a 2- to 3-week-old rat that contained the LA (green), which is easily recognizable by being bordered by the external capsule on the lateral border and the hippocampus and the lateral ventricle on the caudal border. After gaining whole-cell access to up to 12 neurons at a time, electrophysiological recordings were performed. b, Post hoc staining of ten biocytin-labeled neurons in the LA (n = 90 slices). Scale bar, 100 μm. c, A 20-Hz train of eight APs, in addition to a follow-up single AP (not shown), were elicited successively in each recorded neuron (blue traces) while recording spontaneous activity from the remaining neurons. Time-locked evoked responses (red traces) indicated a direct synaptic connection. Columns showing sequentially evoked APs (in blue) in cells 1–12 by injections of a 2 nA 3 ms–1 current and simultaneous membrane potentials (in gray) of nonstimulated cells. uEPSPs (in red) were averaged over 15 trials recorded in 14- to 19-day-old Wistar rats of both sexes.
Fig. 2
Fig. 2. Functional connectivity within the LA.
a, Left: Example of a presynaptic AP (blue) evoking a uEPSP (bold = 15-trial average, including failures) with individual traces (one failure in gray and four successes). Right: uEPSP characteristics (n = 81 connections), excluding failures. Centers represent medians, and whiskers represent 1.5× interquartile range. b, As in a but with unitary evoked postsynaptic current (uEPSC). Centers represent medians, and whiskers represent 1.5× interquartile range. c, Release probability as a function of extracellular Ca2+ concentration. Top: Ten example traces per connection. Data were analyzed by repeated measures analysis of variance (RM-ANOVA), F2,15 = 5.411, P = 0.017 and Tukey corrected *P = 0.033 or *P = 0.0349 for 2 mM versus 1 mM and 0.5 mM, respectively. Bar graphs show mean + s.e.m.; [Ca2+]EC, extracellular Ca2+ concentration d, Quantal parameters extracted based on a simple binomial model (Methods). Centers represent medians, and whiskers represent 1.5× interquartile range; N = 85 rats; Recordings were acquired in 14- to 19-day-old Wistar rats of both sexes.
Fig. 3
Fig. 3. LA network organization and intra-LA signal propagation.
a, uEPSP amplitude and connection probability decrease over distance. Inset: Examples of AP–uEPSP pairs (637 neurons, 89 connections, 34 rats; P = 0.0008). b, Top: Diverse examples of motifs with preserved cell positions. Bottom: observed (black circles) and expected (white circles) connectivity motifs (100,000 Monte Carlo simulations; Methods and Supplementary Note 3; gray, 95% confidence interval (95% CI)); *, **, and *** represent outside the 95%, 99% and 99.9% confidence intervals around the simulated values (line connecting the white dots), respectively. c, Top: Recordings in three LA (green) regions, with example bursting activity and corresponding averaged burst onsets per group of pipettes (n = 6 experiments with 18, 12 and 10 connections in clusters 1–4, 5–8 and 9–12, respectively). Bottom left: APs per burst per region. Bottom right: overlays of APs per burst and burst onset (Supplementary Note 4). Box plots indicate mean (middle line), 25% and 75% quartiles and maximal and minimal values (whiskers). BLA, basolateral amygdala; CeA, central amygdala. t1t6, times of burst onsets for the samples. d, Top: Examples of facilitating, depressing and stable connections (n = 29, 12 and 41, respectively) and uEPSP amplitudes (average of 15 traces including failures; data were analyzed by RM-ANOVA; facilitating: F2,56 = 24, **P = 0.0045 (stimulus 1 versus stimulus 8 or 0.0015 (stimulus 1 versus stimulus 9) after Bonferroni correction); depressing: F2,22 = 7, *P = 0.032 Bonferroni corrected; stable: F2,93 = 2; P > 0.05). Box plots indicate mean (middle line), 25% and 75% quartiles and maximal and minimal values (whiskers). Bottom left: Connection type distribution. Bottom right: Average uEPSP depolarization per input, with relative contribution of facilitating phenotypes (RM-ANOVA; F2,144 = 11, P < 0.0001; ***P = 0.0002 and ***P = 0.009 for stimulus 9 versus stimulus 1 and versus stimulus 8, respectively, after Bonferroni correction; n = summed connections for 1, 2–8 and recovery (R) uEPSP from the top). Bars show mean ± s.e.m. e, Left: Voltage threshold analysis for AP initiation (ramp protocol; black, AP threshold). Inset: Calculation of time of AP initiation based on apex of second derivative. Right: Evoked uEPSP amplitudes against the number of inputs of convergent motifs (black circles, uEPSP1; red circles, uEPSPR). Insets: Magnification of the origin. A linear regression line was plotted from the summed convergent motif uEPSPs. Mean AP threshold values (blue circles) are projected (dashed line) on either regression line to construct the histogram distribution of inputs required to trigger a postsynaptic AP with either uEPSP1 (black) or uEPSPR (red); see Supplementary Note 5. Data are from the connections presented in d. Upper and lower limits of the boxes represent 75% and 25% values, with the whiskers extending to 100% and 0%. The middle lines represent the medians. Recordings were made in 14- to 19-day-old Wistar rats of both sexes.
Fig. 4
Fig. 4. In vitro synaptic plasticity between LA neurons.
a, In vitro-induced potentiation between connections that involve presynaptic nonaccommodating neurons before (blue) and after (yellow) the Hebbian association protocol. Left: Example trace of averaged AP-evoked (top) uEPSPs (bottom) for one connection taken 5 min before and 10 min after the induction protocol. Right: Average normalized amplitudes of 1, 2–8 and R uEPSPs excluding failures. Data were analyzed by two-tailed paired Wilcoxon signed-rank test (uEPSP 1: W = 10, *P = 0.042; uEPSP 2–8: W = 20, P = 0.303; uEPSP R: W = 32, P = 1; all with Bonferroni correction for multiple comparisons; n = 11 connections). Data are shown as mean ± s.e.m. b, Average normalized amplitudes of 1, 2–8 and R uEPSPs, excluding failures. Unlike connections with a presynaptic nonaccommodating neuron, connections with a presynaptic accommodating neuron did not potentiate. Data were analyzed by two-tailed, paired Wilcoxon signed-rank test (uEPSP 1: W = –13, P = 0.2188; uEPSP 2–8: W = –14, P = 0.1875; uEPSP R: W = –19, P = 0.0625; all Bonferroni corrected, n = 6 connections). Data are shown as mean ± s.e.m. c, Synaptic strength could not be predicted by presynaptic time to spike, as this did not correlate with uEPSP 1 amplitude before the induction of plasticity. This suggests that before fear conditioning, neurons that are prime candidates to be recruited into the fear memory trace do not have stronger local connectivity. Recordings were made in 14- to 19-day-old Wistar rats of both sexes.
Fig. 5
Fig. 5. CFC (in vivo)-induced ex vivo potentiation.
a, Virus infection protocol with stable (RFP) and dGFP (t1/2 = 2 h) under the E-SARE promoter, followed by CFC after 1 week (day 1), memory recall testing (day 2) and, within 90 min, brain extraction for imaging or electrophysiology. b, Top: GFP and RFP expression in LA slices of rats exposed to homecage or unpaired or paired tone–shock presentations. Bottom left: Freezing in response to the CS+ (one-tailed Mann–Whitney U-test; U = 0, **P = 0.0079; n = 5 rats). Bottom right: GFP+ neurons as a percentage of infected (RFP+) neurons (one-way ANOVA; F2,14 = 4.614, *P = 0.0075 and *P = 0.02 for paired versus unpaired and homecage after Bonferroni correction; n = 5 GFP+ neurons per slice for paired and n = 6 for unpaired and homecage conditions). c, Top: Example recordings from GFPGFP (red) and GFP+GFP+ (green) connections. Bottom: Average amplitudes of uEPSPs (1, 2–8 and R) in GFPGFP (red; n = 6) and GFP+GFP+ (green; n = 7) connections. Data were analyzed by two-tailed Mann–Whitney U-test (uEPSP1: U = 1, **P = 0.0051; uEPSP2–8: U = 3, *P = 0.017; uEPSPR: U = 7, P = 0.0653). d, uEPSP1 example recordings and averaged amplitudes for GFPGFP (left; one-tailed paired Wilcoxon signed-rank test with Bonferroni correction; W = 0, P = 0.031, n = 6 connections) and GFP+GFP+ (right; W = 4, P > 0.05, n = 4 connections) at baseline (blue) and after the Hebbian protocol (yellow). Bar graphs show mean + s.e.m. Recordings were made in 5- to 6-week-old Sprague–Dawley rats of both sexes.
Fig. 6
Fig. 6. In vivo connections and plasticity between LA neurons.
a, In vivo recordings (rec.) of neuronal spiking before (light colors) and 6 h after (dark colors) CFC (n = 7 rats). Top: Examples of neuronal spiking and CS+-evoked z-scores (after CFC) of recruited (orange) and nonrecruited neurons (gray); hab., habituation. b, Distributions of simulated (white, Monte Carlo; see Methods and Supplementary Note 3) and observed (black) connectivity patterns. The gray area around the central line indicating simulated values represents the 95% confidence interval. Single asterisks and double asterisks indicate observed values outside the 95% and 99% confidence intervals, respectively. c, Left: Connectivity diagrams before and after CFC. Right: Granger causality strength (normalized) for nonrecruited (n = 8) and recruited (n = 5) connections. Data were analyzed by one-tailed paired Wilcoxon signed-rank tests (nonrecruited: W = –3, P > 0.05; recruited: W = 15, *P < 0.05 and P = 0.06 (not significant (NS)) after Bonferroni correction for multiple comparisons). Note the similar causality strength before CFC between nonrecruited and recruited neurons. Data were analyzed by one-tailed Mann–Whitney U-test; U = 10). Bars show mean ± s.e.m. d, Top: Distribution of neuronal recruitment. Bottom: Box plot (median, middle line; 25% and 75% quartiles; whiskers, maximal and minimal values) showing a higher baseline firing rate in future recruited neurons (red). Data were analyzed by two-tailed Student’s t-test (t = 7.27, d.f. = 221, n = 143 (nonrecruited) and 80 (future-recruited) neurons, ***P = 0.0002). Recordings were acquired in 5- to 6-week-old Sprague–Dawley rats of both sexes.
Fig. 7
Fig. 7. Activating the optogenetically tagged fear memory engram induces freezing behavior.
a, Viral constructs and the CFC protocol (Methods) of experiments in bd. b, Examples of neuronal spiking and z-scores in response to the CS+ (black) and BL (blue). c, Venn diagram of neurons responding to the CS+, BL and CS(5 kHz tone not paired to the US, see Methods). d, Left: Connectivity diagram. Right: Connection strength as a function of recruitment (n = 67 (black) and 7 (blue) connections; U = 44.5, ***P < 0.001; two-sided Mann–Whitney U-test). Bars show mean ± s.e.m. e, Freezing levels after CFC in response to the CS+, BL and CS (mixed-model ANOVA, F2,4 = 21.15, *P = 0.0075 and *P = 0.0104 or 0.0196 for CS versus CS+ or BL, respectively, after Bonferroni correction); n = 7 (CS+) or n = 3 (BL and CS) rats. Bars show mean + s.e.m. Recordings were acquired in 5- to 6-week-old Sprague–Dawley rats of both sexes.
Extended Data Fig. 1
Extended Data Fig. 1. Electrophysiological characterization of neurons and connections.
a, Examples of neuronal response patterns to 400 ms square-pulse current injection steps (50 pA), with pie chart for distribution of recorded neuron types (n = 637 neurons). Red trace represents the first current injection that triggered an action potential. b, Example of voltage-clamp recording with a confirmed connection between presynaptic (blue) and postsynaptic (black) neuron that was depressing (top) or facilitating (bottom); APs were elicited presynaptically (blue) and unitary excitatory postsynaptic currents (EPSCs) recorded postsynaptically (black; 5 example traces are shown); red box inset: time-scale expansion showing that uEPSC selection was time-locked to presynaptic AP peak, with a fixed latency between 0.5 to 4.5 ms. c, The time to spike was used as a measure of the degree of accommodation for recorded neurons, measured as the delay (Δt) to observe the first action potential upon application of minimal current injection (400 ms square pulse); Time to spike of shorter duration for accommodating neurons (top example trace) when compared to non-accommodating neurons (bottom example trace). Bar graph, Time to spike was shorter for accommodating when compared to non-accommodating neurons; Student’s t-test with Welch correction. t = -2.0386, df = 53.205, P = 0.04647 (*), n = 40 vs 59 neurons. Box plot indicates mean (central line), 25 and 75% interquartile, and maximum and minimum values (whiskers). d, Jitter for monosynaptic connections (n = 81). Box plot mean represents the median and whiskers represent the inter-quartile range x 1.5. e, External Ca2+ concentration does not influence mEPSC amplitude, whereas EPSC frequency tends to decrease with lower [Ca2+], indicating presynaptic modulation of vesicle release. n = 17 and 8 connections for 2 mM and 0.5 mM extacellular Ca2+, respectively. f, Example trace of one of 21 inhibitory neurons that were found in naïve slices (from rats not subjected to fear conditioning) exhibiting high spiking frequencies (>30 Hz) and high cell membrane resistances (1140 ± 114 MΩ). 12 of these made local connections, all of which were inhibitory, as shown as amplitude IPSPs, thus confirming the validity of these electrophysiological criteria to identify local interneurons. Current clamp, with baseline at -60 mV for both pre- and postsynaptic neurons. Average of 15 traces. g, Example trace of one out of 18 inhibitory neurons found among CFC-recruited Arc+ (GFP+) neurons, (same criteria as for f), 4 of these made local connections with non-recruited pyramidal neurons; all of these were again inhibitory. Current clamp, with baseline at -60 mV for the presynaptic neuron and +30 mV for the postsynaptic neuron (to increase observed inhibitory postsynaptic potential amplitude). Average of 15 traces.
Extended Data Fig. 2
Extended Data Fig. 2. Inventory of connection distances categorized by motif.
a, Left: Cumulative count of inter-somatic distances of observed (blue) and all possible connections (black). The respective fits (red) indicate a statistically significant left-shift for the inter-somatic distances of the observed connections (Kolmogorov-Smirnov test, D = 0.42, P < 0.0001 (***)). Right: The ratio of the derivatives yielded the connection probability as a function of inter-somatic distance, revealing a high connectivity (>5%) for cell bodies within 100 µm. b-f, List of all observed connection distances (connection distance includes arrow tip) for b, single inputs, c, single outputs, d, one-step feed-forward (top) and reciprocal (bottom) motifs, e, convergent input motifs and f, divergent outputs motifs. For the red-marked motifs, the summed distance of double-convergent motifs (295 ± 20 μm) is similar to the summed distance of double-divergent motifs (335 ± 48 µm; Two-sided Welch two-sample t-test, t19.4 = 0.8, P = 0.4493; ± SD), but the variance of the summed distance is an order of magnitude lower for double-convergent motifs, at 3241 μm2, compared to that of double-divergent motifs, at 37145 μm2 (Bartlett test of homogeneity of variances, K2 = 9, P = 0.027). This suggests that convergent inputs define a local-cluster limit (within a ~ 300 µm radius) for local processing, whereas divergent outputs can be found both locally and distantly for processing of both intra- and inter-cluster information. Scale bar applies to b-f. g, Venn diagrams depicting single inputs and single outputs that were part (left) or not part (right) of non-convergent respectively non-divergent motifs. In total, more than >75% (=(23 + 42 + 11) / (23 + 42 + 11 + 17)) connections were part of a motif.
Extended Data Fig. 3
Extended Data Fig. 3. Averaged amplitudes and stability of facilitating, depressing and stable connections, and input summation at LA-LA synapses.
a, Connections could be characterized as facilitating (red), depressing (blue) or stable (grey). Top, examples for each connection type, with each example displaying the respective recordings of presynaptic action potentials and postsynaptic uEPSPs (average of 15 sweeps). Bottom, Averaged uEPSP amplitudes for 1st through 8th and ‘recovery’ stimuli; for n = 29 facilitating, 12 depressing and 41 stable connections providing additional information to Fig. 3d. Friedman test on repeated measures with Bonferroni post-hoc comparisons. * P = 0.019, *** P < 0.0001. Bars are means + SEM. b, Example of input summation at a triple convergent motif. Three presynaptic neurons (blue traces and blue cells; numbered i, ii and iii) converge onto one postsynaptic neuron (black traces and black cell; numbered iv). Individual presynaptic stimulation of each blue cell (i-iii) at 20 Hz leads to a postsynaptic facilitating response (iv). The arithmetic summation (+signs) of all black responses leads to (=sign) the summed EPSP response that results from stimulating all connections simultaneously – see. This convergent motif is an example of the summed EPSPs that are used in Fig. 3e (right panel; black and red dots).
Extended Data Fig. 4
Extended Data Fig. 4. Synaptic potentiation in different types of connections.
a, Pre-synaptic non-accommodating neurons (characterized by their long time to spike, see M&M and Extended Data Fig. 1c) were more likely to develop a potentiation of uEPSP1 (Stim1 potentiation) upon application of the Hebbian plasticity induction protocol; naïve (black) connections refer to Fig. 4a, whereas green and red connections refer to Fig. 5a–d, with green dots reflecting uEPSP1 amplitude in CFC-recruited (GFP-positive) and red dots in non-recruited neurons (GFP-negative). b, Pooling uEPSP1 amplitudes of neuronal pairs with either a presynaptic non-accommodating or accommodating neurons did not reveal potentiation (Two-tailed Wilcoxon signed-rank test, W = 71, P > 0.05, n = 20). Error bar is mean + sem. c, Left: there was no change in overall uEPSP amplitude across the stimulus train (uEPSP1-8 through uEPSPR, two-sided paired Student’s t-test, t5 = 0.8, P > 0.05, n = 12 connections with a pre-synaptic non-accommodating neuron), suggesting that a redistribution of synaptic efficacy – a presynaptic mechanism – explains the potentiation of uEPSP1; right: overall uEPSP amplitude after Hebbian pairing for connections with a pre-synaptic accommodating neuron (uEPSP1-8 through uEPSPR, paired Student’s t-test, t5 = 1.7, P > 0.05, n = 6). d, A double-output motif subjected to the Hebbian protocol for inducing synaptic plasticity. Left, uEPSPs recorded from the double-output motif, before (blue) and after (yellow) Hebbian pre- and post-synaptic pairing (grey, zoomed inset) of 10 pre- and post-synaptic (within 10 ms delay) APs at 30 Hz, repeated 15 times, with an inter-trial interval of 10 s (as used in Fig. 4a); pairing; uEPSPs were considered to occur either simultaneously (‘Simult.’; both connections; red lines) or individually (‘Indiv.’; exactly one connection, but not both) between the two connections of the motif. Right, the normalized probability for simultaneous EPSPs was higher after Hebbian pairing, when compared to individual release, indicating synchronization of neuronal activity.
Extended Data Fig. 5
Extended Data Fig. 5. Long-term measurements of synaptic strength.
a, Average (n = 20) long term recording of evoked EPSP amplitudes (normalized to baseline) before (blue) and after (red) induction of changes in synaptic strength through the Hebbian pre- and postsynaptic pairing (gray). No changes were observed (1 data point = 1 min average for 3 samples every 20 seconds); Two-tailed Mann-Whitney U test on the five averaged values before and after the pairing, U = 12; P > 0.05, n = 20 b, Average (n = 10) long term recordings of evoked EPSC amplitudes (normalized to first 5 minutes) show that no plasticity occurs spontaneously, without the application of a Hebbian protocol; Two-tailed Mann-Whitney U test on the five averaged values before and after the pairing, U = 7; P > 0.05, n = 10. c, as in Fig. a, including only connections with a presynaptic non-accommodating neuron; here, we observed potentiation after Hebbian pre- and postsynaptic pairing; Two-tailed Mann-Whitney U test on the five averaged values before and after the pairing, U = 0; P = 0.0079 (**), n = 11 d, as in Fig. a, including only connections with a presynaptic accommodating neuron showing depression of synaptic strength. Two-tailed Mann-Whitney U test on the four values before and five averaged values after the pairing, U = 0; P = 0.0159 (*), n = 6. e, as in Fig. a, for connections not recruited after CS-US association; Two-tailed Mann-Whitney U test on the five values before and after the pairing, U = 3; P = 0.0278 (*), n = 6. f, as in Fig. a, for connections recruited after CS-US association; One-tailed Mann-Whitney U test on the five values before and after the pairing, U = 11; P > 0.05, n = 4. Error bars are s.d.
Extended Data Fig. 6
Extended Data Fig. 6. In vitro and ex vivo changes in local connection strength and probability.
a, mEPSP frequency, nor amplitude significantly changed following Hebbian association of pre- and postsynaptic activity in vitro (black and white bars) when presynaptic neurons are non-accommodating nor in recruited (green) versus non-recruited (red) neurons ex vivo, suggesting that plasticity and CFC-mediated recruitment both have a presynaptic site of expression (Two-tailed Student’s t-tests, top-left: t7 = 1.2, n = 11; bottom-left: t7 = 1.5, n = 11; top-right: t4 = 0.4, n = 7 GFP+ and 5GFP; bottom-right: t4 = 1.7, n = 7 GFP+ and 6 GFP, P > 0.05 in all cases). Bars are means + sd. b, No mEPSP amplitude or frequency changes were observed in vitro when the presynaptic cell was accommodating (n = 6) or when no plasticity induction protocol was applied (n = 10). Bars are means + sd. c, Example relationship between voltage-variance for one connection (also known as Non-stationary fluctuation analysis): the variance of the fluctuation of the decays for each EPSP in comparison to the mean is plotted as a function of the mean EPSP decay amplitude, during baseline (circles) and after Hebbian induction (squares); d, The conductance (γ) is estimated from the voltage-variance relationship for each cell during baseline and after Hebbian induction of plasticity for naïve slices (left, as in Fig. 4a; n = 11), non-recruited connections (middle, red; n = 6) and recruited connections (right, green; n = 7); Two-tailed Student’s t-test, P > 0.05. Bars are means + sd. e, Rise times (20–80%, open circles) and decay times (62%, filled circles) for all EPSPs used for non-stationary fluctuation analysis. Hebbian pre- and post- synaptic pairing affected neither rise time nor decay time. To note: although we did not find any changes in mEPSP/mEPSC characteristics after changes in synaptic strength, mEPSP/mEPSC may also originate from projections outside of the LA.
Extended Data Fig. 7
Extended Data Fig. 7. Detailed experimental outline of viral labeling of activated neurons and their connection probability following fear conditioning.
a, Protocol timeline: from virus infusion to fear conditioning and recall of the memory (testing), followed by imaging or electrophysiology 90 min later. Viral construct: bilaterally injected with glass pipettes targeting the LA. The viral construct is flanked by Inverted Terminal Repeats (ITR), expresses d2Venus under the enhanced synaptic activity response element (E-SARE) and the red fluorescent protein (RFP; FP635) under the constitutive enhanced phosphoglycerate kinase promoter (E-PGK). The woodchuck hepatitis post-transcriptional regulatory element (WPRE) enhances expression levels and is followed by a poly-adenylation (pA) signal. Behavior: Rats in the Paired group were fear conditioned by co-terminated pairing of the conditioned stimulus (CS, 20 second tone, black bars) and unconditioned stimulus (US, electric shock, yellow bars) thrice, at random intervals (from 60 s to 180 s – determined by Matlab’s rand function). The Unpaired group received 3xUS and 3xCS at the start and end of the conditioning session, respectively. Fear memory recall was tested by 3xCS presentations for both Paired and Unpaired groups. The home-cage group was not exposed to CS, US or conditioning context. Rats were sacrificed 90 min. after conditioning when GFP expression is optimal. Confocal imaging: GFP+ and RFP+ neurons were counted as memory-recall-participating and/or infected, respectively. Ex vivo electrophysiology (Paired group): multi-electrode whole-cell patch-clamp was performed on GFP+ and GFP neurons to assess connectivity and connection strength of connections recruited during memory recall. b, Connectivity was significantly higher between (recruited) GFP+-GFP+ neurons (n = 15 slices with GFP+-GFP+ connections; 49 GFP+ neurons, with 6 out of 107 possible connections) than between GFP-GFP neurons (n = 39 slices with GFP-GFP connections; 137 GFP neurons, with 5 out of 369 possible connections) (Two-sided Wilcoxon rank sum test with continuity correction, W = 378.5, P = 0.0292 (*)); however, overall connectivity calculated from all connections between recruited and non-recruited neurons was unchanged at ~2%, that is similar to connectivity in naïve homecage controls (see Fig. 3a, red-dashed line), suggesting that plasticity does not increase the total number of connections within the LA.
Extended Data Fig. 8
Extended Data Fig. 8. Arc expression is elevated after fear memory testing.
a, Tiled confocal fluorescent images at 40X oil magnification of rat horizontal brain slices containing the LA (dashed white line) and showing neuronal activation across the groups exposed to homecage, unpaired fear conditioning, and paired fear conditioning. Left, distribution of infected neurons (red), infected and fear memory recall-activated neurons (Arc+ as revealed by GFP expression; green) and GAD67+ cells (blue). Images were obtained with maximal aperture size; white scale bar: 200 µm. Right, magnification of the LA region indicated by the white rectangle from wide-field view on the left; images obtained as maximal intensity projection of ~25 stacks of 2 µm optical slices; scale bar: 100 µm. b, Density of neurons expressing markers of infection, activation (Arc+), GABA (GAD67+), or combinations thereof after fear memory testing; from left to right: 1) infected and Arc+ neurons; 2) infected neurons; 3) GAD67+ neurons; 4) infected GAD67+ neurons; 5) infected and Arc+ GAD67+ neurons. The density of neurons expressing one of the five different combinations of markers is presented on the right as the number of neurons / mm2. Note that the number of Arc+ neurons is significantly higher in the paired group (One-way ANOVA, F2,19 = 3.4, P = 0.0289 and 0.049 after Bonferroni correction (*), n = 5 rats per group, for infected Arc+ neurons). These neurons are in large majority glutamatergic neurons, as Arc+ GAD67+ neurons are almost absent from any of the three groups (graph 5). In Fig. 5b, the number of recruited neurons (Arc+) was taken from this graph but normalized to the number of infected neurons to accommodate variability for infection rates across animals (N = 4 rats per group. Data are means + s.e.m.). c, Representative image of ChR2 expression, as revealed by fluorescence of co-expressed mCherry, and quantification of mCherry/ChR2-positive cells. The images are representatives of images from rats 1, 5, 8 and 10 that are shown in extended data 9e.
Extended Data Fig. 9
Extended Data Fig. 9. In vivo recordings – tetrode implantation.
a, Microdrive with 8 tetrodes (32 electrodes total) used for in vivo electrophysiological recordings in freely-moving rats. b, Optical fiber that allows – in addition to recording – stimulation with blue light. c, Rat implanted with a microdrive. d, DAPI staining of a coronal section of the lateral amygdala (inset: LA, dashed outline) showing the localization of the implanted tetrodes (black arrows). Image shows a representative example of tetrode or optrode placements in 11 rats. Scale bars indicate 2 mm or 0.5 mm (inset). e, Localization of all electrode tips, determined post-hoc. Scale bar indicates 1 mm. f, Example of Channelrhodopsin-2-expressing neuronal unit responding to a 1-ms blue-light pulse with time-locked spikes following the blue stimulus within a few ms (top, rasterplot data, n = 540 repetitions; bottom, z-score representation with the horizontal dashed line representing 3 standard deviations of baseline activity); inset: spike waveforms of recorded unit.
Extended Data Fig. 10
Extended Data Fig. 10. In vivo recordings – tracking neurons over time.
a, Two isolated (red and blue) units originating from the same tetrode, as determined by (top) principal component (PC) and energy analysis. The units were recorded throughout baseline (left), habituation (middle) and testing (right). Bottom, representative waveforms of the recorded neurons. b, Cluster stability was assessed by measuring the J3 and Davies-Bouldin (DB) statistics in 2-dimension (2D) principal component space and 3-dimension (3D) principal component space, at the start and end of experiments (see M&M). Bars are means ± sd; n = 21 clusters. c, As negative controls to Fig. b), J3 and DB statistics were calculated from eight arbitrary clusters of similar shape and size that were defined from the central spheroid of principal component space (that is noise). Bars are means ± sd; n = 8. d, To ensure that the same neuron was recorded over multiple sessions, we quantified the squared Mahalanobis distance, discarding neurons with unstable values across sessions. e, Extracellular waveform used as a criterion for distinguishing between interneurons and pyramidal neurons based on the clusters obtained by plotting ‘half-amplitude duration’ against ‘peak to trough duration’.

References

    1. Rogan MT, Stäubli UV, LeDoux JE. Fear conditioning induces associative long-term potentiation in the amygdala. Nature. 1997;390:604–607. - PubMed
    1. McKernan MG, Shinnick-Gallagher P. Fear conditioning induces a lasting potentiation of synaptic currents in vitro. Nature. 1997;390:607–611. - PubMed
    1. Cho J-H, et al. Coactivation of thalamic and cortical pathways induces input timing-dependent plasticity in amygdala. Nat. Neurosci. 2012;15:113–122. - PMC - PubMed
    1. Han J-H, et al. Neuronal competition and selection during memory formation. Science. 2007;316:457–460. - PubMed
    1. Han J-H, et al. Selective erasure of a fear memory. Science. 2009;323:1492–1496. - PubMed

LinkOut - more resources