. 2024 Jul;25(7):1172-1182.
doi: 10.1038/s41590-024-01861-6. Epub 2024 Jun 13.

Eomes expression identifies the early bone marrow precursor to classical NK cells

Affiliations

Eomes expression identifies the early bone marrow precursor to classical NK cells

Zhitao Liang et al. Nat Immunol. 2024 Jul.

Abstract

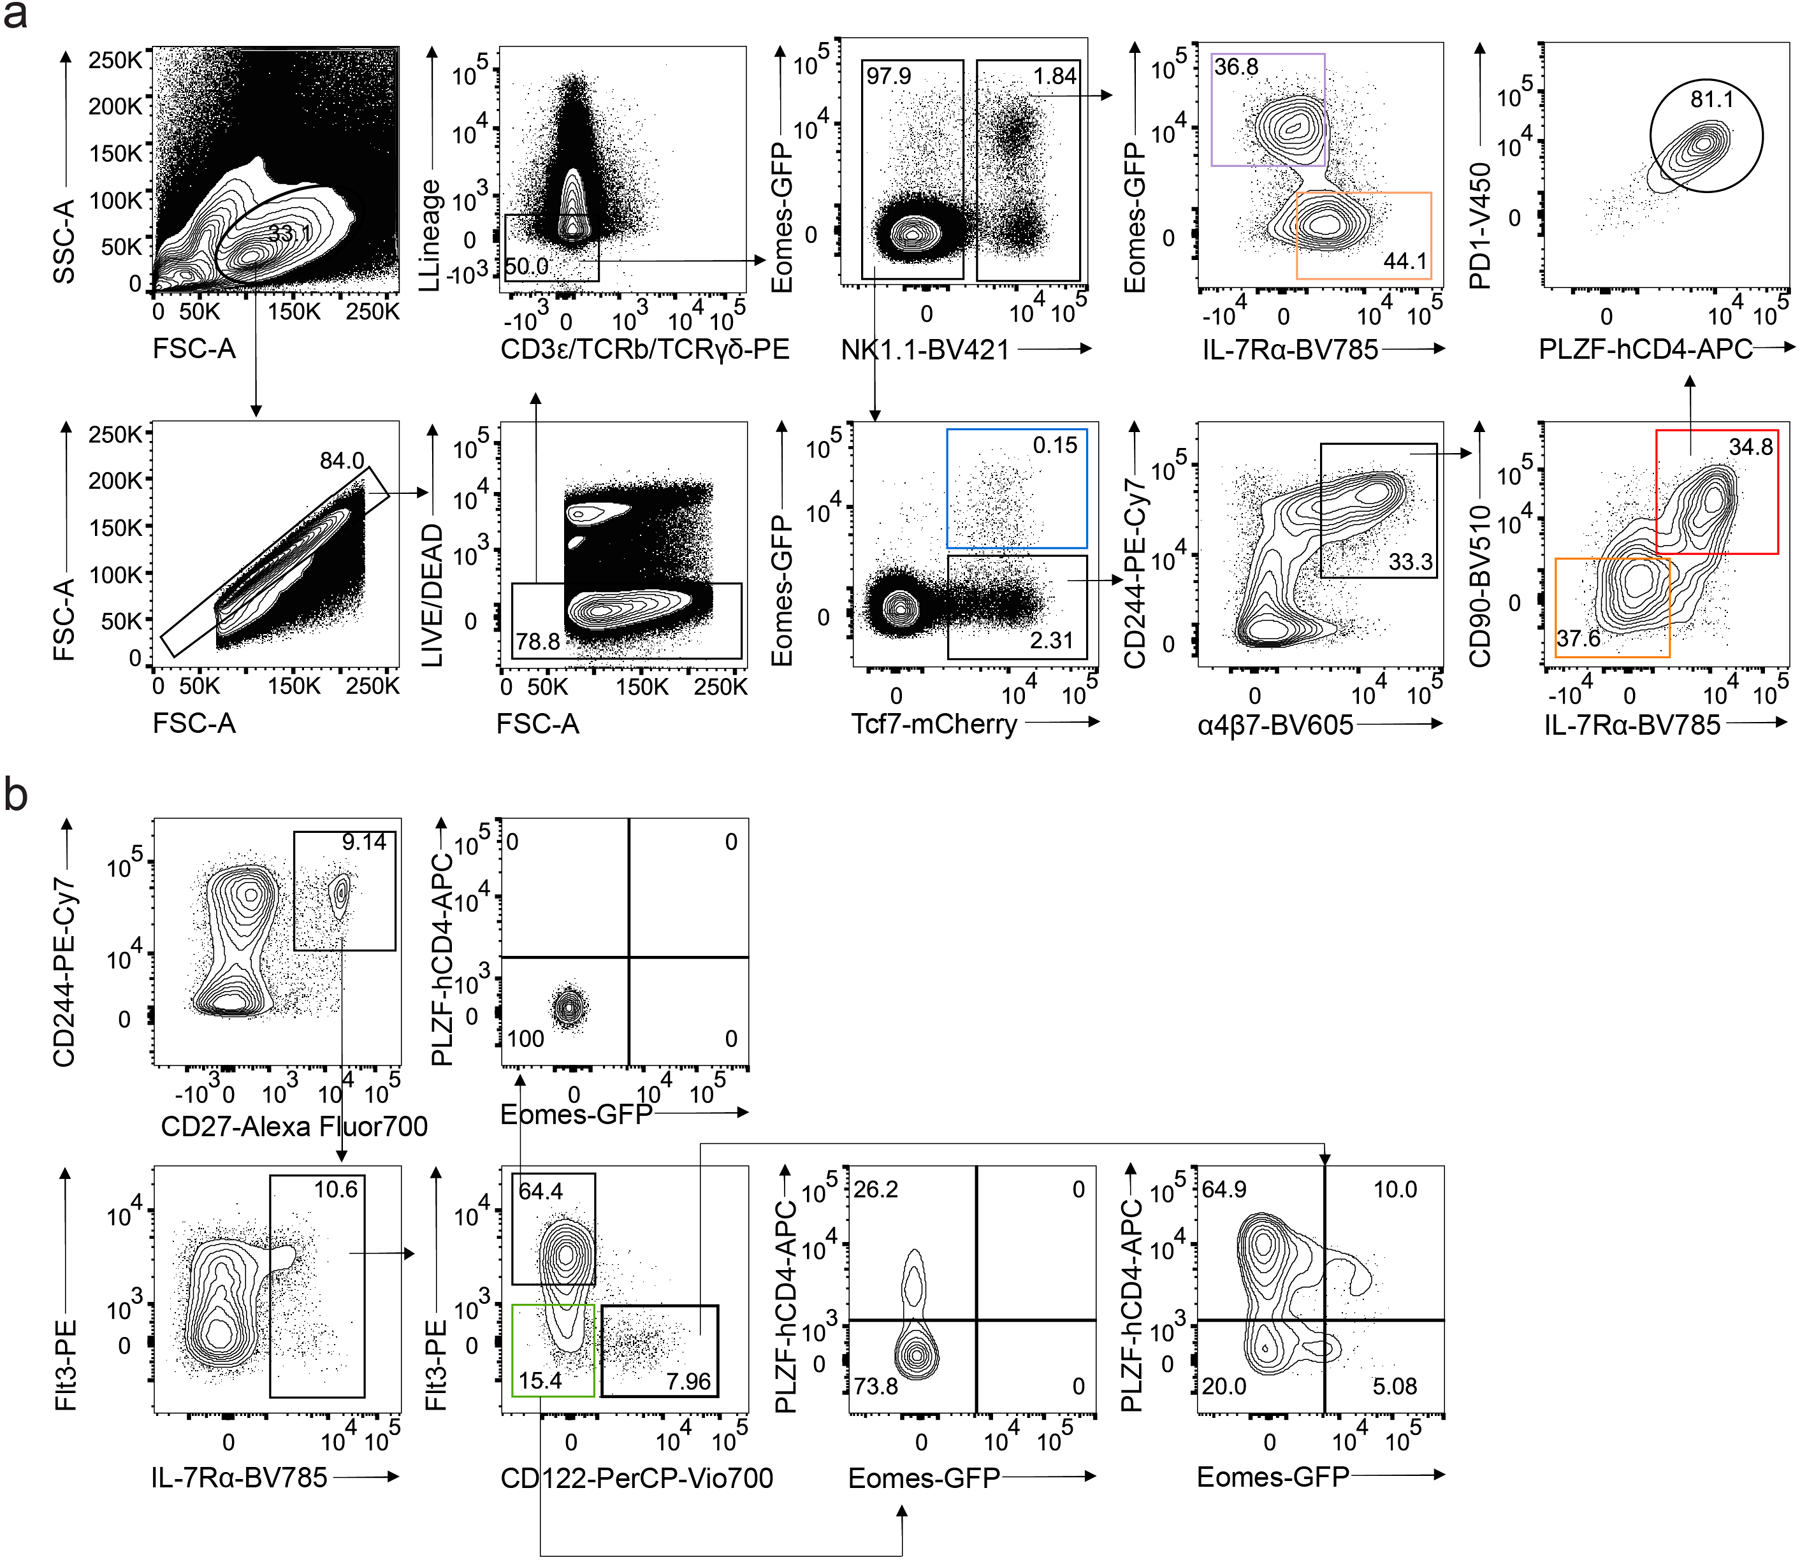
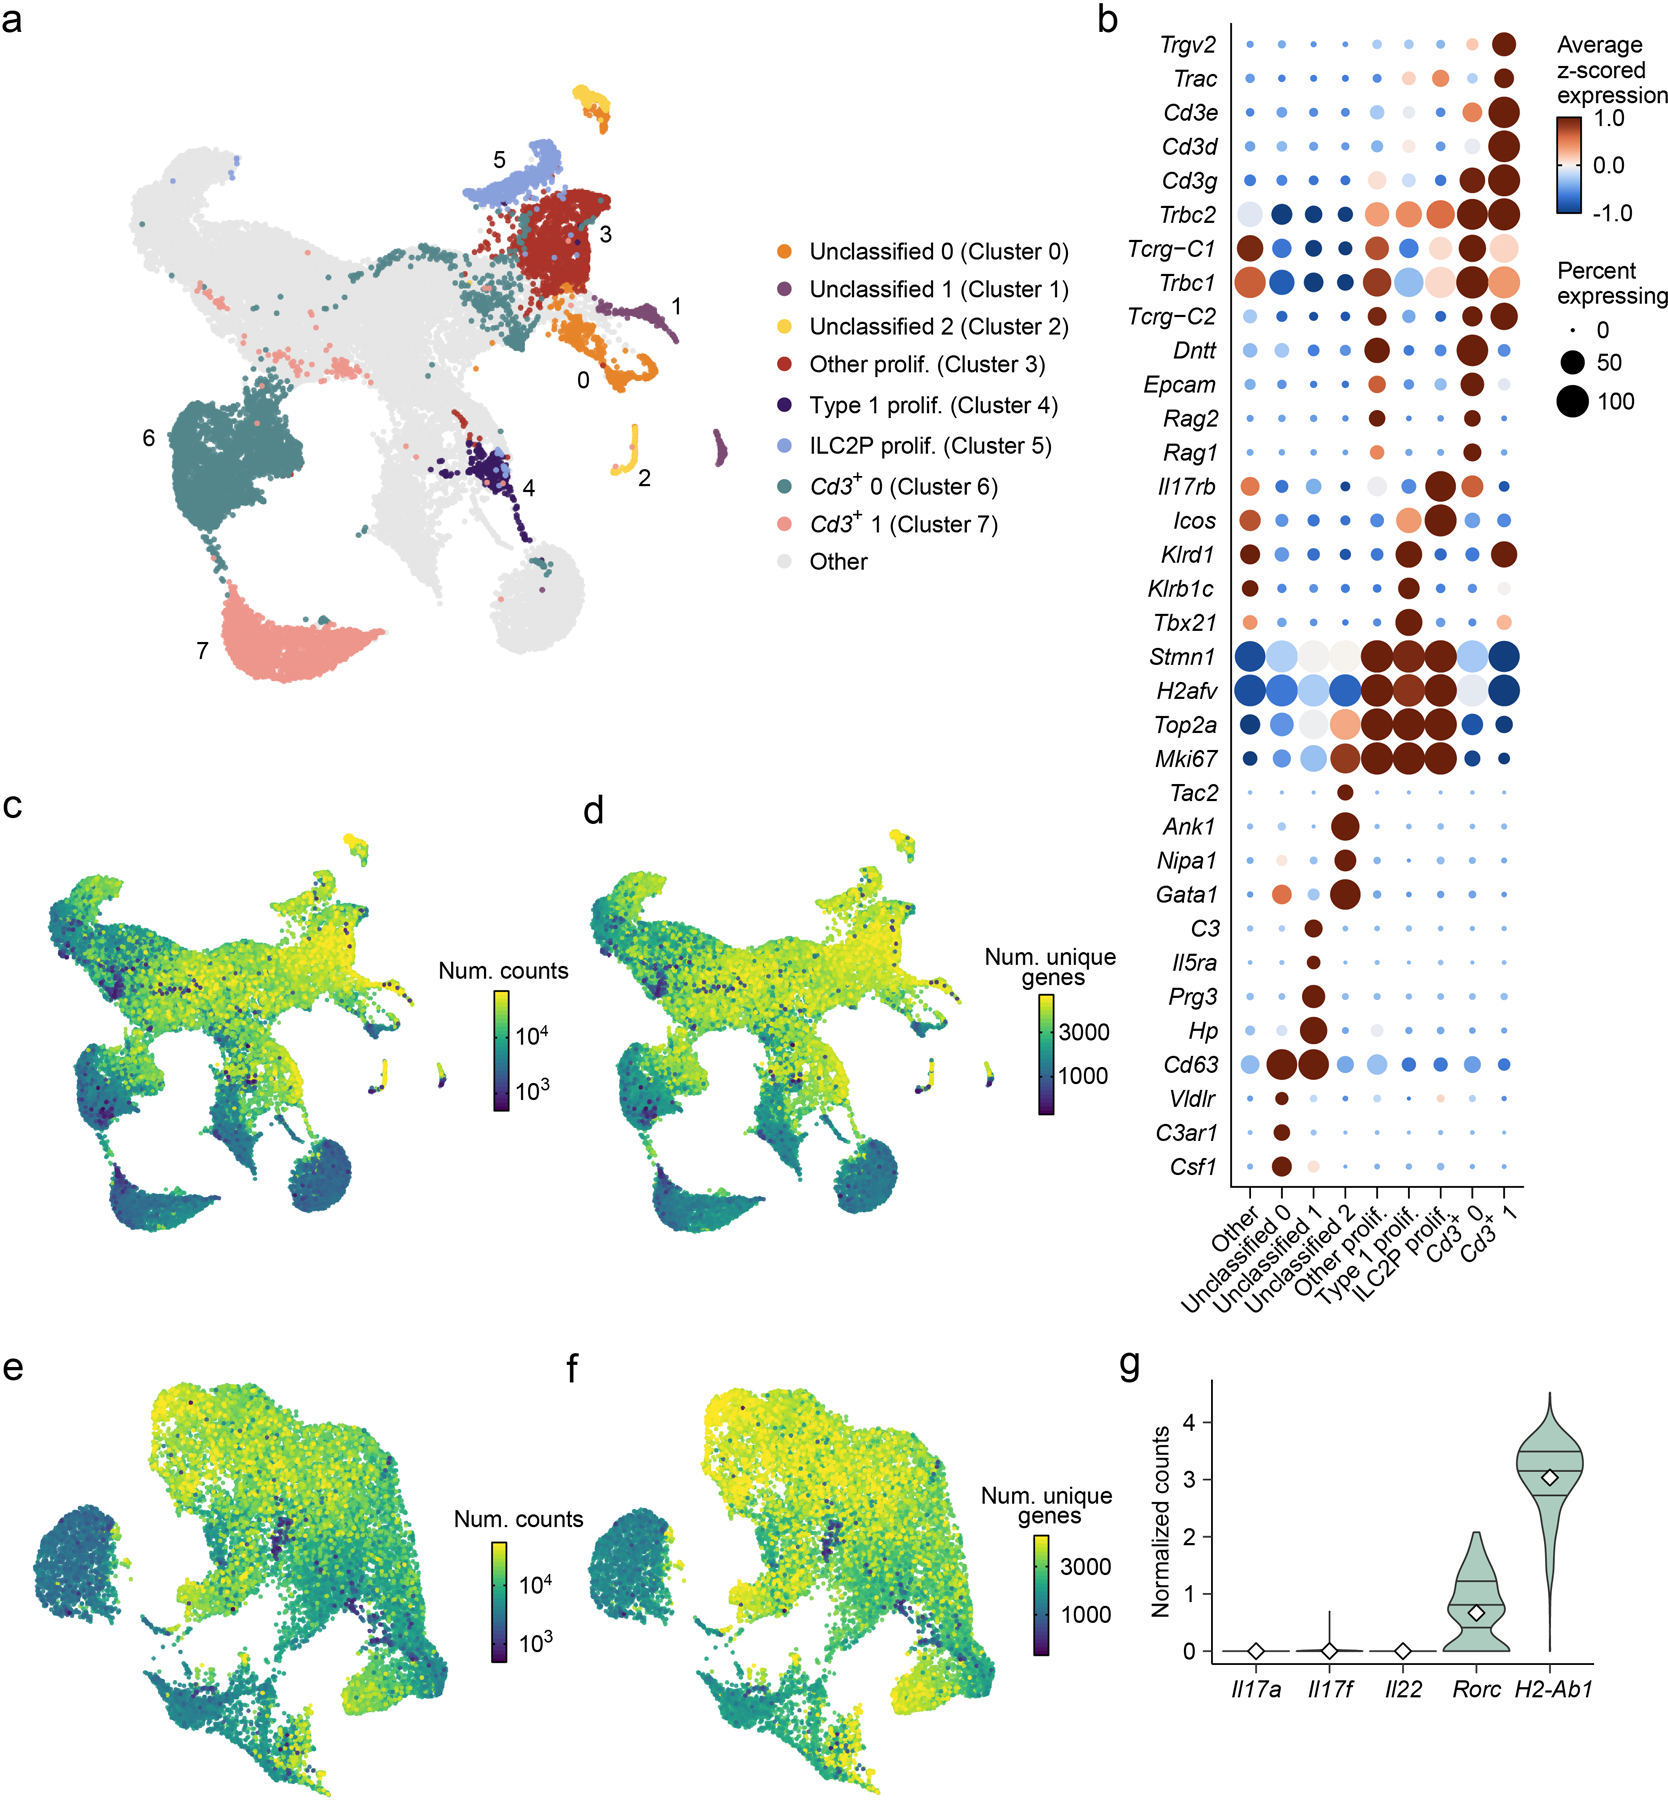
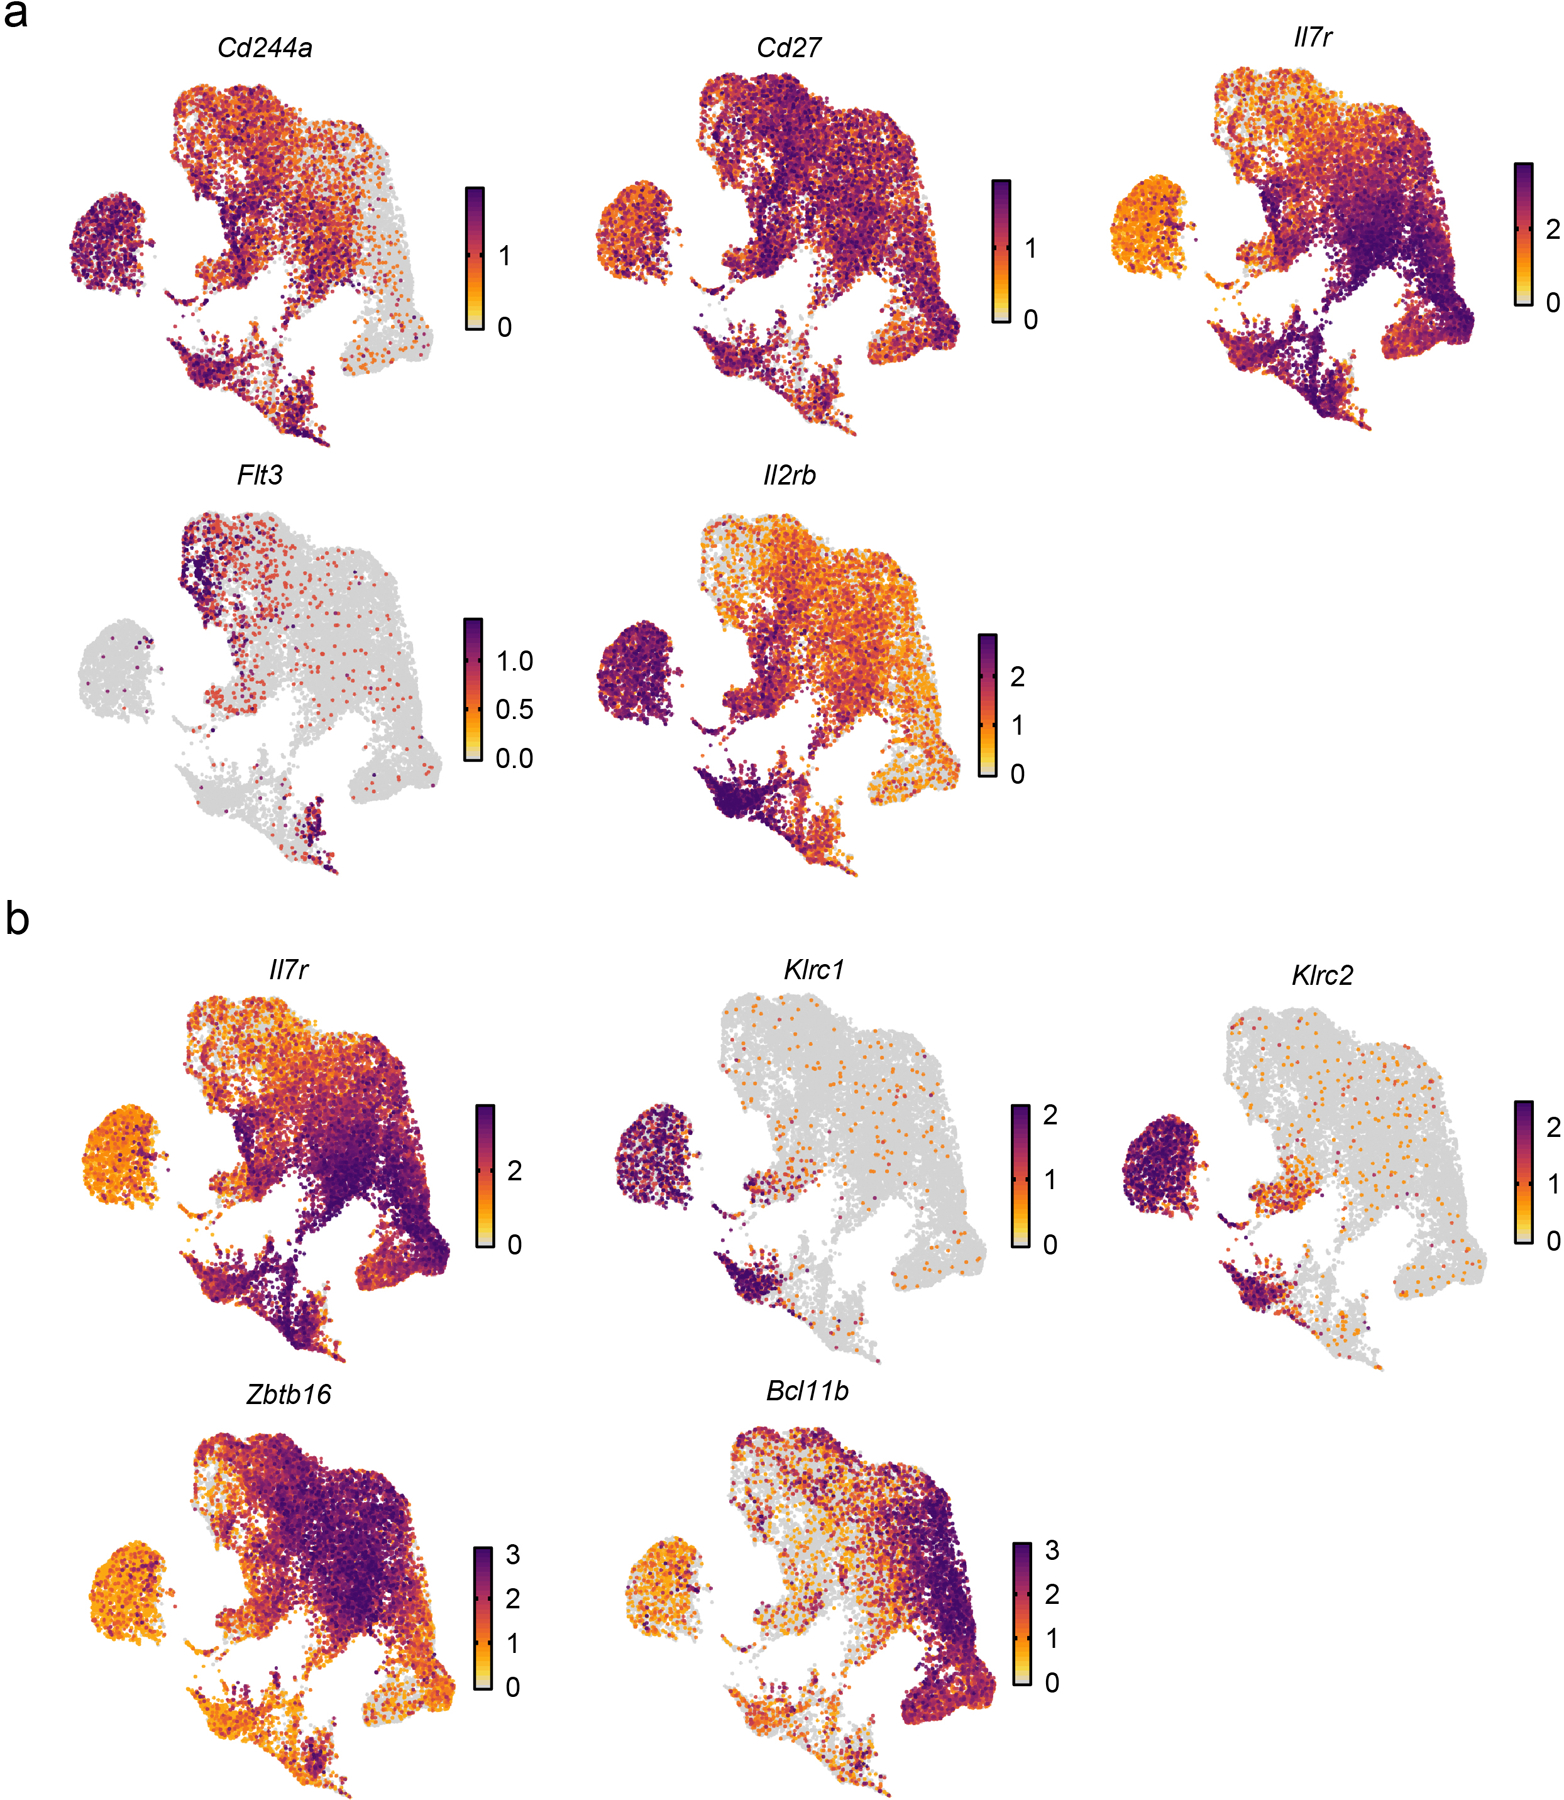
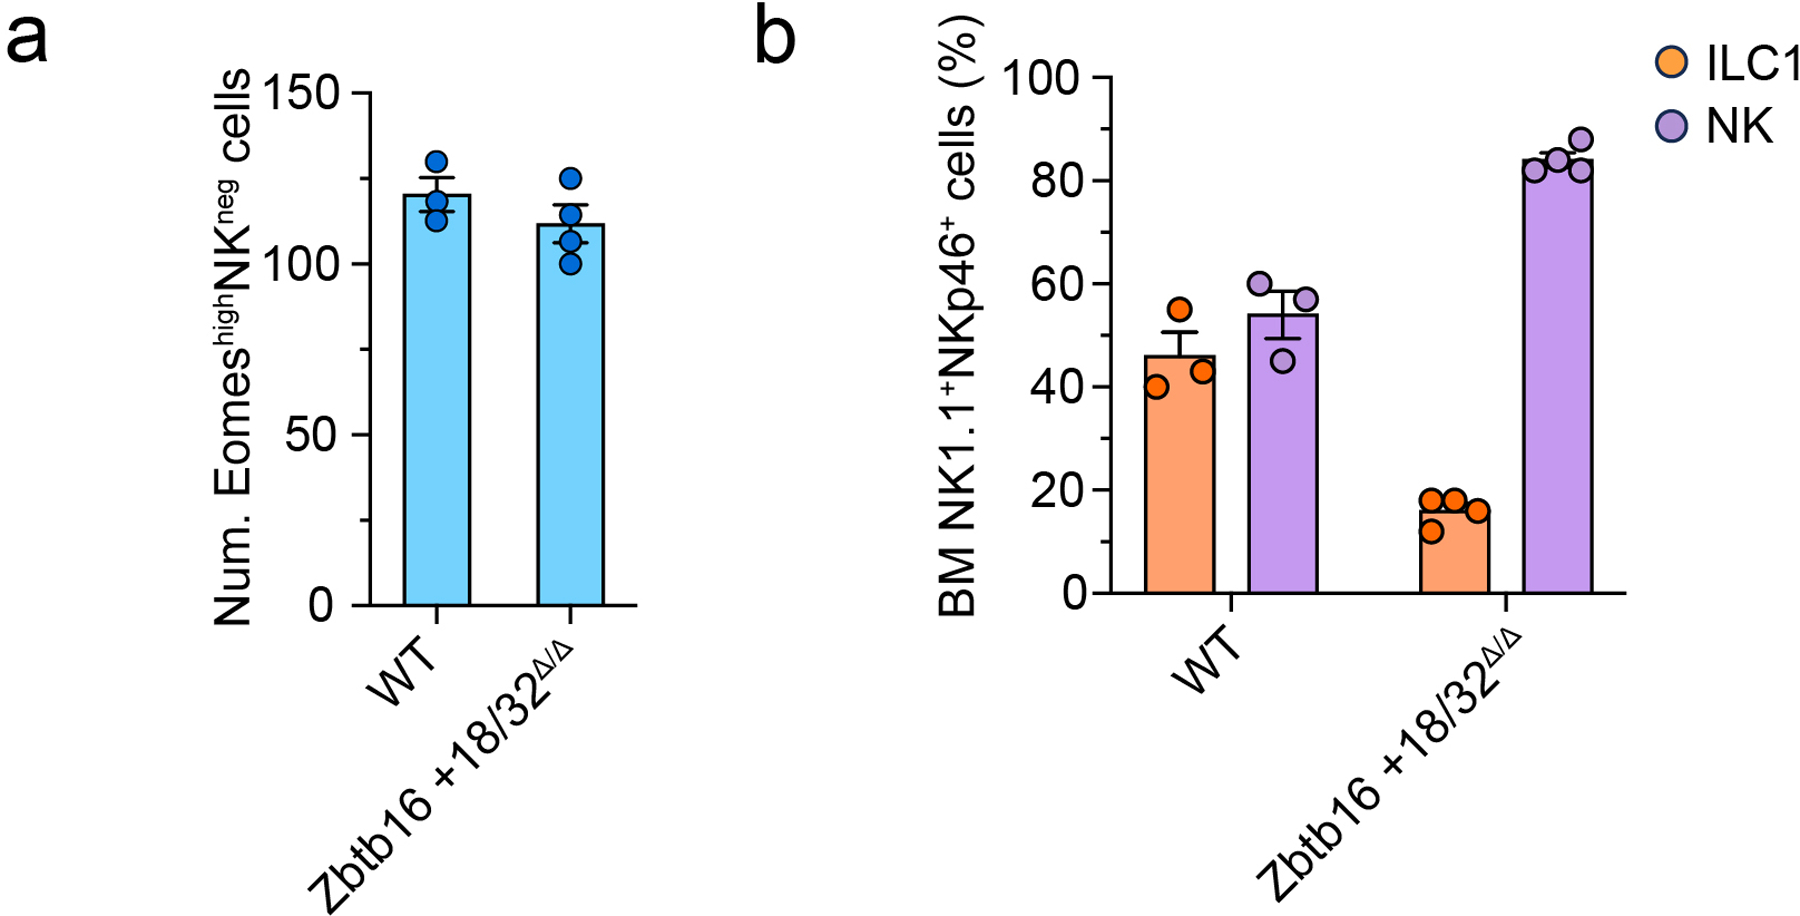
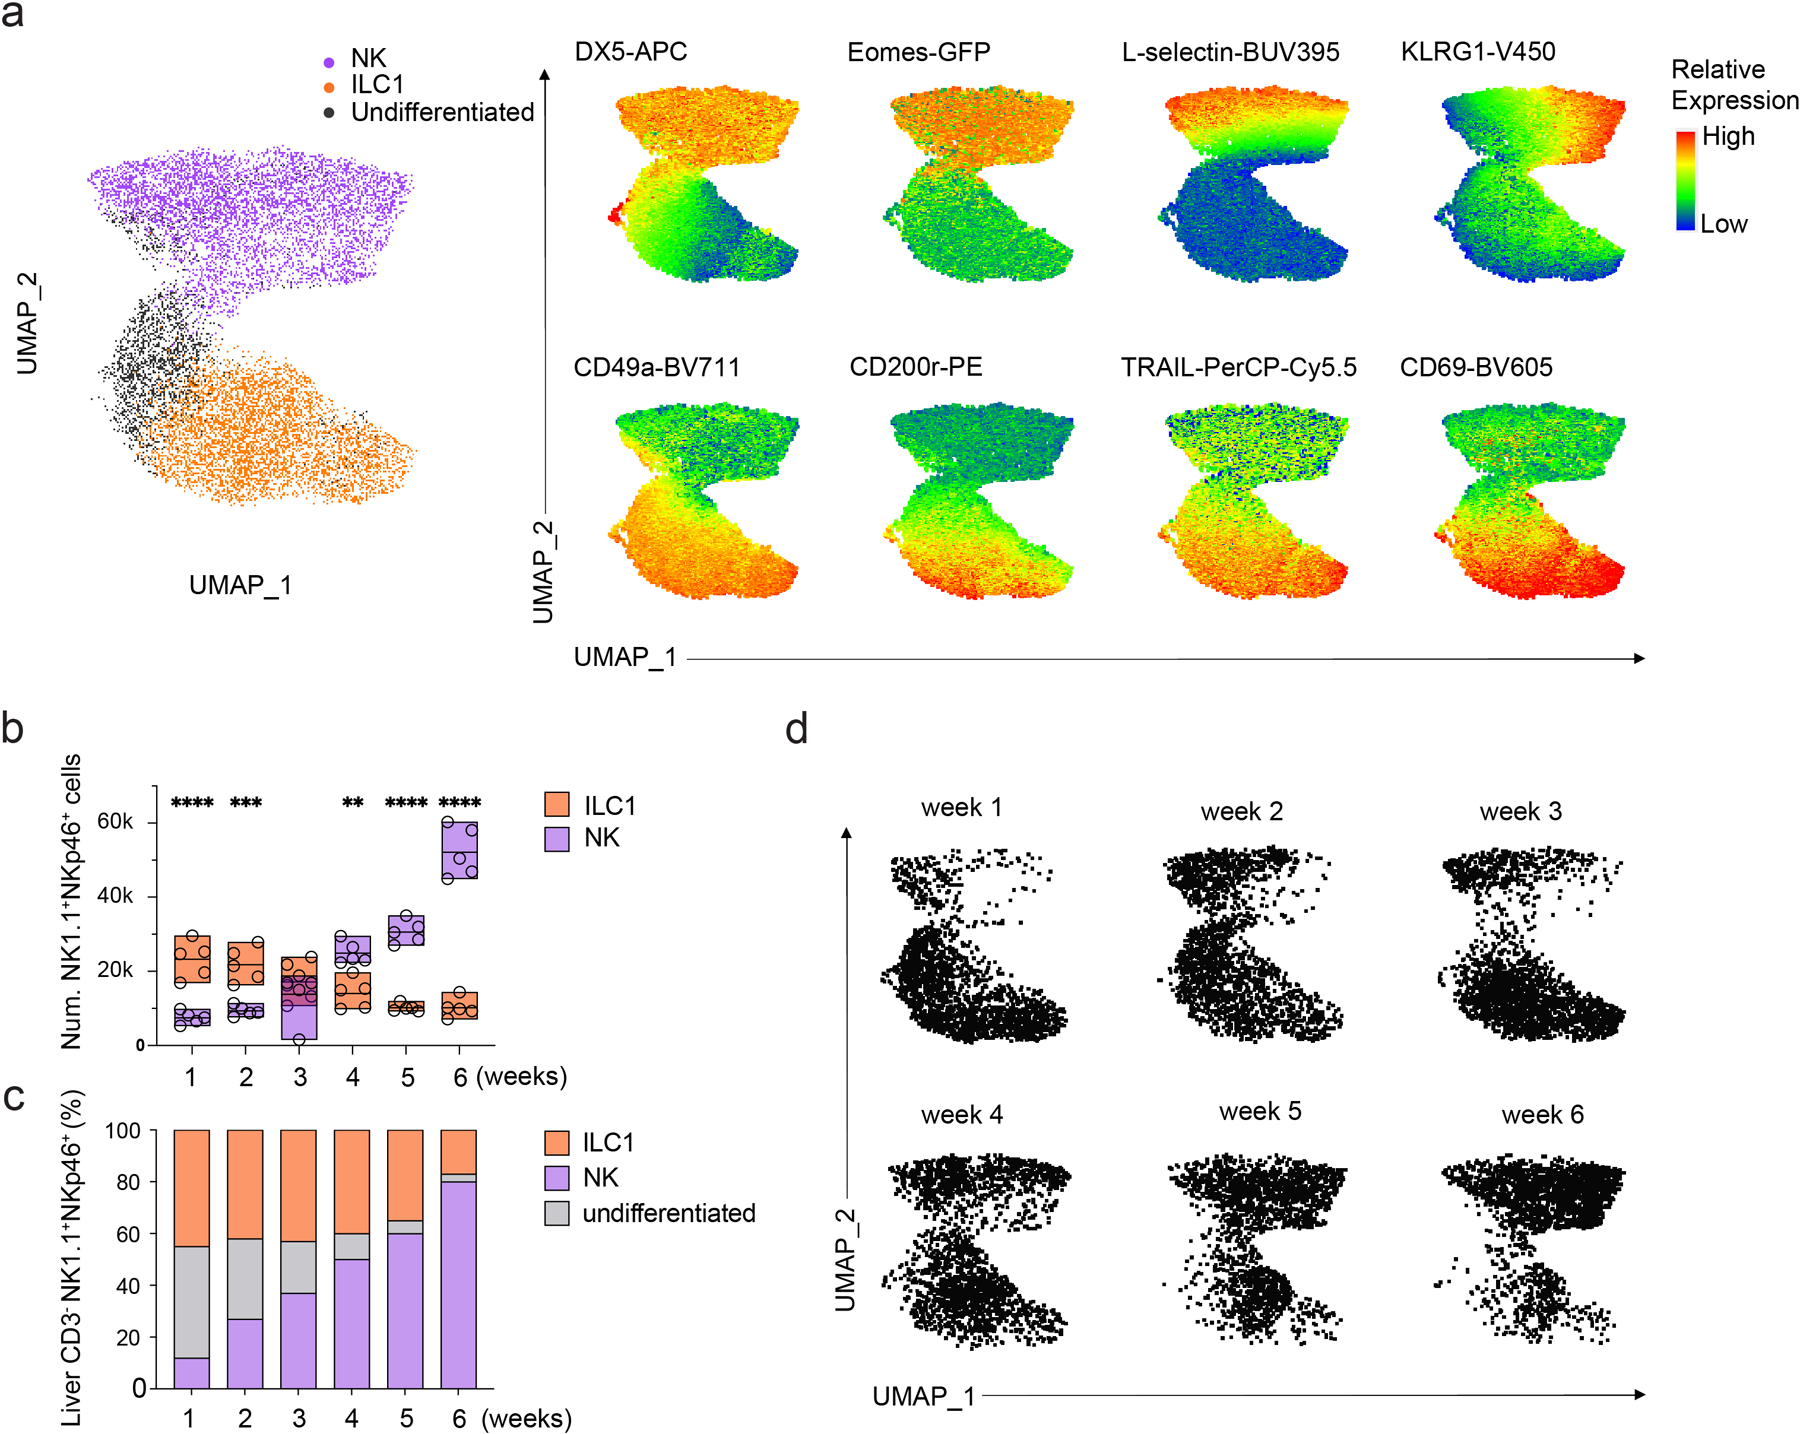
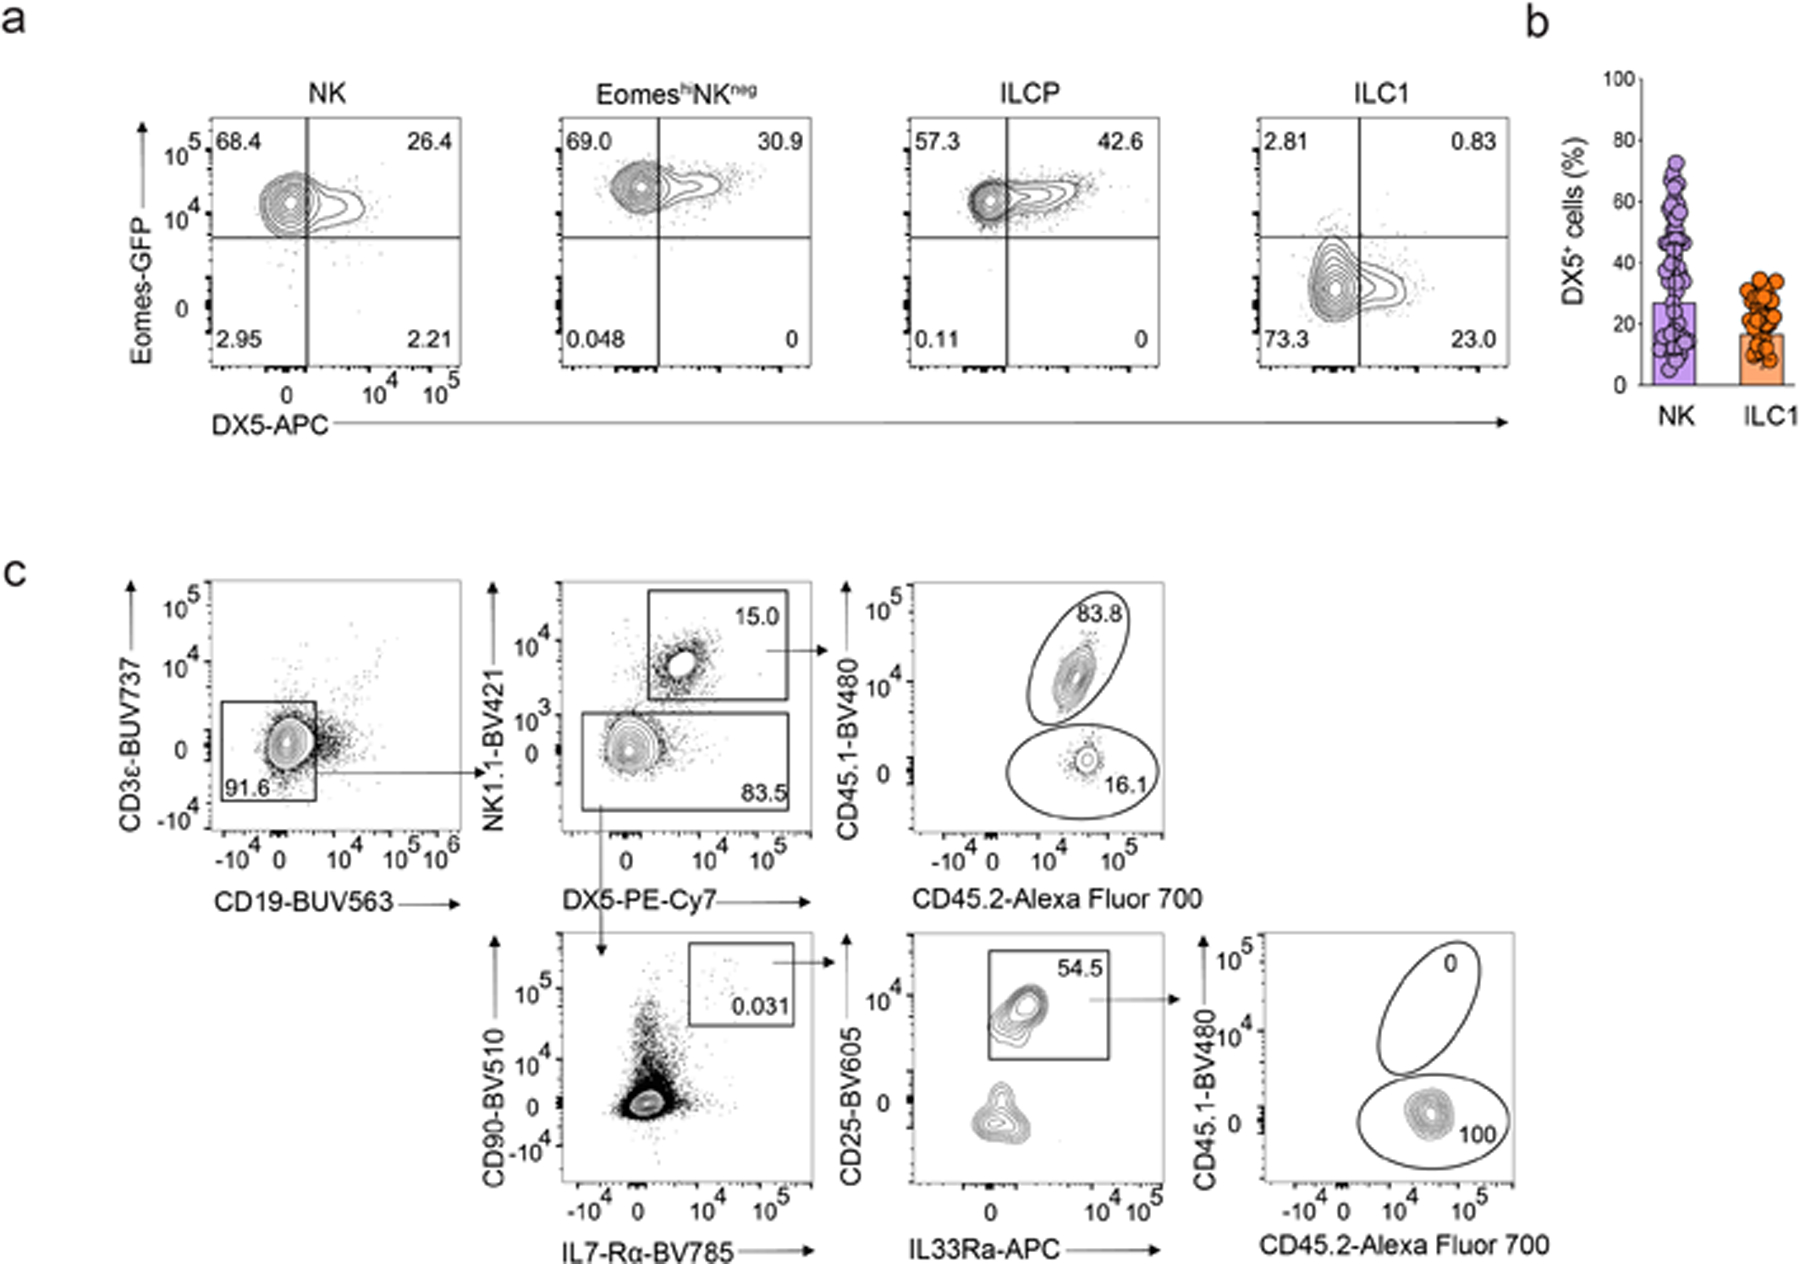
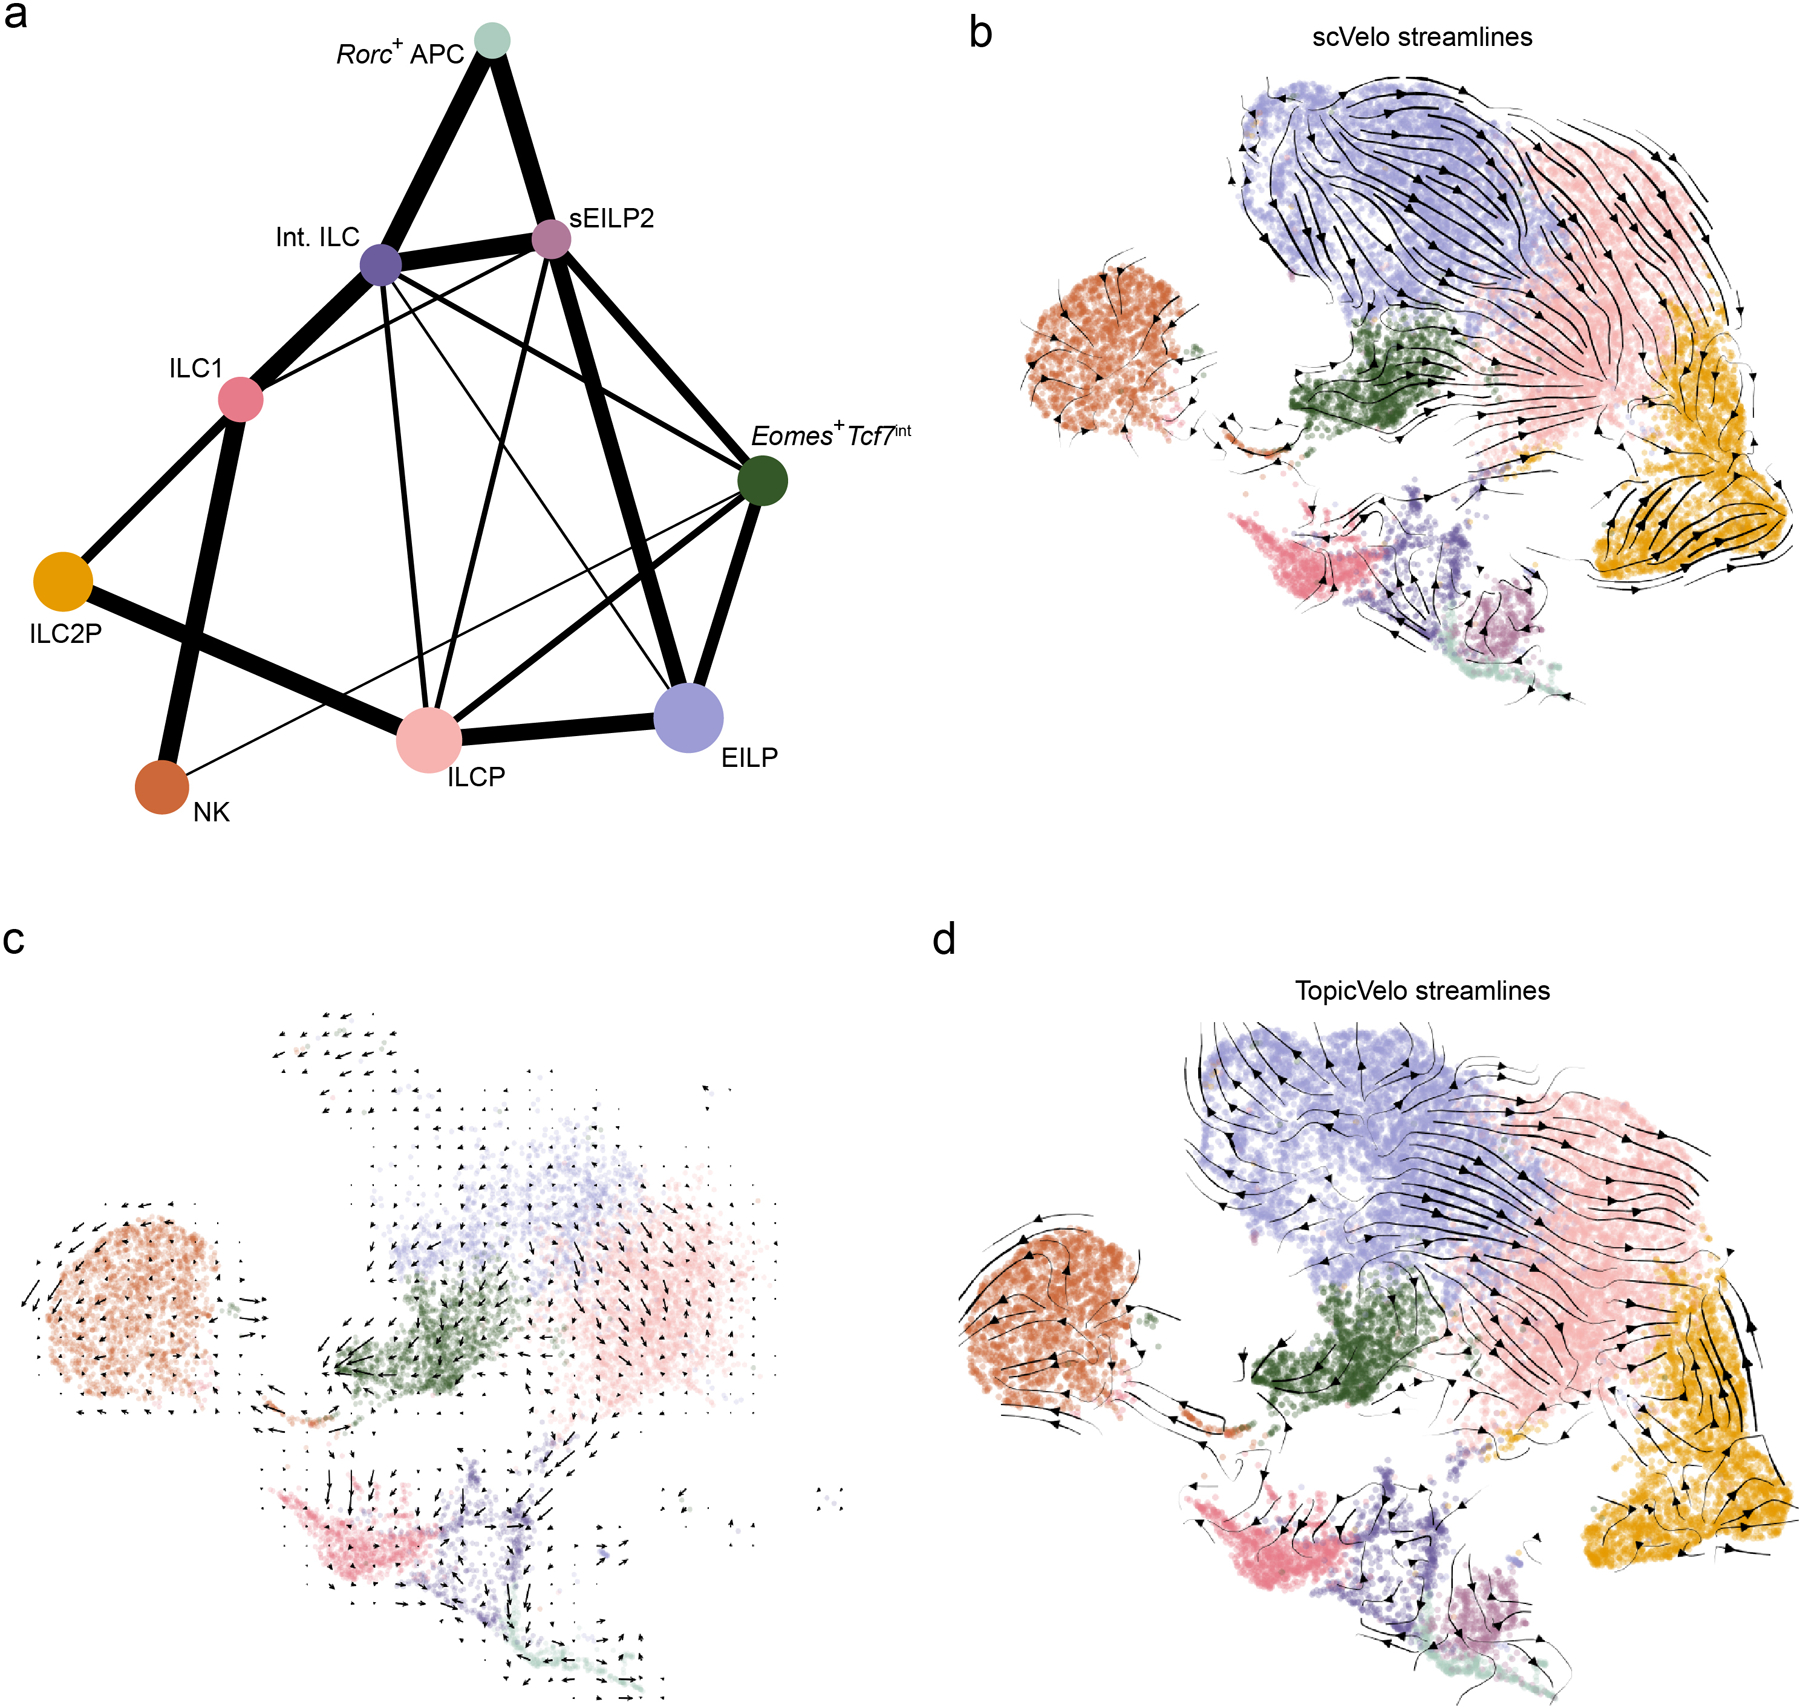
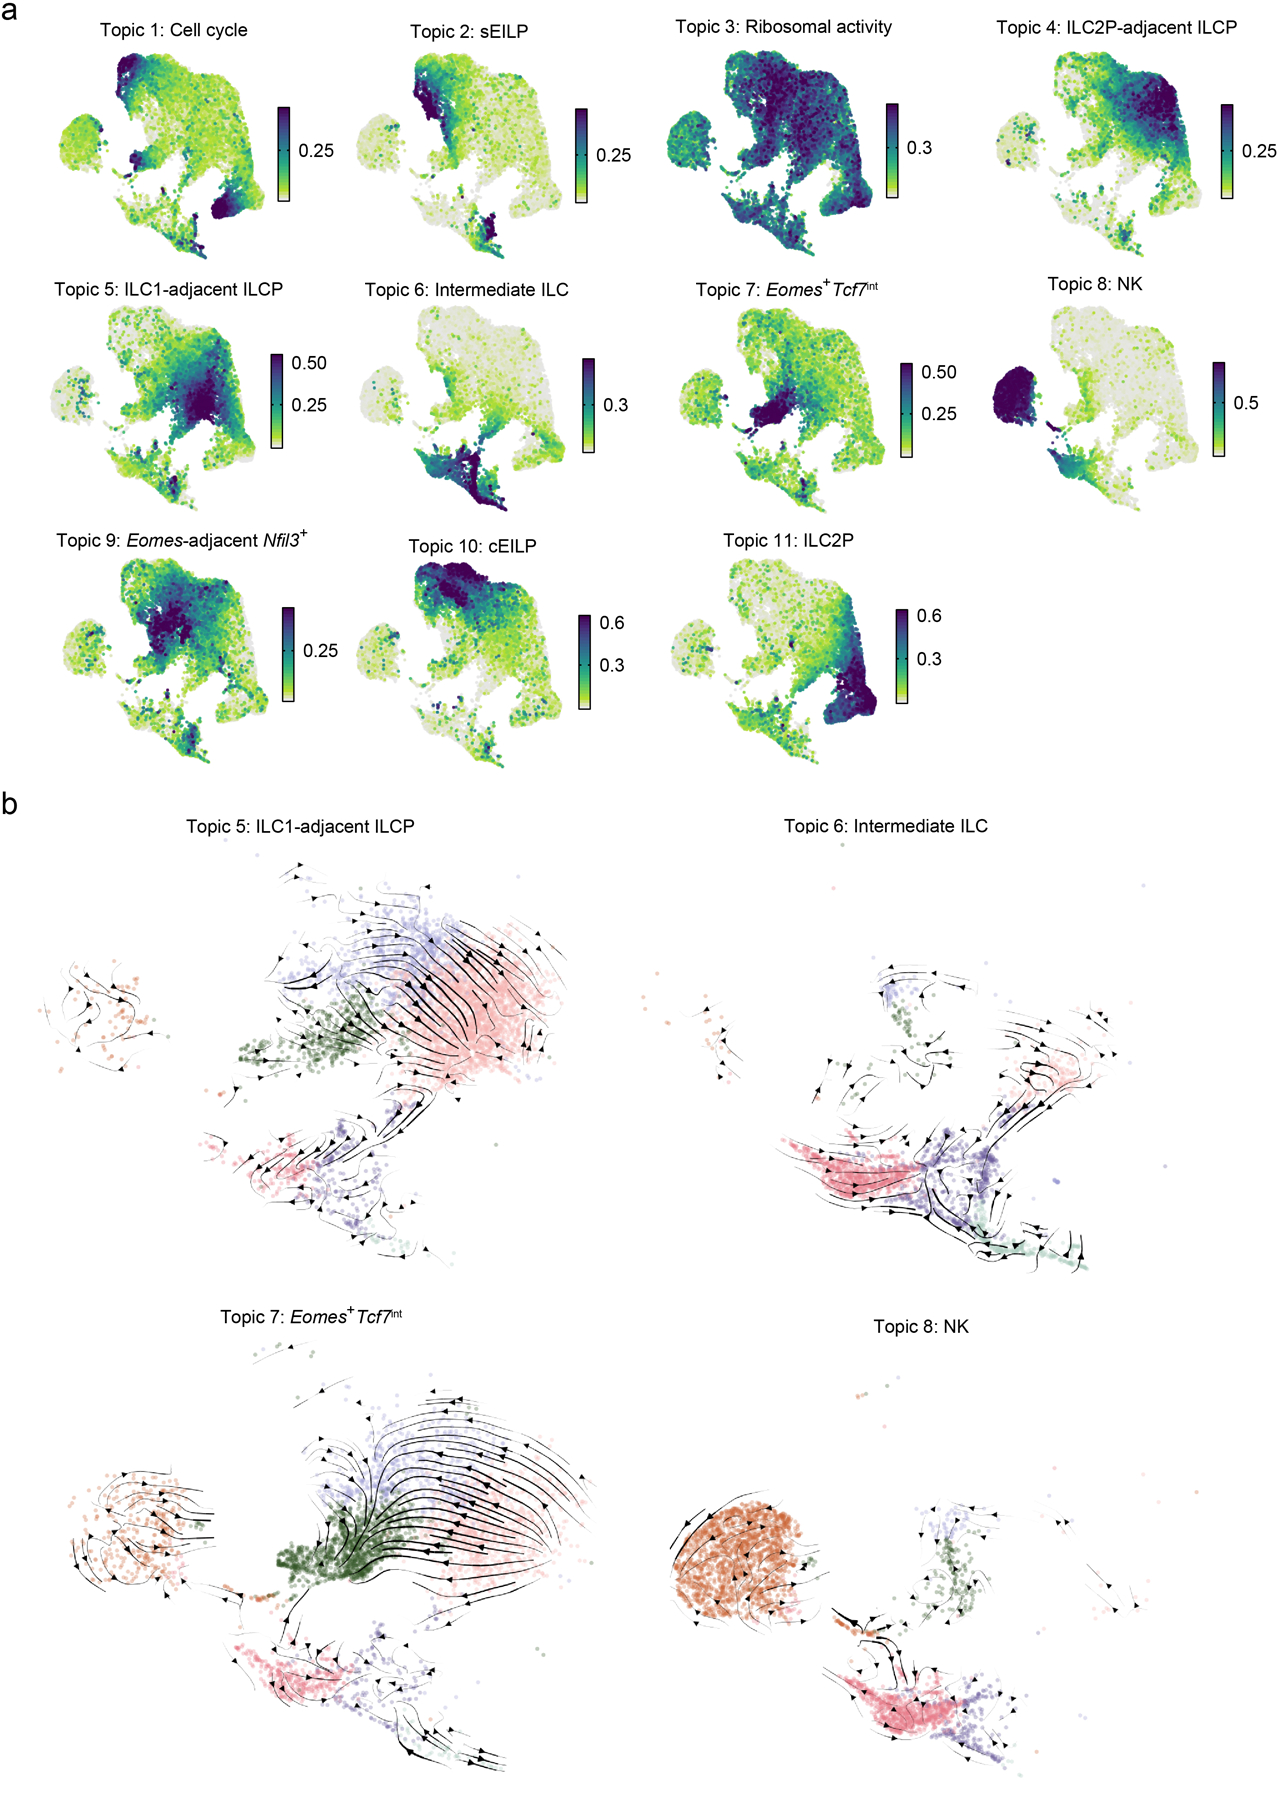
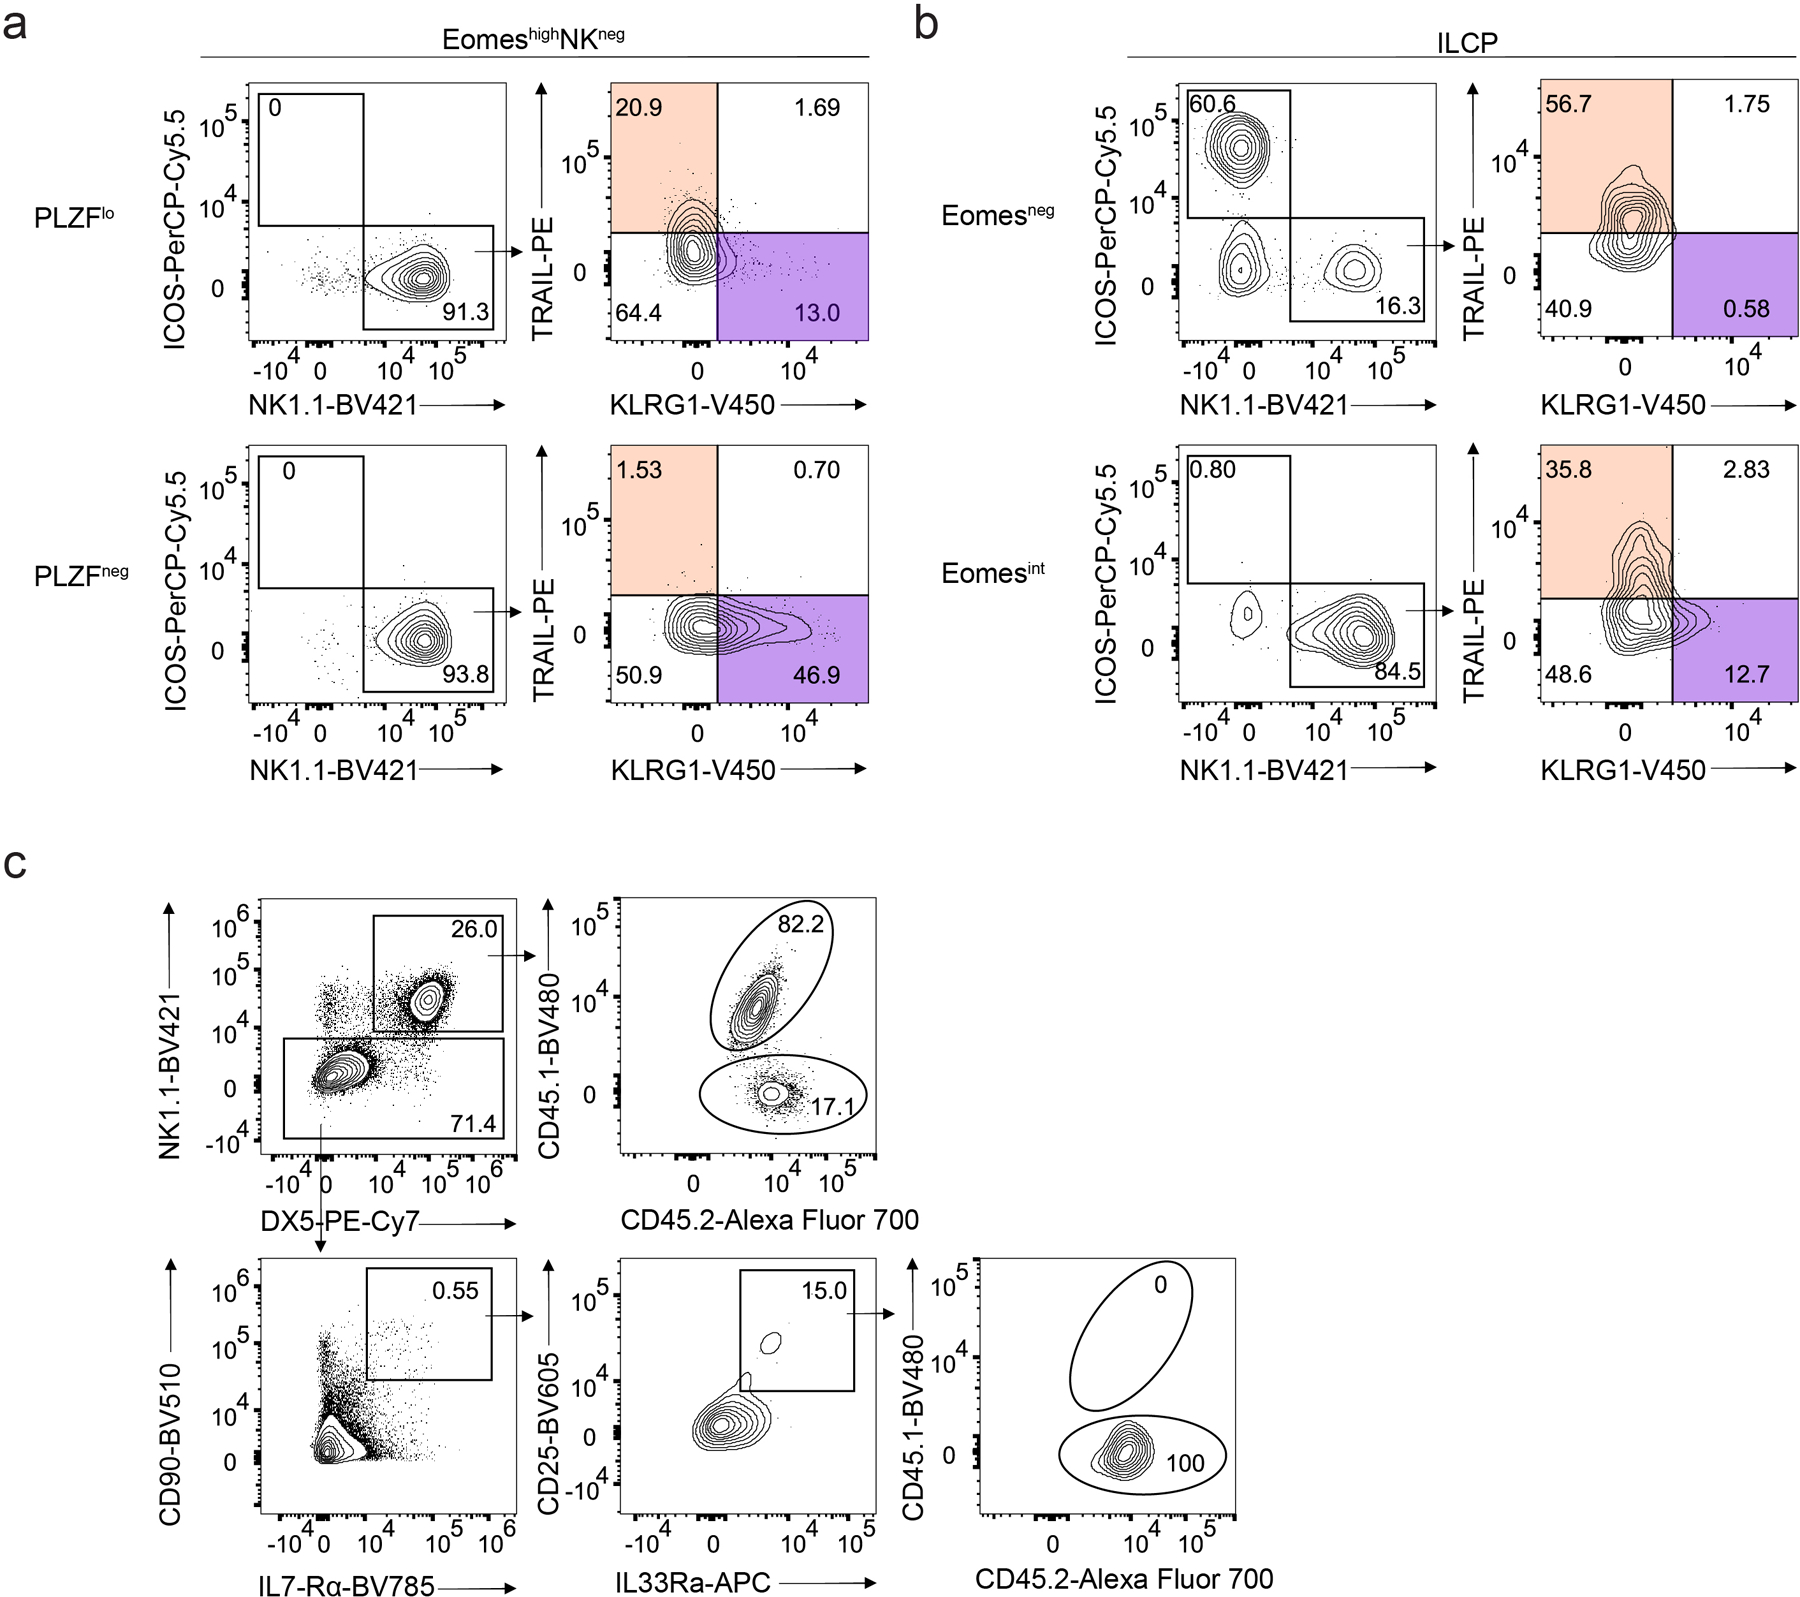
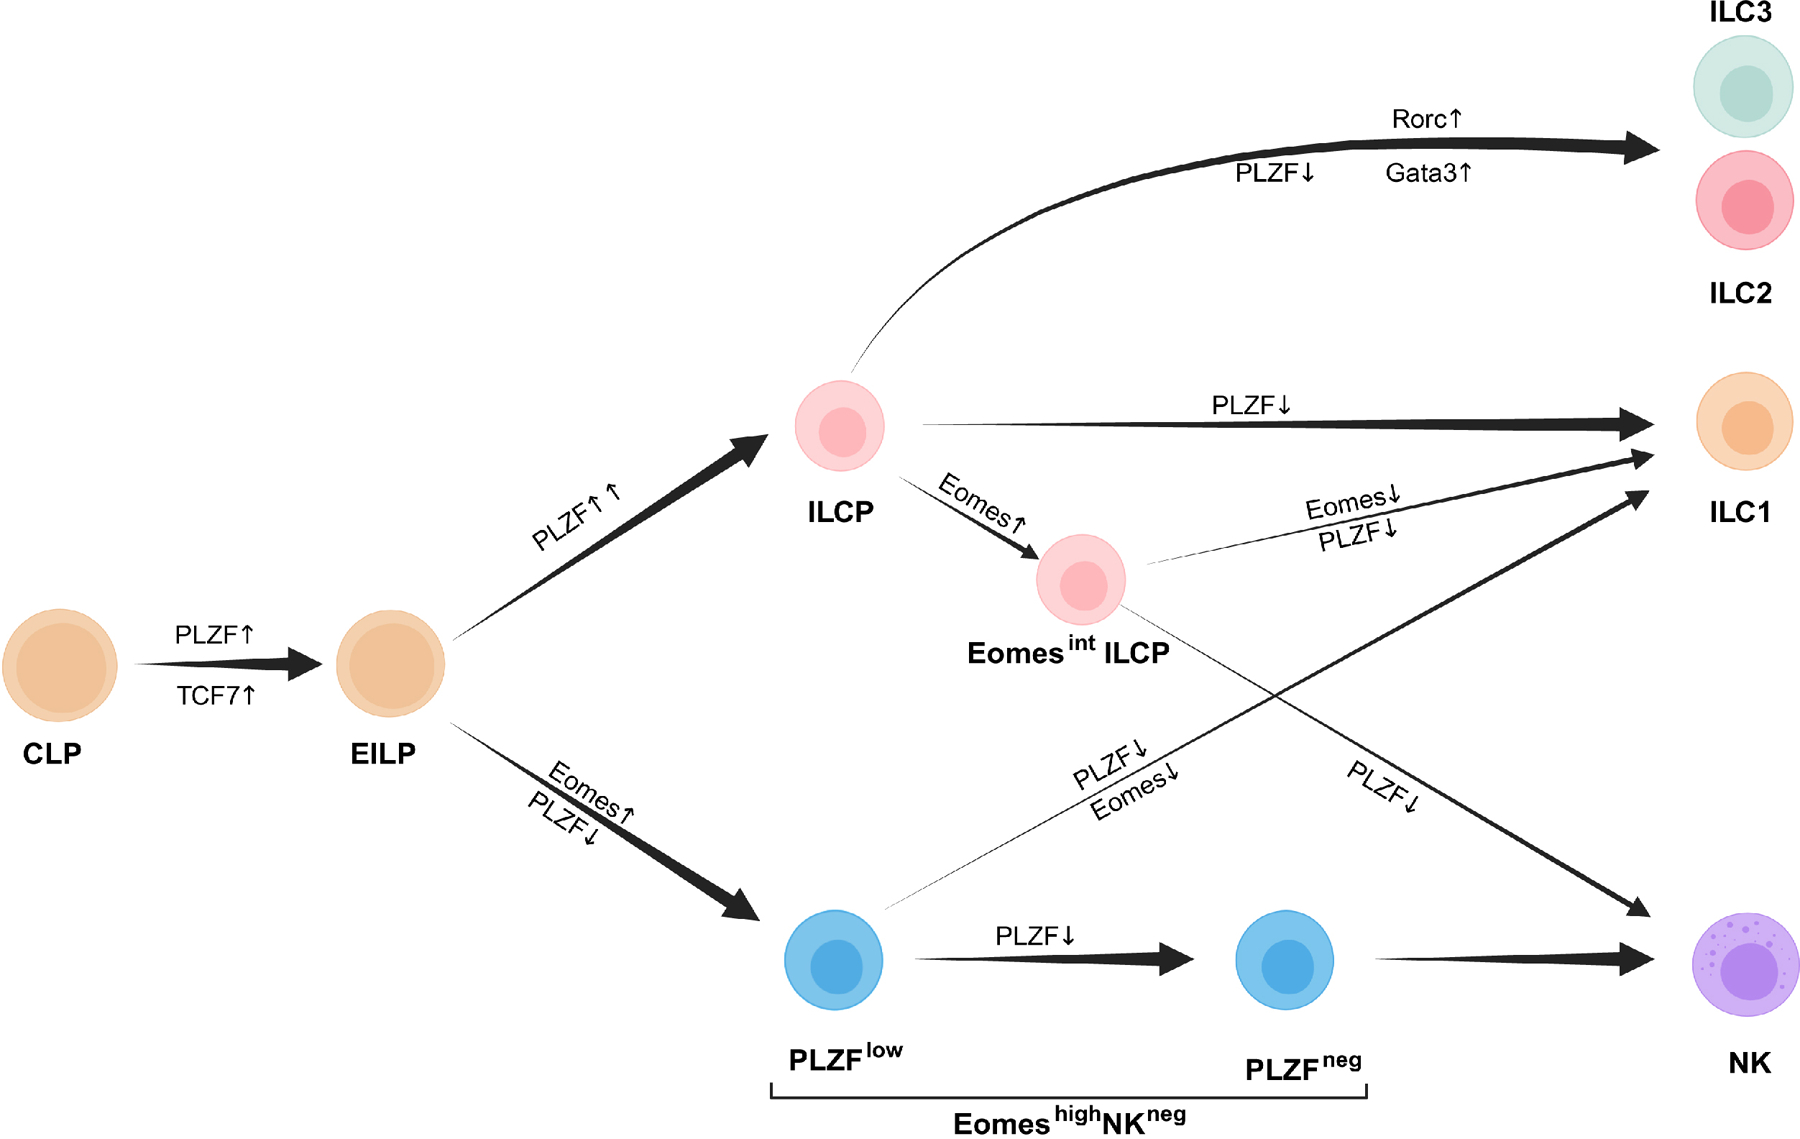
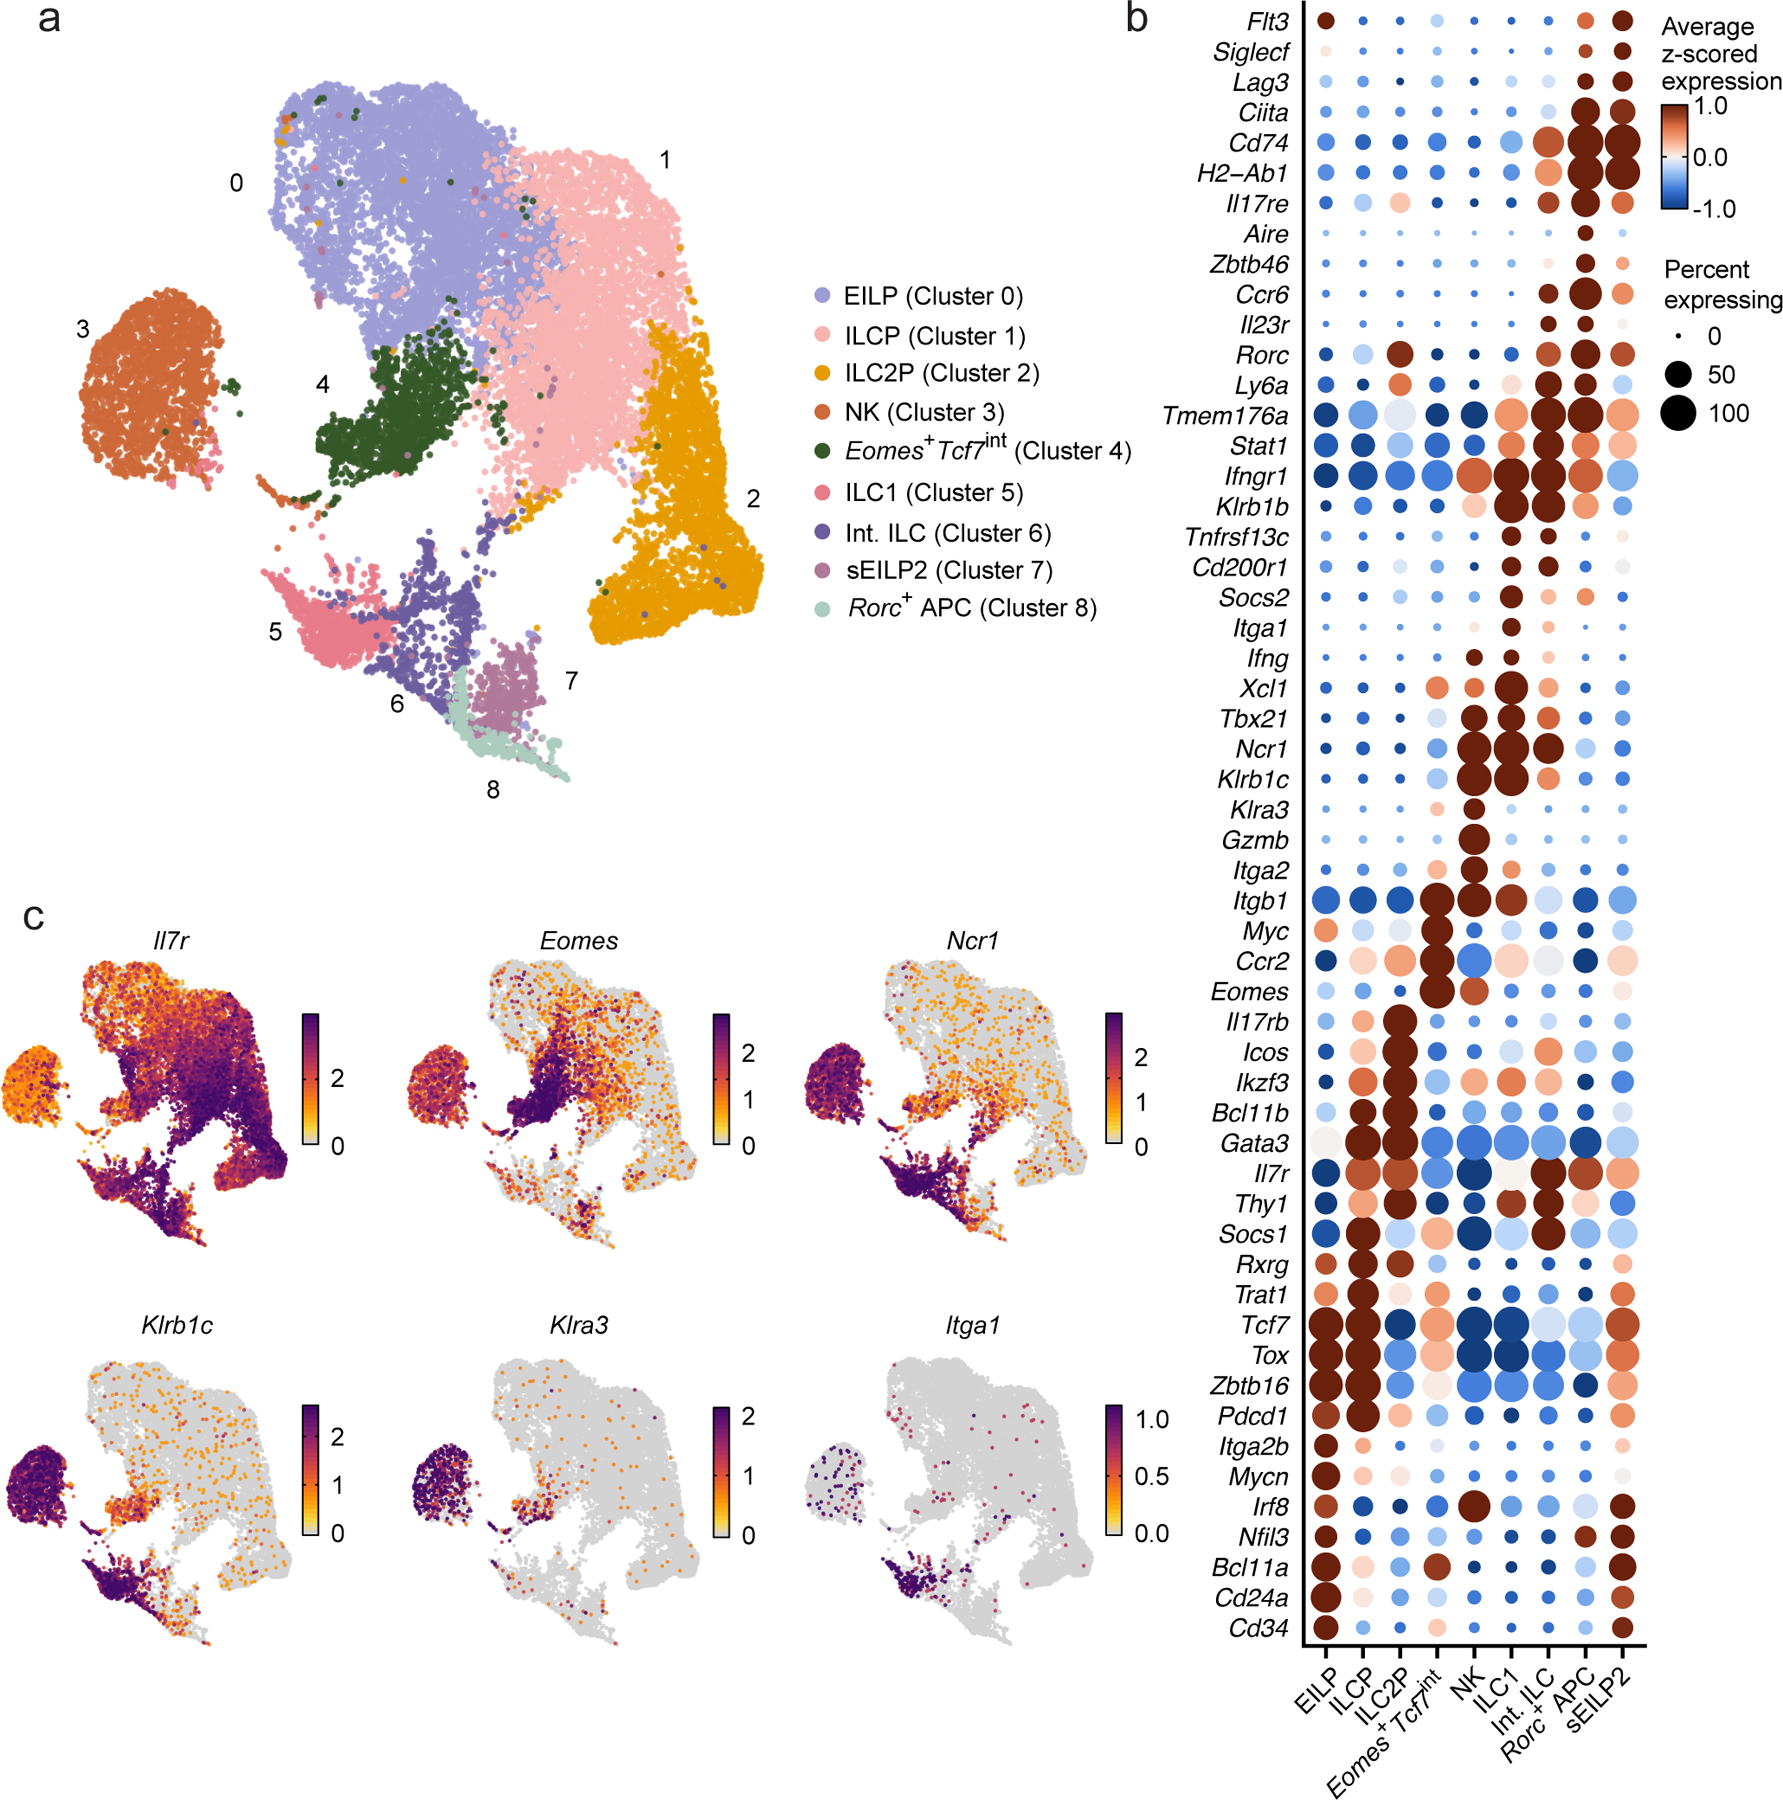
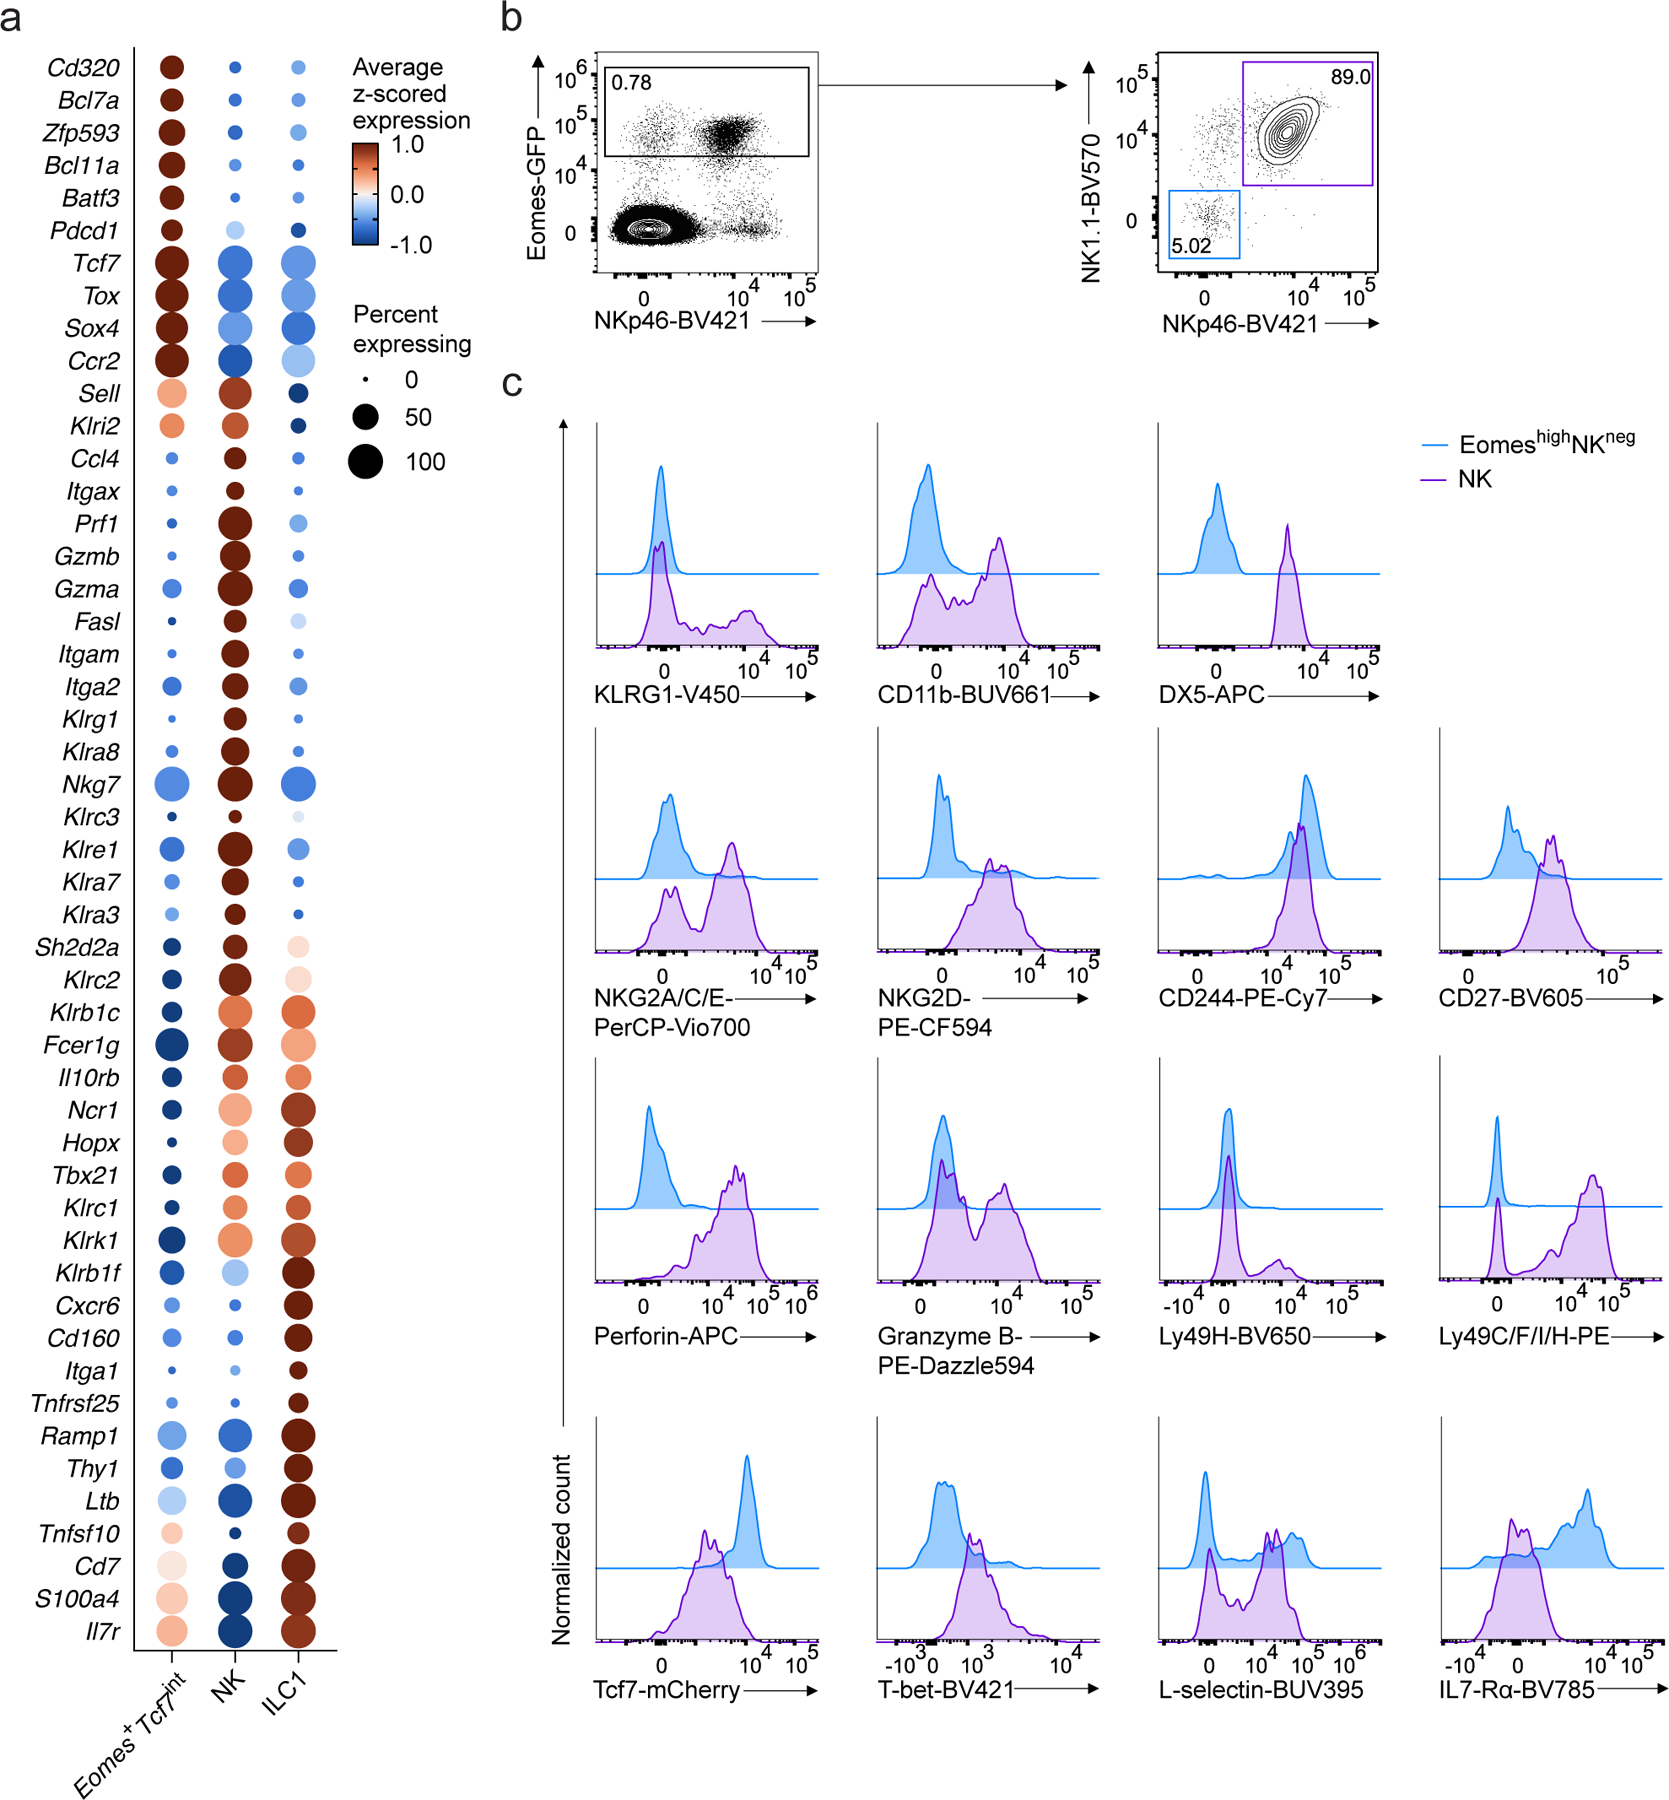
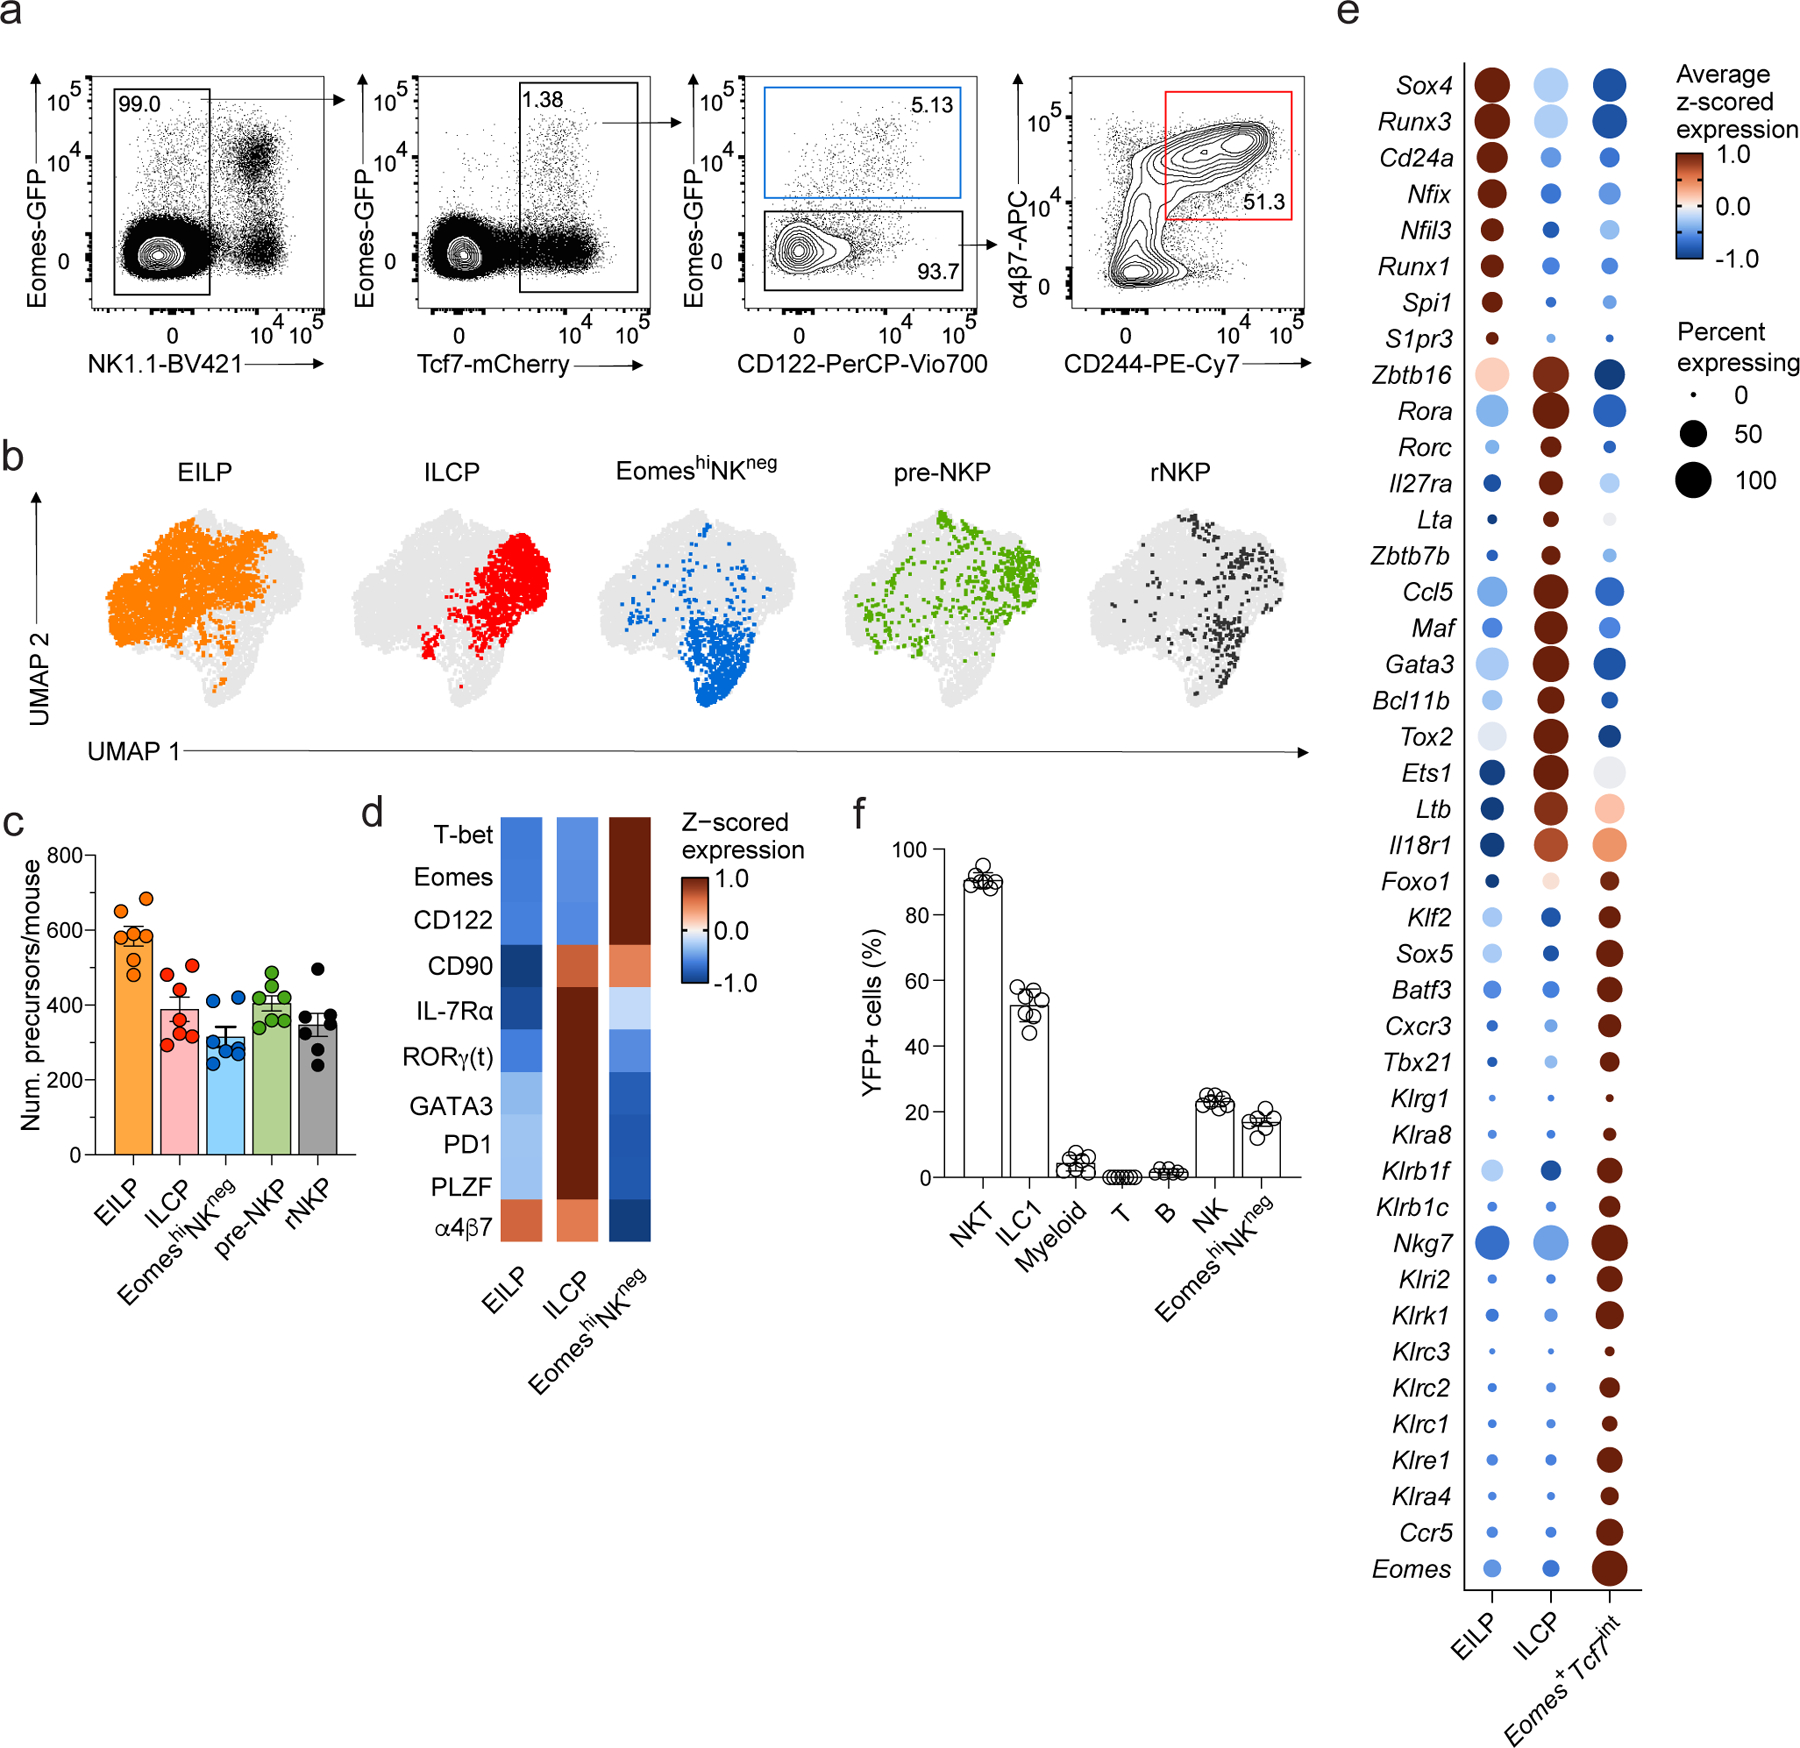
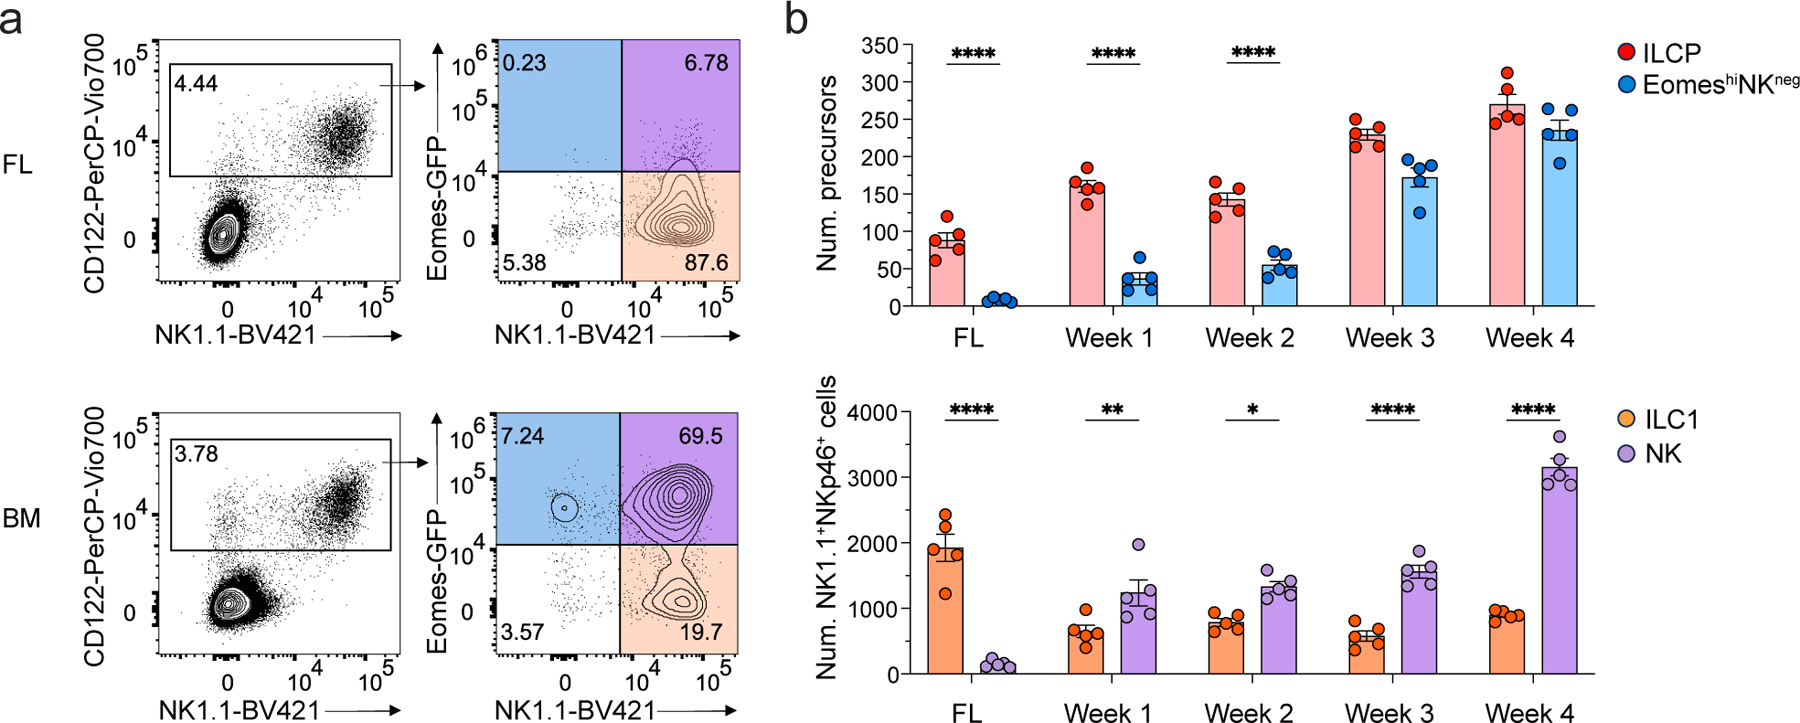
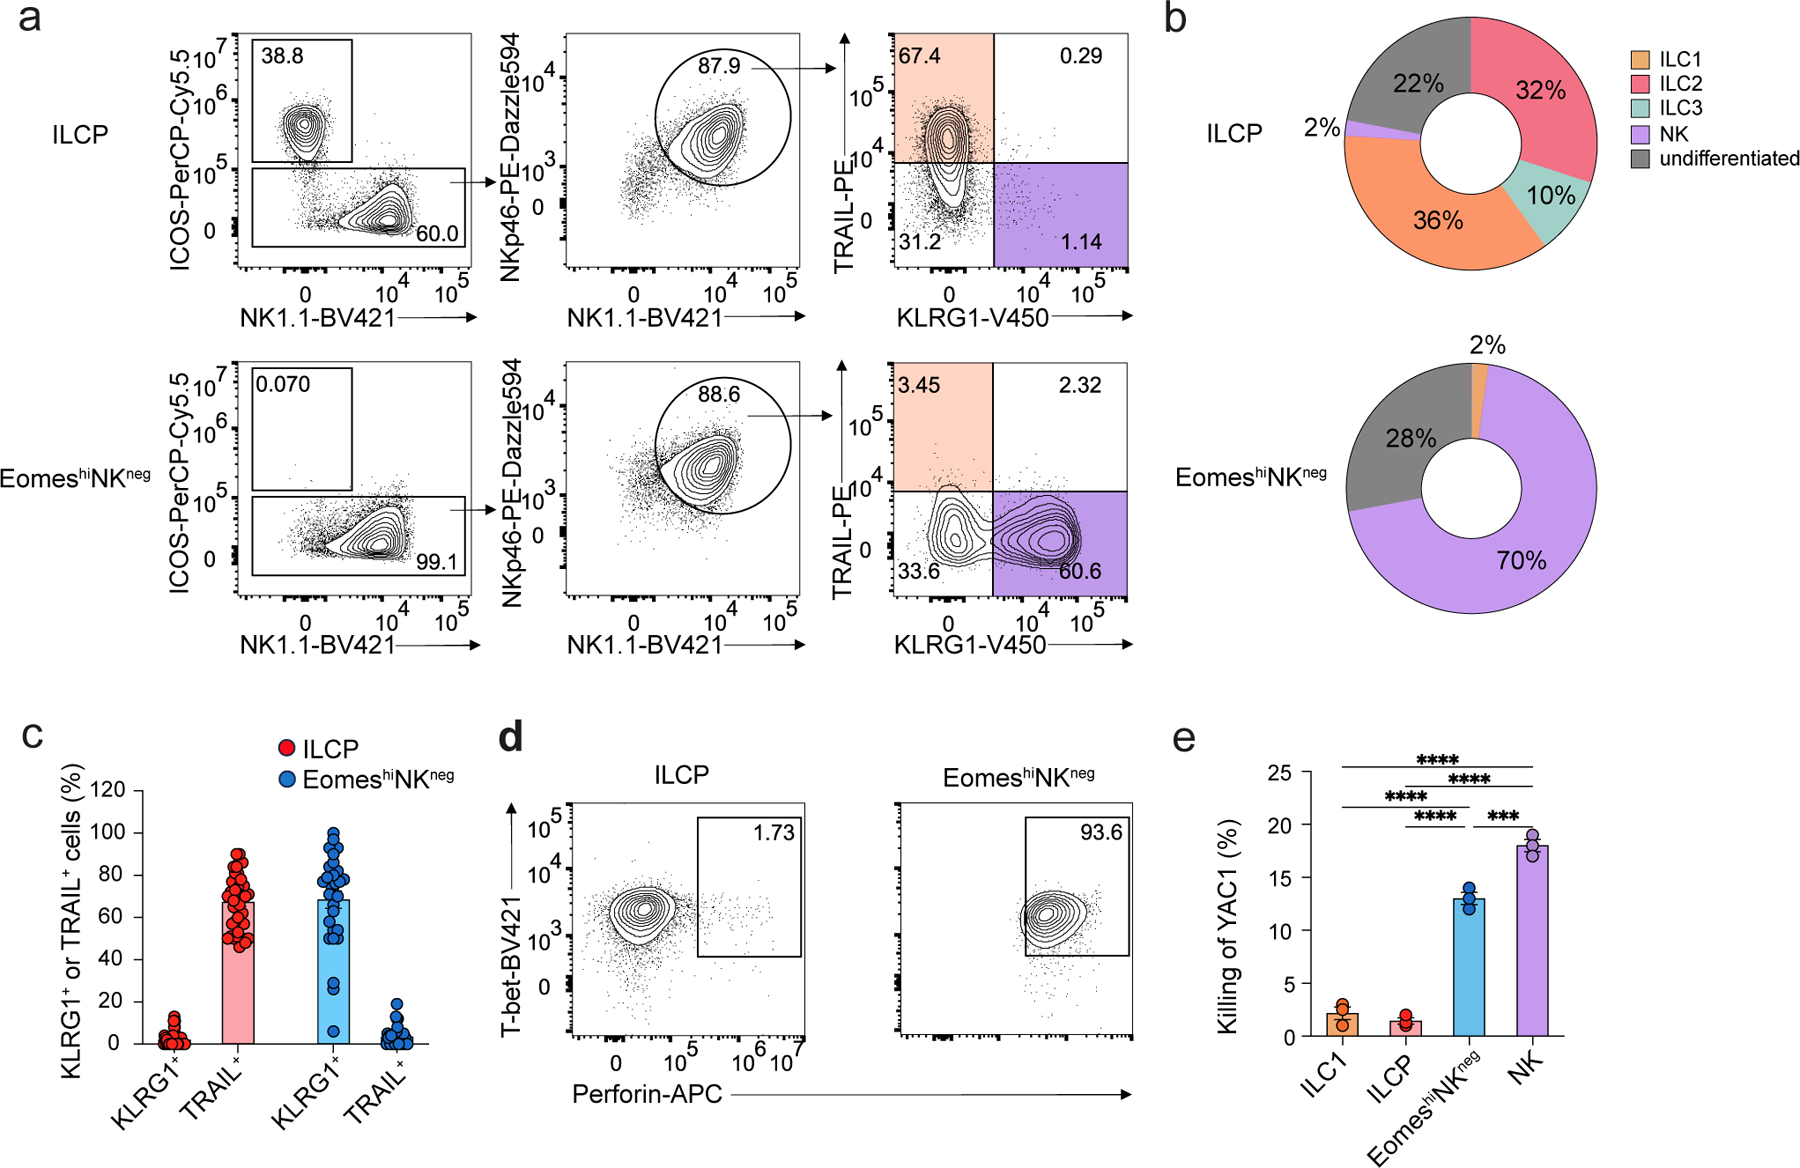
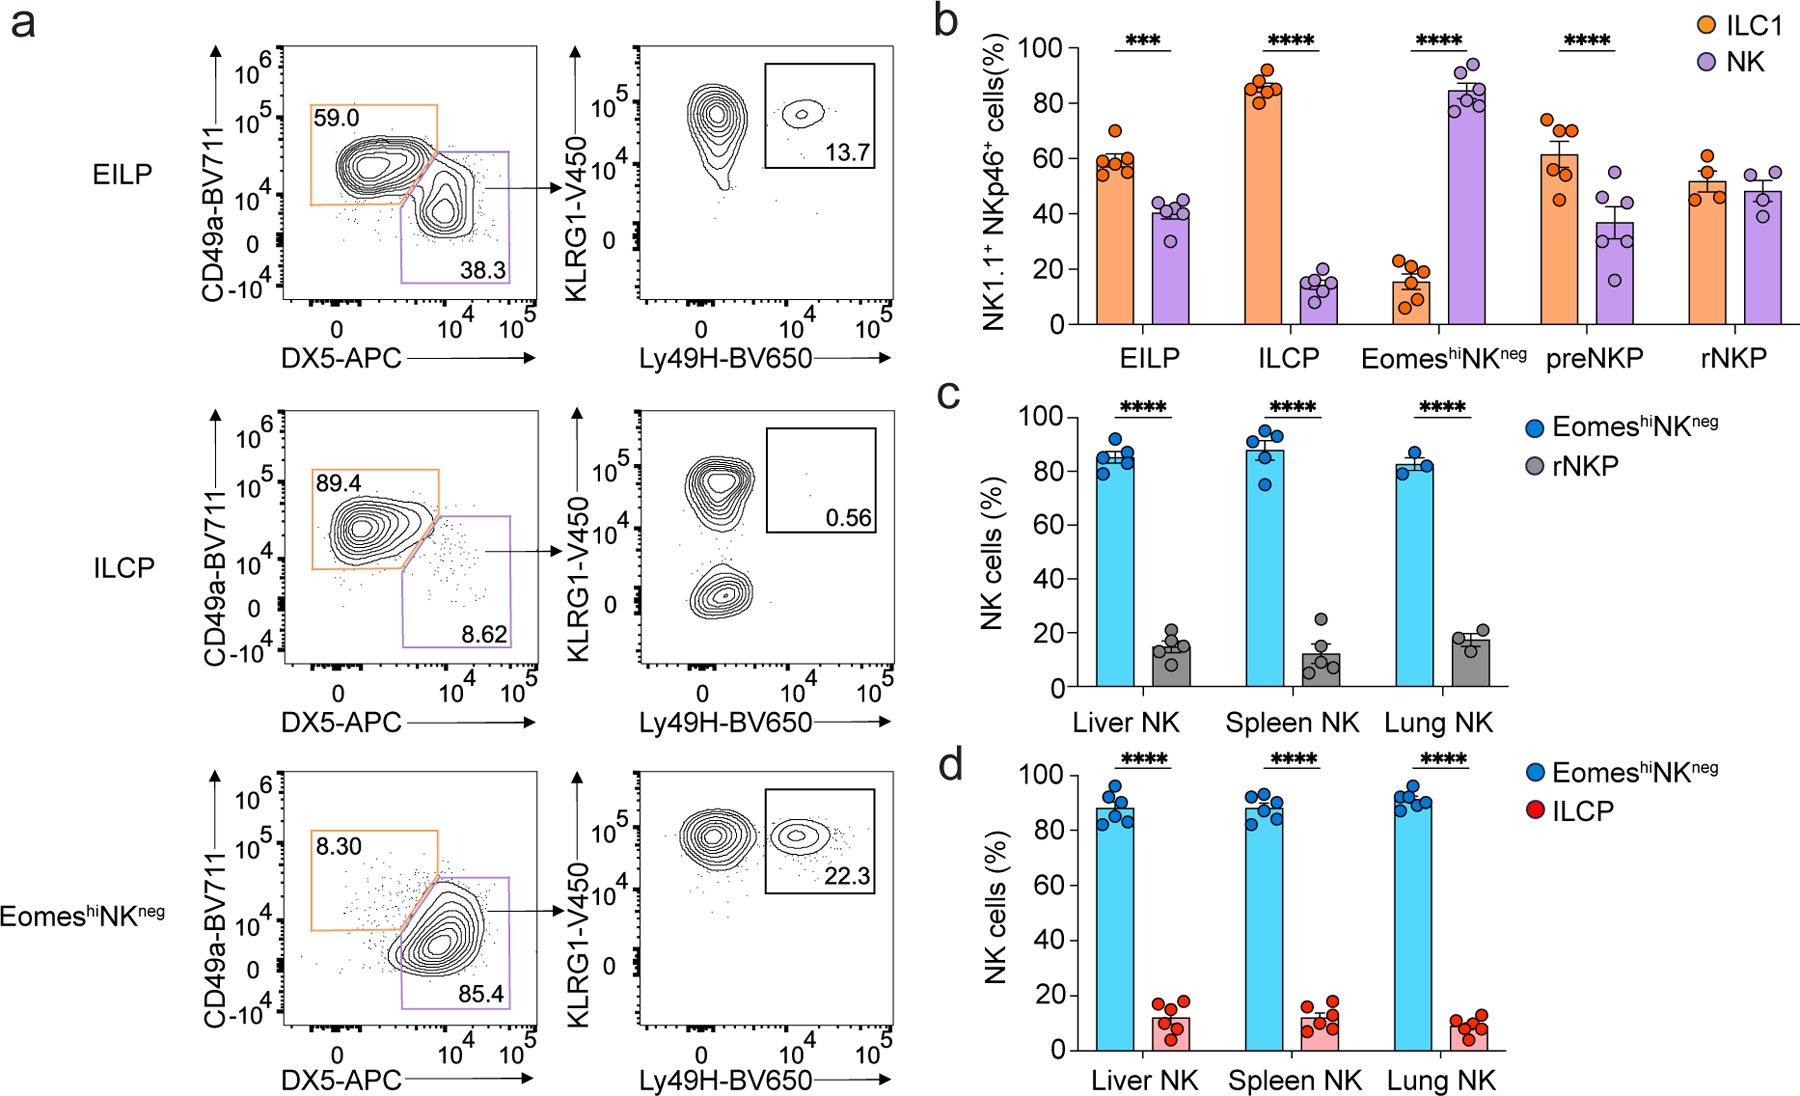
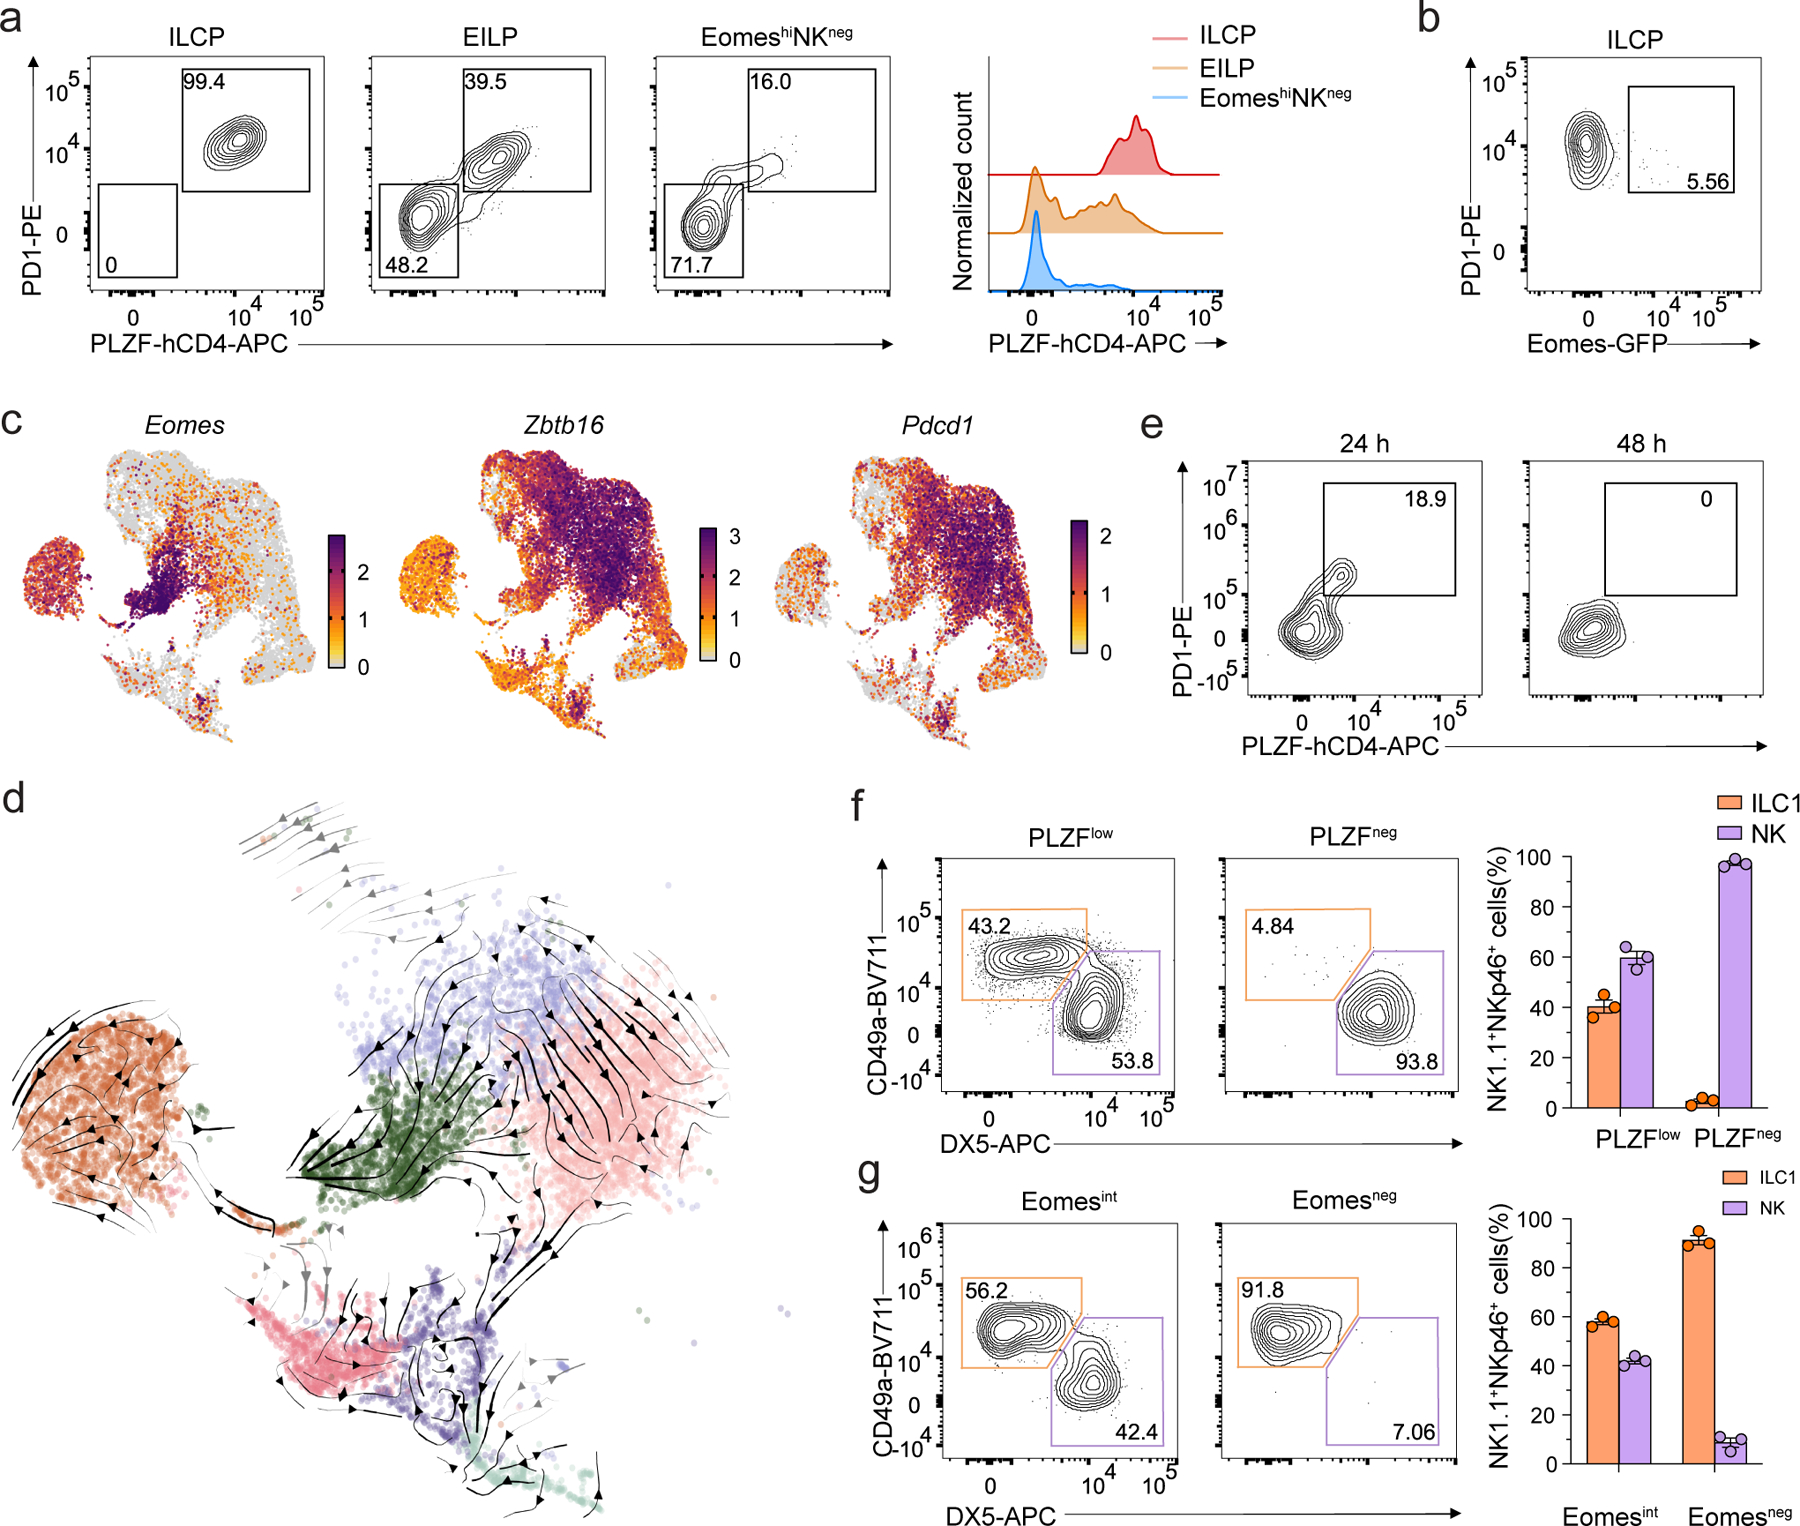
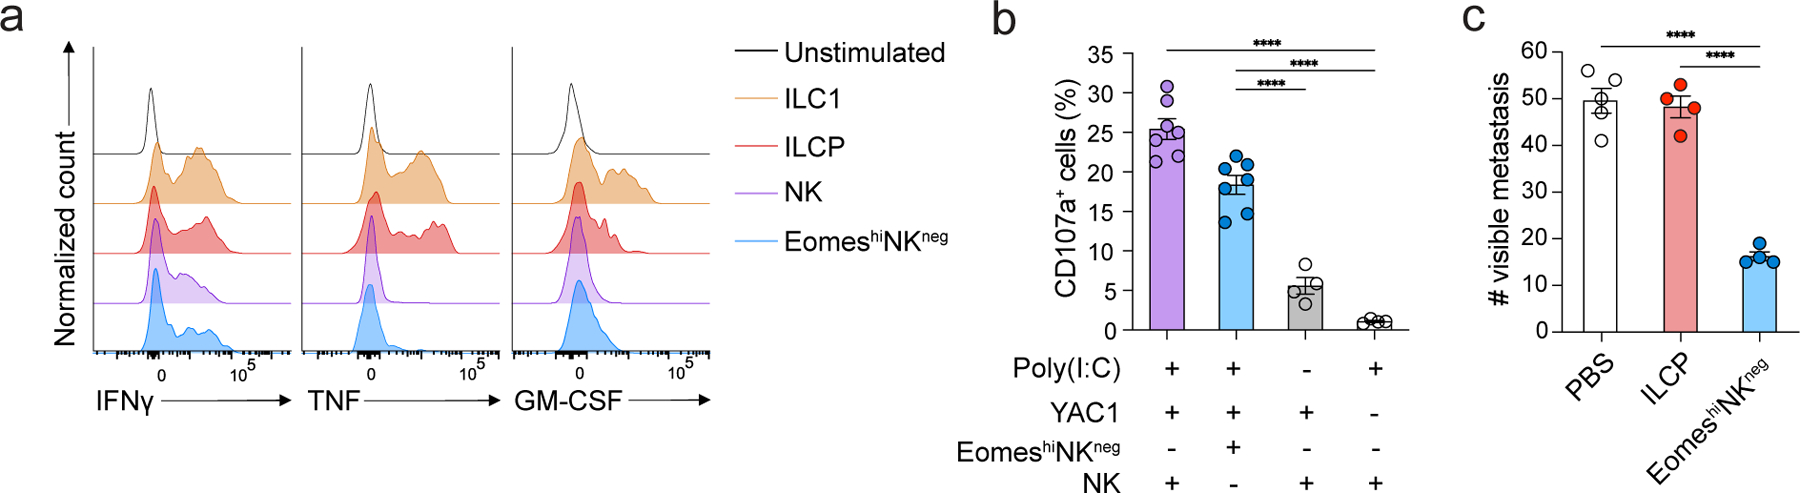
Natural killer (NK) cells traffic through the blood and mount cytolytic and interferon-γ (IFNγ)-focused responses to intracellular pathogens and tumors. Type 1 innate lymphoid cells (ILC1s) also produce type 1 cytokines but reside in tissues and are not cytotoxic. Whether these differences reflect discrete lineages or distinct states of a common cell type is not understood. Using single-cell RNA sequencing and flow cytometry, we focused on populations of TCF7+ cells that contained precursors for NK cells and ILC1s and identified a subset of bone marrow lineage-negative NK receptor-negative cells that expressed the transcription factor Eomes, termed EomeshiNKneg cells. Transfer of EomeshiNKneg cells into Rag2-/-Il2rg-/- recipients generated functional NK cells capable of preventing metastatic disease. By contrast, transfer of PLZF+ ILC precursors generated a mixture of ILC1s, ILC2s and ILC3s that lacked cytotoxic potential. These findings identified EomeshiNKneg cells as the bone marrow precursor to classical NK cells and demonstrated that the NK and ILC1 lineages diverged early during development.


Conflict of interest statement

Competing Interests

The authors declare no competing interests.

Figures

Extended Data Fig. 1.
Extended Data Fig. 1.. Gating strategies for BM precursors.
a, Gating strategy used for identifying NK1.1+Eomes-GFP+IL-7Rα NK cells, NK1.1+Eomes-GFPIL-7Rα+ ILC1s, NK1.1Eomes-GFP+Tcf7-mCherry+ EomeshiNKneg cells, Tcf7-mCherry+α4β7+CD244+IL-7RαCD90 EILPs, and Tcf7-mCherry+α4β7+CD244+IL-7Rα+CD90+PD1+ ILCPs among CD4CD8CD3εTCRβTCRγδCD19B220Gr1CD11cCD25Ter119(Lin) cells isolated from the BM of Tcf7mCherry/+EomesGFP/+Zbtb16hCD4/+RorcThy1.1/+ mouse by flow cytometry. b, Gating strategy used for identifying CD244+CD27+IL-7Rα+Flt3 preNKP and CD244+CD27+IL-7Rα+Flt3CD122+ rNKP among CD4CD8CD3εTCRβTCRγδCD19B220Gr1CD11cCD25Ter119(Lin) cells isolated from the BM of Tcf7mCherry/+EomesGFP/+Zbtb16hCD4/+RorcThy1.1/+ mouse by flow cytometry as in a.
Extended Data Fig. 2.
Extended Data Fig. 2.. scRNA-seq annotation and data filtering.
a, UMAP embedding of scRNA-seq data shows a combined total of 31,774 cells from the BM of 35 mice, with cells annotated by cluster (color, index number) if the cluster was removed prior to downstream analysis, and colored gray otherwise, i.e., if the cells were maintained for downstream analysis (e.g., Figs. 1–3, 7). b, Dot plot shows expression (dot color, size, as in Fig. 1b) of genes differentially expressed in annotated clusters (x axis) compared to all other clusters (“Other”) in the dataset. FDR-adjusted P < 0.05; abs. log2FC > 0.5. c, d, UMAP embedding as in a colored by the log10 of the total number of unique molecular identifiers (UMIs), indicating unique transcript molecules €, and by the log10 of the total number of unique genes encoded by the transcripts detected (d). e, f, UMAP embedding of filtered scRNA-seq data (as in Fig. 1a) colored by the log10 of the total number of unique molecular identifiers (UMIs), indicating unique transcript molecules €, and by the log10 of the total number of unique genes encoded by the transcripts detected (f). Points in c-f, corresponding to cells, are plotted in ascending order of their deviation from the median color value, such that the extreme values are displayed at the forefront. g, Violin plots show log of size-normalized expression (Methods) of curated genes in the Rorc+ APC cluster (Fig. 1a). Horizontal lines in violins denote the 25th percentile, median, and 75th percentile of normalized expression, while white diamonds denote the mean.
Extended Data Fig. 3.
Extended Data Fig. 3.. preNKP, rNKP, and aceNKP markers do not identify a transcriptionally distinct population in scRNA-seq data.
a,b, UMAP embeddings (as in Fig. 1a), with cells colored by normalized expression of pre-NKP and rNKP markers (a), and aceNKP markers (b).
Extended Data Fig. 4.
Extended Data Fig. 4.. EomeshiNKneg develop independently of PLZF.
a, Quantification of EomeshiNKneg cells in the BM of WT (n=3) and Zbtb16 +18/32Δ/Δ (n=4) mice. Data are representative of two independent experiments. Data represent mean ± s.e.m. b, Bar graph showing the relative abundance of BM Eomes+NK1.1+DX5+ NK cells and EomesNK1.1+DX5IL-7Rα+ ILC1s in WT (n=3) and Zbtb16 +18/32Δ/Δ (n=4) mice. Data are representative of two independent experiments. Data represent mean ± s.e.m.
Extended Data Fig. 5.
Extended Data Fig. 5.. NK cells emerge post-natally.
, UMAP clustering of high dimensional flow cytometry data and corresponding heatmap displaying relative expression DX5, L-selection, Eomes, KLRG1, CD49a, TRAIL, CD69 and CD200r among CD45+CD3εNK1.1+NKp46+ liver lymphocytes from 1–6 week-old mice. b, bar graph showing the number of DX5+CD49a NK cells (n=5) or DX5CD49a+ ILC1s (n=5) among CD45+CD3εNK1.1+NKp46+ liver lymphocytes of 1–6 week-old mice. Data are representative of three independent experiments. Data represent mean ± s.e.m. **P<0.01, ***P<0.001, ****P < 0.0001. c, bar graph showing the frequency of DX5+CD49a NK cells (n=4), DX5CD49a+ ILC1s (n=4) and DX5loCD49a+ undifferentiated cells (n=4) among CD45+CD3εNK1.1+NKp46+ liver lymphocytes from 1–6 week-old mice. Data are representative of two independent experiments. Data represent mean. d, UMAP clustering of high dimensional flow cytometry data showing the composition of DX5+CD49a NK cells and DX5CD49a+ ILC1s among CD45+CD3εNK1.1+NKp46+ liver lymphocytes from 1–6 week-old mice.
Extended Data Fig 6.
Extended Data Fig 6.. Instability of Eomes and DX5 in vitro.
a, Representative flow cytormetry plot expression of Eomes-GFP and DX5 on Eomes-GFPNK1.1+IL-7Rα+ ILC1s, α4β7+CD244+IL-7Rα+CD90+PD1+ ILCPs, EomeshiNKneg cells or Eomes-GFP+NK1.1+ NK cells on day 7 of co-culture with OP9 cells with IL2, IL7 and SCF. b, Bar graph showing DX5 expression on single NK cell (n=49) and single ILC1 (n=30) on day 7 of co-culture with OP9 cells with IL2, IL7 and SCF. Data represent mean ± s.e.m. c, Representative flow cytometry plot showing the reconstitution of CD3εCD19NK1.1+ NK cells (top) and NK1.1CD90+IL-7Rα+CD25+IL-33Rα+ ILC2s (bottom) in the lung of CD45.2/CD45.2 Rag2−/−IL2rg−/− mice at week 2 post-intravenous transfer of equal mixes of CD45.1/CD45.2 EomeshiNKneg cells and CD45.2/CD45.2 Tcf7-mCherry+α4β7+CD244+IL-7Rα+CD90+PD1+ ILCPs.
Extended Data Fig. 7.
Extended Data Fig. 7.. Comparison of scRNA-seq trajectory inference results.
a, PAGA graph shows degree of connectivity (line weight) between clusters (dots) from scRNA-seq data (Fig. 1). Thicker lines represent a stronger connection, while dot size scales with number of cells in cluster. b, UMAP embedding (colored by cluster, as in Fig. 1a) shows RNA velocity streamlines (arrows), indicating cellular state transitions inferred by scVelo from all cells (Methods). c, UMAP embedding (as in Fig. 7d), shows an overlaid grid of average RNA velocity vectors (arrows), as an alternative view of the streamline visualization of inferred cellular state transitions in Fig. 7d. d, UMAP embedding shows RNA velocity streamlines (as in b) indicating cellular state transitions inferred by TopicVelo from all cells (Methods).
Extended Data Fig. 8.
Extended Data Fig. 8.. Topic-specific cell weights and streamlines from TopicVelo analysis.
a, UMAP embeddings (as in Fig. 1a) of cells, colored by their weight for each of 11 “topics”, or gene programs, inferred (without supervision or prior knowledge) via a probabilistic topic modeling analysis. Titles indicate post hoc topic annotations, determined by literature-based associations with the genes differentially expressed in each topic (Methods, Supplementary Table 3). b, Close-ups of the UMAP embedding (colored by cluster, as in Fig. 1a) show RNA velocity streamlines (arrows) for curated topic-specific cellular state transitions (titles), inferred by TopicVelo from topic-specific cells (displayed in each close-up) and genes, and then integrated to compute the NK/ILC1-focused transition matrix (Fig. 7d, Extended Data Fig. 6c, Methods).
Extended Data Fig 9.
Extended Data Fig 9.. Eomes expression marks the loss of ILC2/3 potential.
a, Representative flow cytometry plots showing PLZFneg and PLZFlo EomeshiNKneg cell-derived NK1.1ICOS+ ILC2/ILC3s, NK1.1+ICOSTRAIL+KLRG1 ILC1-like cells and NK1.1+ICOSTRAILKLRG1+ NK-like cells on day 7 of co-culture with OP9 cells with IL-2, IL-7 and SCF. b, Representative flow cytometry plots showing Eomesneg and Eomesint ILCP cell-derived NK1.1ICOS+ ILC2/ILC3s, NK1.1+ICOSTRAIL+KLRG1 ILC1-like cells and NK1.1+ICOSTRAILKLRG1+ NK-like cells on day 7 of co-culture with OP9 cells with IL-2, IL-7 and SCF. c, Representative flow cytometry plot showing the reconstitution of CD3εCD19NK1.1+ NK cells (top) and NK1.1CD90+IL-7Rα+CD25+IL-33Rα+ ILC2s (bottom) in the lung of CD45.2/CD45.2 Rag2−/−γc−/− mice at week 2 post-intravenous transfer of equal mixes of CD45.1/CD45.2 PLZFloEomeshiNKneg cells and CD45.2/CD45.2 Tcf7-mCherry+α4β7+CD244+IL-7Rα+CD90+PD1+ ILCPs.
Extended Data Fig 10.
Extended Data Fig 10.. Model of innate lymphocyte development from BM precursors.
Downstream of CLP, Tcf7-expressing EILP gains the expression of an intermediate level of PLZF and develop into helper ILCs and NK cells. A fraction of EILPs upregulate Eomes expression to become NK/ILC1-restricted PLZFloEomeshiNKneg cells which can either further downregulate PLZF on the way to become NK cells or can lose both PLZF and Eomes expression to become ILC1s. Alternatively, a fraction of PLZFint EILPs can further upregulate PLZF to become ILCPs. These ILCPs can generate all ILC lineages. However, a small subset of ILCPs upregulate Eomes, lose ILC2/3 potential, and can generate NK cells or ILC1s. Created with BioRender.com.
Figure 1.
Figure 1.. Identification of Eomes+ cells in the mouse BM.
a, UMAP embedding of scRNA-seq data showing 19,961 CD4CD8CD3εTCRβTCRγδCD19B220Gr1CD11cCD25Ter119(Lin) Tcf7-mCherry+ cells and NK1.1+ cells sorted from the BM of 19 females and 16 males EomesGFP/+Tcf7mCherry/+Zbtb16hCD4/+RorcThy1.1/+ mice, annotated by cluster (color, index number). b, Dot plot showing the expression of curated genes that are differentially expressed in a cluster relative to all other cells in clusters as in a. FDR-adjusted P < 0.05; absolute value of the log2-fold change (abs. log2FC) > 0.5. Dot color: row z-scored, cluster average of log- and size-normalized gene counts (normalized expression). Dot size, percent of cells in cluster with positive expression of the gene. c, UMAP embeddings, colored by normalized expression of curated differentially expressed genes as in b.
Figure 2.
Figure 2.. EomeshiNKneg cells are distinct from NK cells and ILC1s.
a, Dot plot showing expression of select genes differentially expressed in Eomes+Tcf7int, NK, or ILC1 clusters, relative to the other two clusters in scRNA-seq data. FDR-adjusted P < 0.05; abs. log2FC > 0.5. Dot color, size, as in Fig. 1b. b, Representative flow cytometry plots of Eomes-GFP+NK1.1NKp46 cells (EomeshiNKneg) and Eomes-GFP+NK1.1+NKp46+ NK cells in BM CD4CD8CD3εTCRβTCRγδCD19B220Gr1CD11cCD25Ter119(Lin) CD45+ cells from EomesGFP mice. c, Representative histogram showing the expression of NK associated markers KLRG1, CD11b, DX5, NKG2A/C/E, NKG2D, CD244, CD27, perforin, granzyme B, Ly49H, Ly49C/F/I/H, TCF7, T-bet, L-selectin and IL-7Rα on EomeshiNKneg cells or NK cells from the BM of EomesGFP/+Tcf7mCherry/+ mice. Data are pooled from 2 independent experiments.
Figure 3.
Figure 3.. EomeshiNKneg cells are distinct from other progenitors.
a, Gating strategy used for the identification of EomeshiNKneg cells, Tcf7-mCherry+α4β7+CD244+IL-7RαCD90 EILPs, Tcf7-mCherry+α4β7+CD244+IL-7Rα+CD90+PD1+ ILCPs in the BM of Tcf7mCherry/+EomesGFP/+Zbtb16hCD4/+RorcThy1.1/+ mice by flow cytometry. Gated on Lin cells as shown in Extended Data 1. b, High-dimensional flow cytometry embedding of BM precursors, shown as UMAP with FlowSOM clustering among cell populations selected as in a. c, Number of EILPs (n=7), ILCPs (n=7), EomeshiNKneg cells (n=7), preNKPs (n=6), rNKPs (n=7) isolated from the BM of 4-week-old Tcf7mCherry/+EomesGFP/+Zbtb16hCD4/+RorcThy1.1/+ mice. Data are pooled from 7 independent experiments, data represent mean ± s.e.m. d, Heatmap showing relative expression of α4β7, PD1, PLZF, CD90, IL-7Rα, Eomes and CD122 in EILPs, ILCPs and EomeshiNKneg clusters as in b. e, Dot plot showing expression of genes differentially expressed in EILP (cluster 0), ILCP (cluster 1) or Eomes+Tcf7int (cluster 4) relative to the other two clusters in scRNA-seq. FDR-adjusted P < 0.05; abs. log2FC > 0.5. Dot color, size, as in Fig. 1b. f, Bar graph showing the frequency of PLZF-fate mapped YFP+ fraction in liver GR1+ myeloid cells (n=7), spleen CD3ε+Cd1d-tetramer+ NKT cells (n=7), spleen CD19+ B cells (n=7), spleen CD3ε+ T cells (n=7), liver CD3εNK1.1+DX5CD49a+ ILC1 (n=7), liver CD3εNK1.1+DX5+CD49a NK cells (n=7), BM EomeshiNKneg cells (n=6) in radiation chimeras reconstituted with YFP Lin Sca-1+ cKit+ BM LSK cells from PLZFGFP-Cre/+ ROSA26fl-STOP-fl-YFP/+ mice. Data are pooled from 4 independent experiments. Data represent mean ± s.e.m.
Figure 4.
Figure 4.. EomeshiNKneg cells emerge post-natally.
a, Representative flow cytometry plot showing the frequency of Eomes-GFP+NK1.1 EomeshiNKneg cells, Eomes-GFP+NK1.1+ NK cells and Eomes-GFPNK1.1+ ILC1s in LinCD45+ lymphocytes isolated from fetal liver at embryonic day 14.5 (E14.5; pooled samples from 9 fetus) and the BM of 4-week-old Tcf7mCherry/+EomesGFP/+ mice. b, Bar graph showing number of Eomes-GFP+NK1.1 cells (EomeshiNKneg), Tcf7-mCherry+α4β7+CD244+IL-7Rα+CD90+PD1+ ILCPs, Eomes-GFP+NK1.1+ NK cells and Eomes-GFPNK1.1+ ILC1s in the E14.5 fetal liver (n=5) or 1–4 week old BM (n=5) of Tcf7mCherry/+EomesGFP/+ mice. Data are representative of two independent experiments. Statistical significance was calculated by two-way ANOVA with Tukey’s multiple comparisons test. Data represent mean ± s.e.m. *P < 0.05. **P < 0.01. ****P < 0.0001.
Figure 5.
Figure 5.. EomeshiNKneg cells generate functional NK cells in vitro.
a, Representative flow cytometry plots showing ILCP- and EomeshiNKneg cell-derived NK1.1ICOS+ ILC2/ILC3s, NK1.1+ICOSTRAIL+KLRG1 ILC1s and NK1.1+ICOSTRAILKLRG1+ NK cells on day 7 of co-culture with OP9 cells with IL-2, IL-7 and SCF. b, Pie chart showing the average frequency of NK1.1ICOS+Rorc-Thy1.1 ILC2s, NK1.1Rorc-Thy1.1+ ILC3s, NK1.1+ICOSTRAIL+KLRG1 ILC1s, NK1.1+ICOSTRAILKLRG1+ NK cells and NK1.1+ICOSTRAILKLRG1 undifferentiated cells in ILCP or EomeshiNKneg cell-derived progenies at day 7 as in a. Data are representative of three independent experiments. c, Bar graph showing the expression of TRAIL and KLRG1 on NK1.1+ICOS cells derived from single ILCP (n=37) or EomeshiNKneg cells (n=19) at day 7 as in a. d, Intracellular staining of Tbet and perforin in ILCP- or EomeshiNKneg cell-derived NK1.1+ICOSNkp46+ cells at day 7 of culture as in a. e, Percentage of efficiency of killing of YAC1 tumor cells cultured at 1:1 ratio with NK1.1+ICOS cells derived from Eomes-GFPNK1.1+IL-7Rα+ ILC1s (n=3), α4β7+CD244+IL-7Rα+CD90+PD1+ ILCPs (n=3), EomeshiNKneg cells (n=3) or Eomes-GFP+NK1.1+ NK cells (n=3) sorted from the BM of EomesGFP mice, co-cultured with OP9 cells with IL-2, IL-7, SCF for 6 days and stimulated with IL-15 overnight. Statistical significance was calculated by two-way ANOVA with Tukey’s multiple comparisons test. Data represent mean ± s.e.m. ***P<0.001, ****P < 0.0001
Figure 6.
Figure 6.. EomeshiNKneg cells are precursors committed to the NK cell lineage.
a, Representative flow cytometry of DX5CD49a+ ILC1s and DX5+CD49aKLRG1+Ly49H+ NK cells within the CD3εTCRbNK1.1+NKp46+ cell compartment in the liver of CD45.2/CD45.2 Rag2−/−IL2rg−/− mice intravenously transferred with equal mixes of CD45.1/CD45.2 EomeshiNKneg cells and CD45.2/CD45.2 Tcf7-mCherry+α4β7+CD244+IL-7RαCD90 EILPs, Tcf7-mCherry+α4β7+CD244+IL-7Rα+CD90+PD1+ ILCPs, CD244+CD27+IL7R+Flt3CD122 pre-NKPs and CD244+CD27+IL-7Rα+Flt3CD122+ rNKPs at week 2 post-transfer. b, Frequency of reconstituted DX5CD49a+ ILC1s and DX5+CD49a NK cells in the liver of Rag2−/−IL2rg−/− mice transferred with EILPs (n=6), ILCPs (n=6), EomeshiNKneg cells (n=8), preNKPs (n=4) and rNKPs (n=4) as in a, at week 2 post-transfer. Data represent mean ± s.e.m. ***P = 0.0008, ****P < 0.0001. Data are representative of five independent experiments. c, Relative contribution of CD45.1/CD45.2 EomeshiNKneg cells and CD45.2/CD45.2 rNKPs to the reconstitution of CD3εNK1.1+NKp46+DX5+CD49a NK cells in the liver (n=5), spleen (n=5) and lung (n=3) of Rag2−/−IL2rg−/− mice transferred with an equal mix of precursor cells as in a, at week 2 post-transfer. Data are representative of two independent experiments. Data represent mean ± s.e.m. ****P < 0.0001. d, Relative contribution of CD45.1/CD45.2 EomeshiNKneg cells and CD45.2/CD45.2 ILCPs to CD3εNK1.1+NKp46+DX5+CD49a NK cells in the liver (n=6), spleen (n=6) and lung (n=6) of Rag2−/−IL2rg−/− mice transferred with an equal mix of precursor cells as in a, at week 2 post-transfer. Data are representative of three independent experiments. Data represent mean ± s.e.m. ****P < 0.0001.
Figure 7.
Figure 7.. PLZF+Eomes+ cells have both ILC1 and NK potential.
a, Representative flow cytometry showing PD1 by PLZF staining (left) and histogram of PLZF expression (right) on Tcf7-mCherry+α4β7+CD244+IL-7Rα+CD90+PD1+ ILCPs, EomeshiNKneg cells and Tcf7-mCherry+α4β7+CD244+IL-7RαCD90 EILPs from the BM of Tcf7mCherry/+EomesGFP/+Zbtb16hCD4/+RorcThy1.1/+ mice. b, Representative flow cytometry plot of PLZF and Eomes expression in ILCPs as in a. c, UMAP embedding of scRNA-seq data as in Fig. 1a, with cells colored by normalized expression of Eomes, Zbtb16, and Pdcd1. d, Close-up of UMAP embedding colored by cluster, as in Fig. 1a, focused on cells with relatively high expression of gene programs relating to NK, ILC1, ILCP, and Eomes+Tcf7int populations (Methods). Arrows, overlaid RNA velocity streamlines indicating the cellular state transitions inferred by TopicVelo from the displayed cells (Methods, Supplementary Fig. 2,3). Arrows are colored gray over very low density UMAP regions and otherwise black. e, Representative flow cytometry plot of PD1 and PLZF expression on PLZFloEomeshiNKneg cells isolated from BM of Tcf7mCherry/+EomesGFP/+Zbtb16hCD4/+RorcThy1.1/+ mice and cultured on OP9 cells with IL-2, IL-7 and SCF at 24 and 48 hours of co-culture. f, Representative flow cytometry plot (left) and quantification (right) of CD3εNK1.1+DX5CD49a+ ILC1s and CD3εNK1.1+DX5+CD49a NK cells in the liver of CD45.2/CD45.2 Rag2−/−IL2rg−/− mice transferred with equal mixes of CD45.1/CD45.2 PLZFloEomeshiNKneg or PLZFnegEomeshiNKneg cells and CD45.2/CD45.2 ILCPs, at week 2 post transfer (n=3). Data represent mean ± s.e.m. g, Representative flow cytometry plot (left) and quantification (right) of CD3εNK1.1+DX5CD49a+ ILC1s and CD3εNK1.1+DX5+CD49a NK cells in the liver of CD45.2/CD45.2 Rag2−/−IL2rg−/− mice transferred with equal mixes of CD45.1/CD45.2 Eomesint ILCPs and CD45.2/CD45.2 Eomesneg ILCPs at week 2 post transfer (n=3). Data are representative of three independent experiments. Data represent mean ± s.e.m.
Figure 8.
Figure 8.. EomeshiNKneg cells give rise to functional NK cells in vivo.
a, Intracellular ex vivo staining of TNF, GM-CSF and IFNγ after PMA and ionomycin stimulation for 4 hours of CD3εCD19NK1.1+NKp46+ cells isolated from the liver of Rag2−/−IL2rg−/− mice transferred with ILCPs or EomeshiNKneg cells 2 weeks before analysis or liver CD3εNK1.1+DX5CD49a+ ILC1 and CD3εNK1.1+DX5+CD49a NK cells isolated from age-matched EomesGFP mice as controls. b, Degranulation (measured as percentage of CD107a expression) of CD45.1/CD45.2 CD3εNK1.1+ NK cells isolated from the spleen of CD45.2/CD45.2 Rag2−/−IL2rg−/− mice at week 2 post-intravenous injection with CD45.1/CD45.2 EomeshiNKneg cells and 18 hours post-priming with 200 μg of polyinosinic:polycytidylic acid and incubated ex vivo with YAC1 tumor cells at a ratio of 1:1 for 4h. Data are representative of three independent experiments. Data represent mean ± s.e.m. ****P < 0.0001. c, Quantification metastases in the lung right inferior lobe of Rag2−/−IL2rg−/− mice at day 12 post-intravenous injection with 50,000 B16-F10 cells in Rag2−/−IL2rg−/− mice were intravenously transferred with PBS control (n=5), ~800 ILCPs (n=3) or EomeshiNKneg cells (n=4) 10 days before the transfer of tumor cells. Data are representative of three independent experiments. Statistical significance was calculated by two-way ANOVA with Tukey’s multiple comparisons test. Data represent mean ± s.e.m. ****P < 0.0001.

References

    1. Vivier E et al. Innate or adaptive immunity? The example of natural killer cells. Science 331, 44–49 (2011). - PMC - PubMed
    1. Vivier E et al. Innate Lymphoid Cells: 10 Years On. Cell 174, 1054–1066 (2018). - PubMed
    1. Colonna M Innate Lymphoid Cells: Diversity, Plasticity, and Unique Functions in Immunity. Immunity 48, 1104–1117 (2018). - PMC - PubMed
    1. Cortez VS & Colonna M Diversity and function of group 1 innate lymphoid cells. Immunol Lett 179, 19–24 (2016). - PMC - PubMed
    1. Constantinides MG, McDonald BD, Verhoef PA & Bendelac A A committed precursor to innate lymphoid cells. Nature 508, 397–401 (2014). - PMC - PubMed