. 2024 Jul;25(7):1183-1192.
doi: 10.1038/s41590-024-01865-2. Epub 2024 Jun 13.

Distinct developmental pathways generate functionally distinct populations of natural killer cells

Affiliations

Distinct developmental pathways generate functionally distinct populations of natural killer cells

Yi Ding et al. Nat Immunol. 2024 Jul.

Erratum in

Abstract

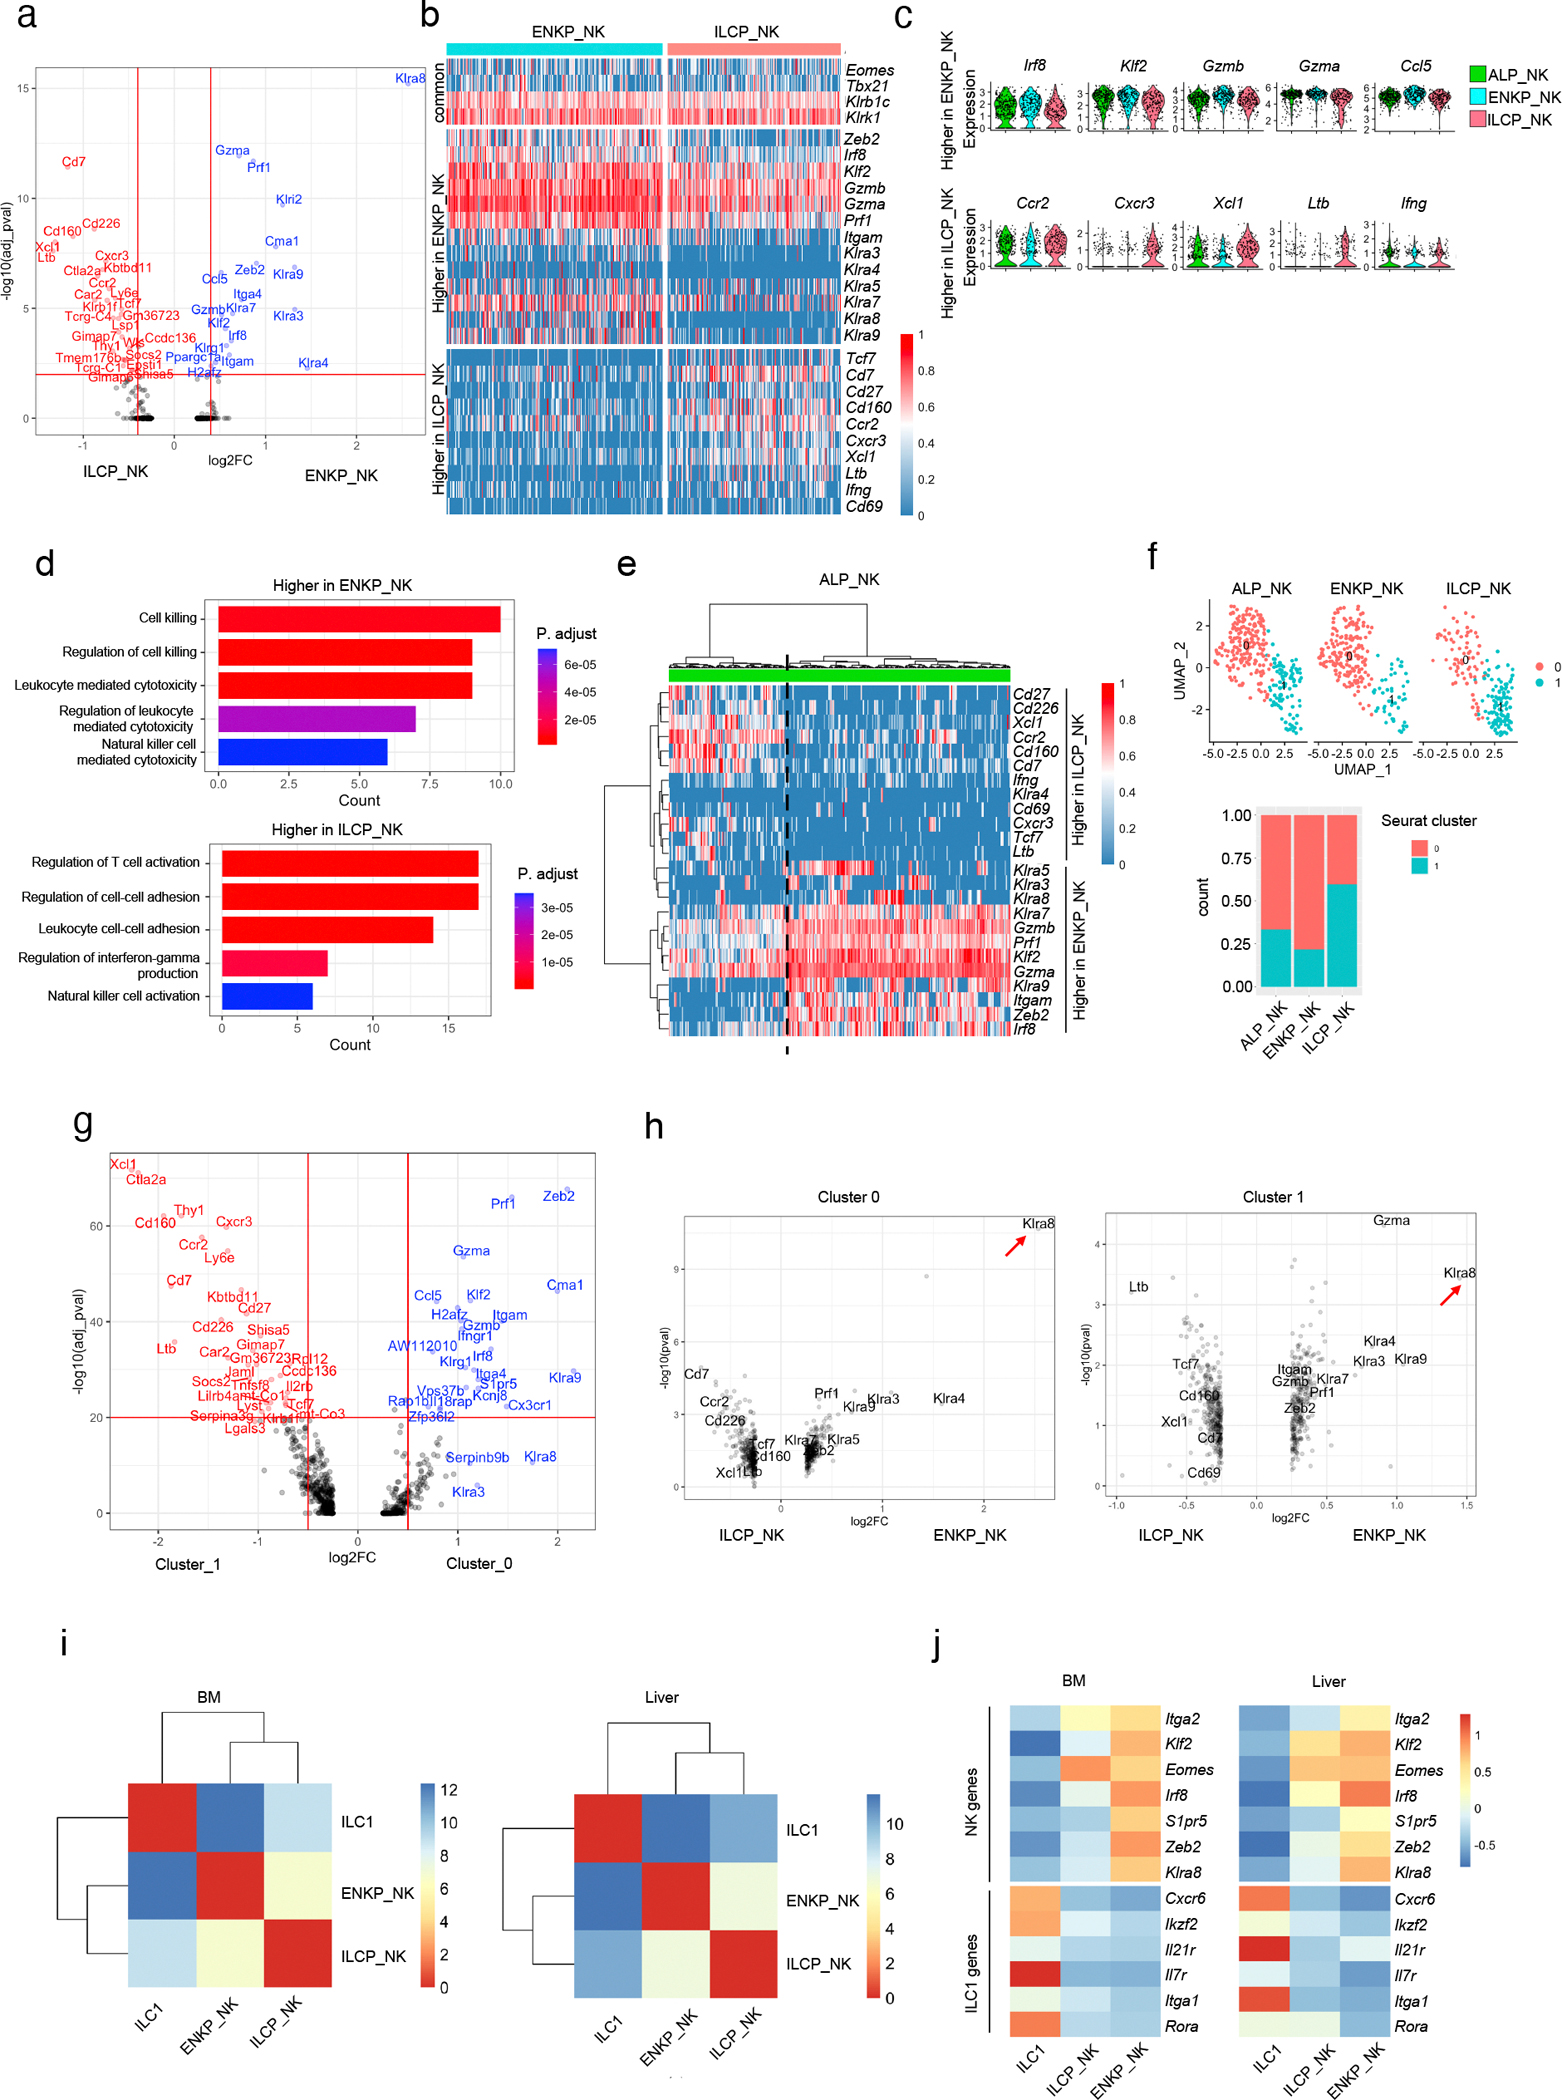
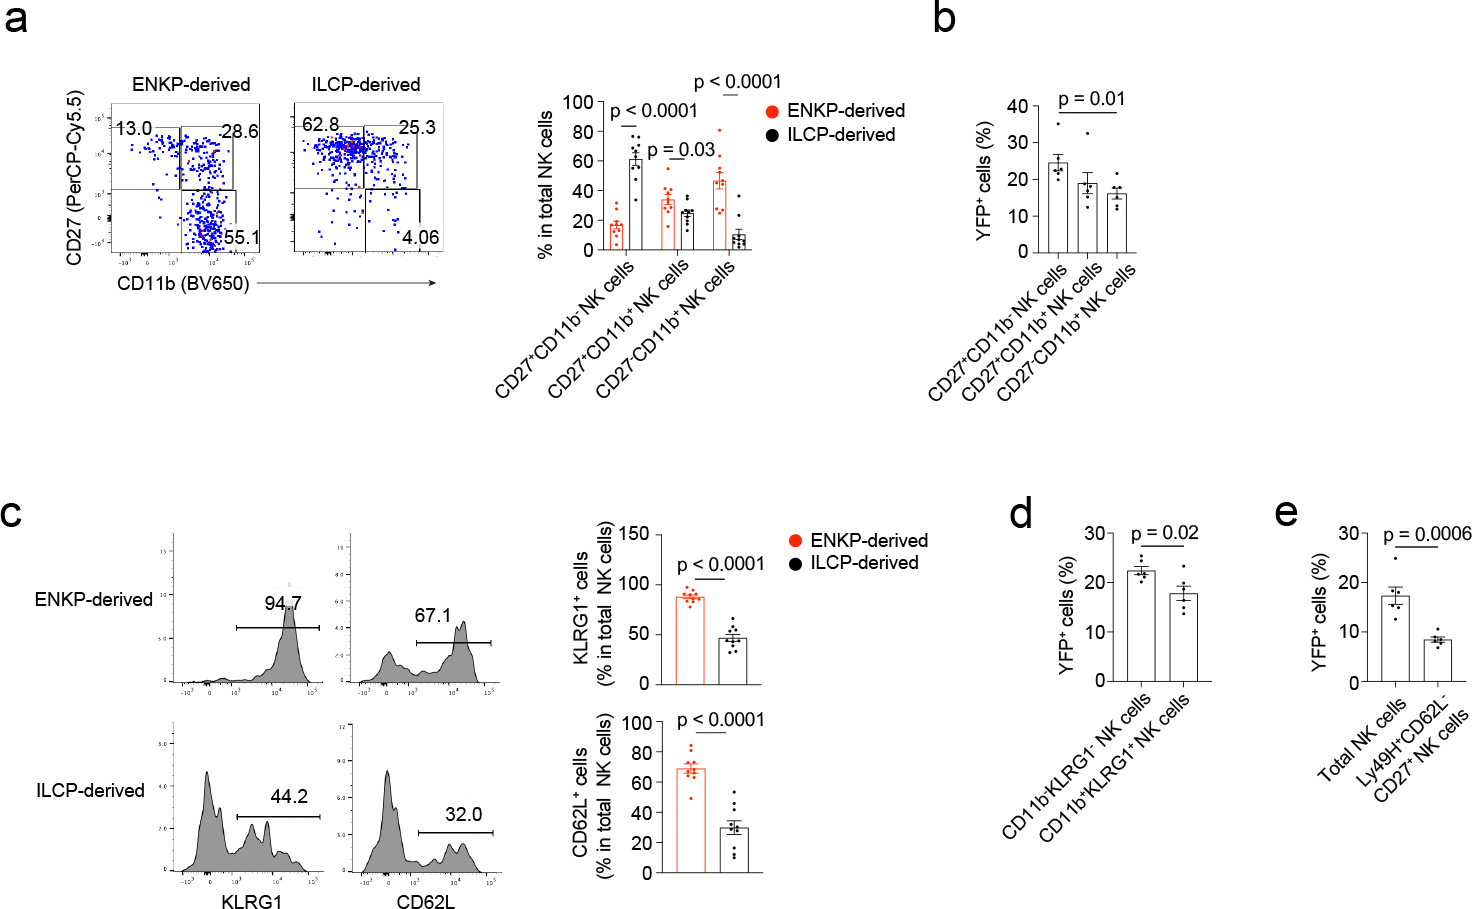
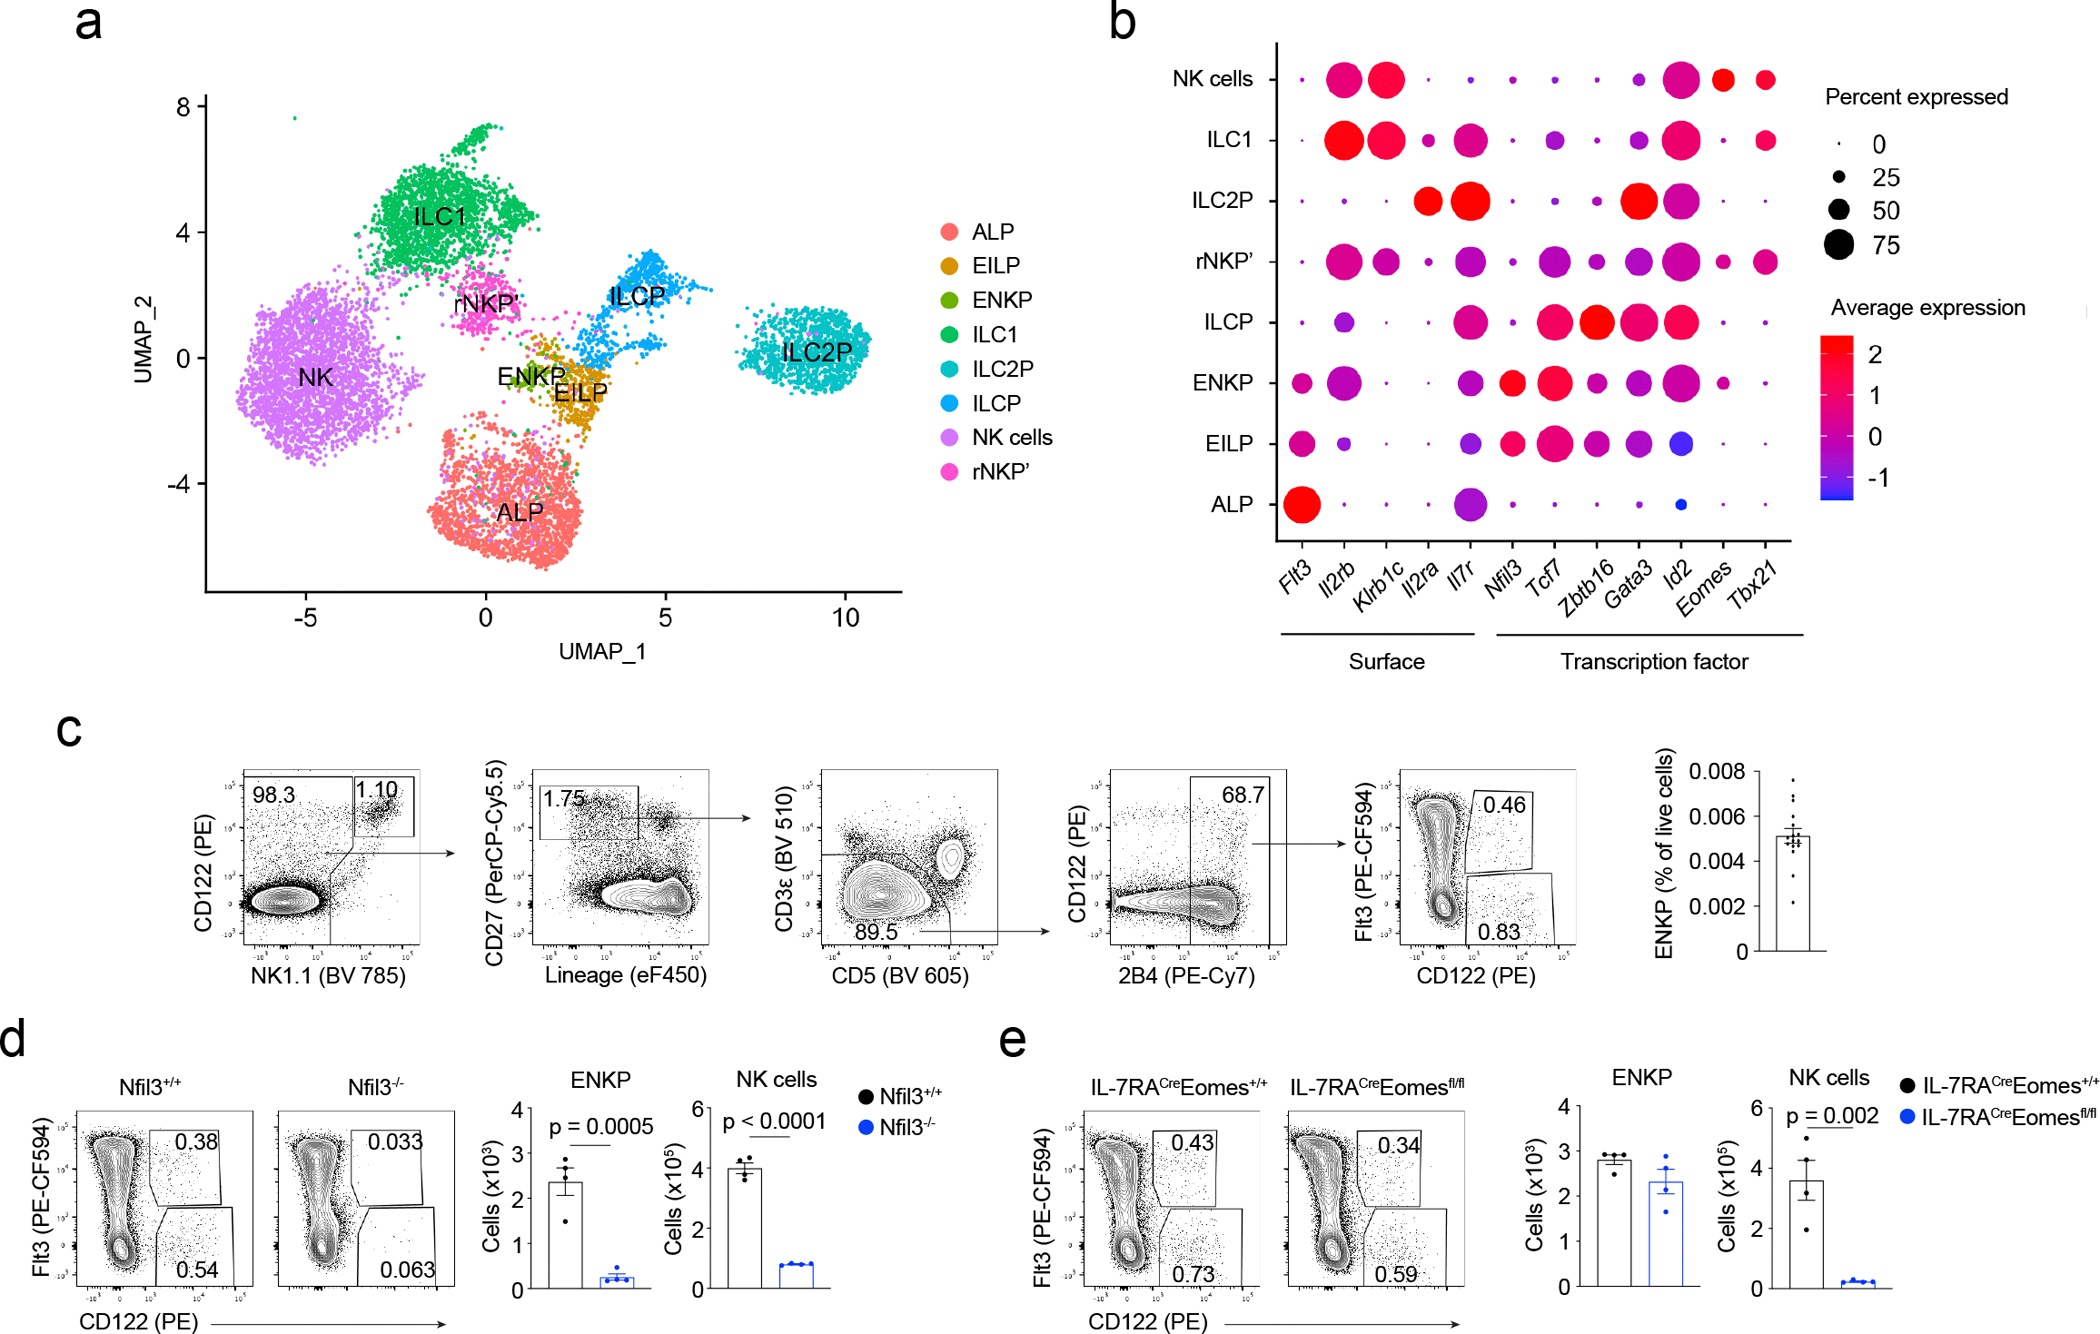
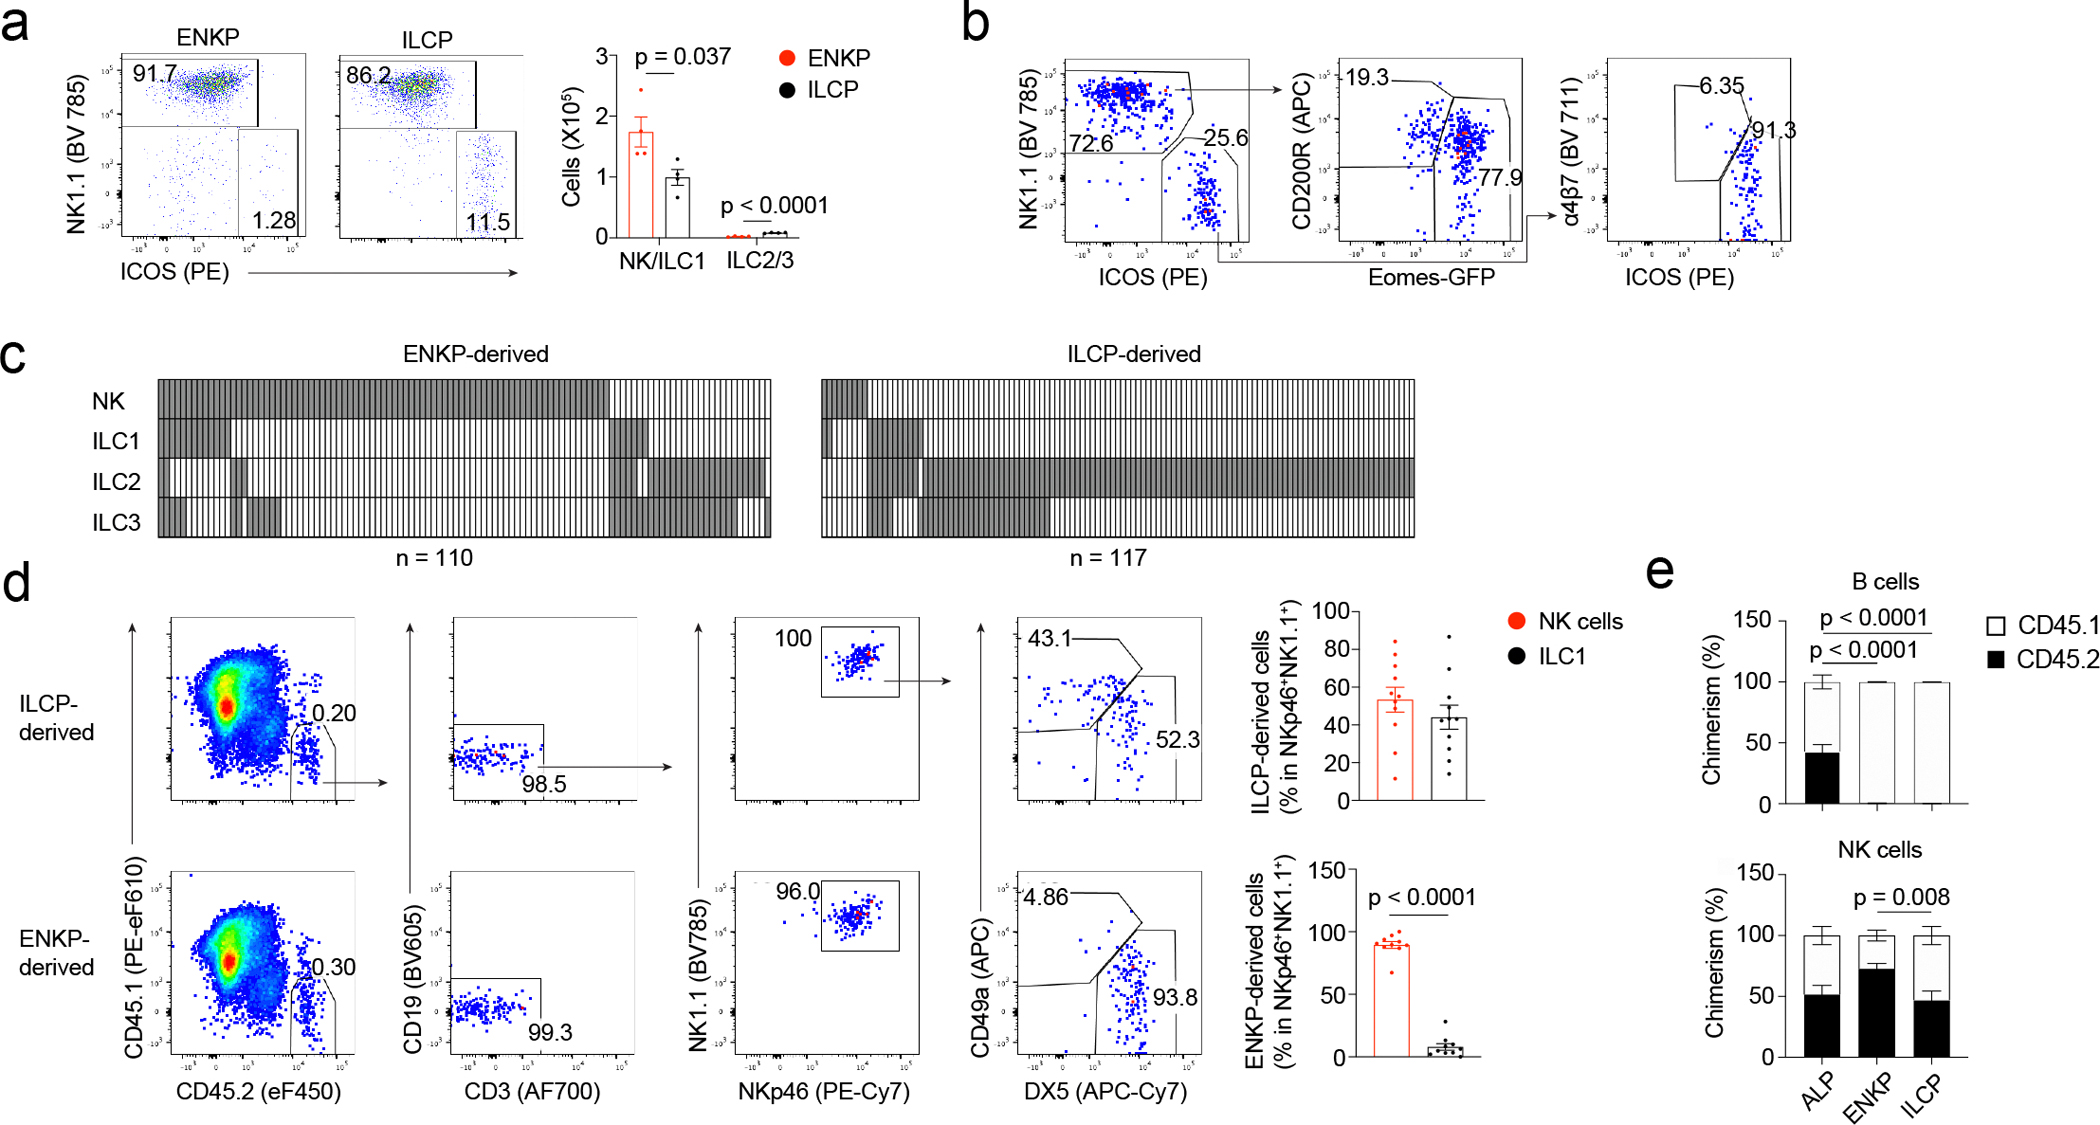
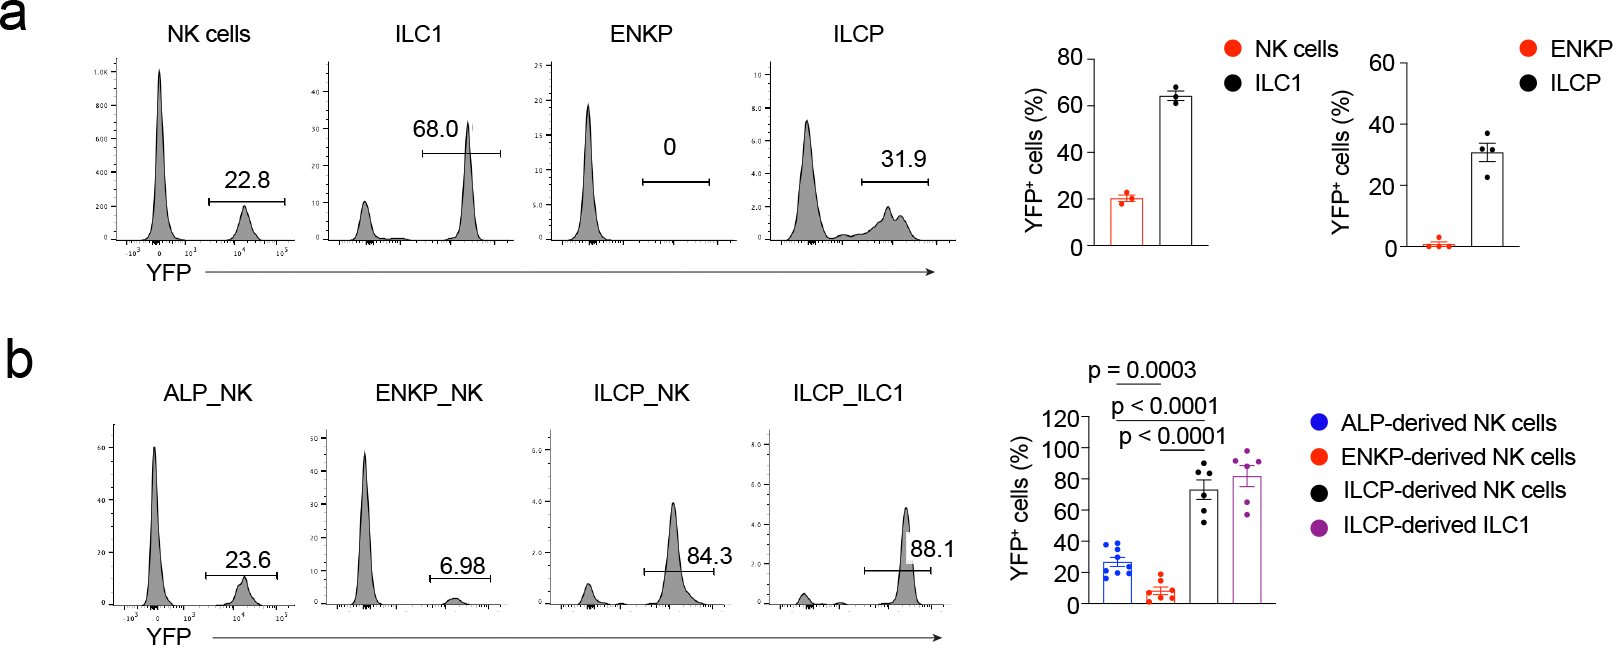
Natural killer (NK) cells function by eliminating virus-infected or tumor cells. Here we identified an NK-lineage-biased progenitor population, referred to as early NK progenitors (ENKPs), which developed into NK cells independently of common precursors for innate lymphoid cells (ILCPs). ENKP-derived NK cells (ENKP_NK cells) and ILCP-derived NK cells (ILCP_NK cells) were transcriptionally different. We devised combinations of surface markers that identified highly enriched ENKP_NK and ILCP_NK cell populations in wild-type mice. Furthermore, Ly49H+ NK cells that responded to mouse cytomegalovirus infection primarily developed from ENKPs, whereas ILCP_NK cells were better IFNγ producers after infection with Salmonella and herpes simplex virus. Human CD56dim and CD56bright NK cells were transcriptionally similar to ENKP_NK cells and ILCP_NK cells, respectively. Our findings establish the existence of two pathways of NK cell development that generate functionally distinct NK cell subsets in mice and further suggest these pathways may be conserved in humans.


Conflict of interest statement

Competing interests

Authors declare that they have no competing interests.

Figures

Extended Data Fig. 1
Extended Data Fig. 1. Characterization of early NK cell development in bone marrow.
a, Gating strategy for sorting ALP, EILP, ILCP, ILC2P, CD122+ progenitor, NK cell and ILC1 from bone marrow for scRNA-seq. b, UMAP of scRNA-seq samples grouped by original idents. c, Feature plots of genes critical for identifying UMAP clusters. d, Violin plots of ENKP and NK cluster. e, Slingshot pseudotime and heatmap of gene expression ordered by pseudotime.
Extended Data Fig. 2
Extended Data Fig. 2. Characterization of ENKPs.
a, Representative flow plots of ENKPs and quantification of ENKPs and NK cells in bone marrow of Tcf7-deficient mice (n = 3) and control mice (n = 5). Combined data from 2 independent experiments. b, Representative flow plots of ENKPs and quantification of ENKPs and NK cells in bone marrow of Gata3-deficient mice, n = 5. Combined data from 2 independent experiments. c, Representative histograms of surface marker expression by different progenitors from 2 independent experiments. d, Quantifications of Il7r-lineage tracing ratios in ENKPs and NK cells in bone marrow, n = 5. Representative data from 3 independent experiments. For a, b and d, data are mean ± s.e.m. For a and b, statistical analysis was performed using two-tailed unpaired Student’s t-tests.
Extended Data Fig. 3
Extended Data Fig. 3. Assessment of lineage potential of ENKPs.
a, Representative flow plots of in vitro cultured NK cells (CD3CD19NKp46+NK1.1+CD49aDX5+EomesGFP+) and ILC1s (CD3CD19NKp46+NK1.1+CD49a+DX5 EomesGFP−) sorted from spleen and liver of EomesGFP mice from 2 independent experiments. b, Representative flow plots of in vitro clonal assay. c, Quantification of in vitro differentiated NK cells, comparing progenitors and mature NK cells, n = 4. NK cells were defined as NK1.1+EomesGFP+CD220R. Representative data from 2 independent experiments. d, Quantification of in vitro differentiated NK cells, comparing with and without Flt3L, n = 4. NK cells were defined as NK1.1+EomesGFP+CD220R. Representative data from 2 independent experiments. e, Quantification of NK cell chimerism after competitive assay in liver combined from 2 independent experiments (same strategy as in Fig. 2e). ALP group, n = 5; ENKP group, n = 5; ILCP group, n = 4. f - h, Representative flow plots of post-sort purity check for ENKP (f), ILCP (g) and ALP (h). i, Quantification of total spleen NK cells and ILC1s derived from control or Eomes-deficient progenitors combined from 2 independent experiments. ENKP-derived NK, n = 5; ILCP-derived NK and ILC1, n = 9. For c, d, e, i, data are mean ± s.e.m., and statistical analysis was performed using two-tailed unpaired Student’s t-tests.
Extended Data Fig. 4
Extended Data Fig. 4. ENKP_NK and ILCP_NK are transcriptionally different.
a, Volcano plot of differentially expressed genes between ENKP_NK cells and ILCP_NK cells. b, Heatmap of genes equally expressed (upper) and differentially expressed between ENKP_NK and ILCP_NK (middle and lower). Each column represents one cell. c, Violin plots of genes expressed higher in ENKP_NK (upper) and higher in ILCP_NK (lower) grouped by developmental origins. d, GO enrichment analysis using genes expressed higher in ENKP_NK cells (upper) or ILCP_NK cells (lower). e, Hierarchically clustered heatmap of gene expression levels of genes differentially expressed between ENKP_NK cells and ILCP_NK cells in ALP_NK cells. Each column represents one cell. Dashed line indicates separation between two major column clusters. f, UMAP and bar plot of scRNA-seq of progenitor-derived NK cells grouped by developmental origins. g, Volcano plot of differentially expressed genes between cluster 0 and cluster 1. h, Volcano plot of differentially expressed genes between ENKP_NK and ILCP_NK in cluster 0 (left) and in cluster 1 (right). Arrow highlights the gene “Klra8”. i, Hierarchically clustered Euclidean distance matrix of transcriptomes of NK cells and ILC1s in bone marrow (left) and liver (right). j, Heatmap of select genes (see Methods) differentially expressed between NK cells and ILC1s in ENKP_NK cells, ILCP_NK cells and ILC1s in bone marrow (left) and liver (right). For i, j, bone marrow data is from scRNA-seq in Fig. 1a, liver data is from dataset of Friedrich et al., 2021.
Extended Data Fig. 5
Extended Data Fig. 5. ENKPs and ILCPs give rise to distinct NK cells.
a, Quantification of chimerism in competitive assay (same strategy as in Fig. 2e) from 2 independent experiments. ALP group, n = 8; ENKP group, n = 9; ILCP group, n = 8. b, Representative flow plots and quantification of Ly49H+ ratios in ENKPs and NK cells in bone marrow combined from 2 independent experiments, n = 5. c, Quantification of Ly49 receptor positive ratios in ENKP_NK cells and ILCP_NK cells from NSG mice transferred with ENKPs or ILCPs, n = 10, combined from 2 independent experiments. d, Representative histogram of TCF1-YFP expression and quantification of TCF1-YFP+ ratios in ENKP_NK cells and ILCP_NK cells from NSG mice transferred with ENKPs or ILCPs, n = 10, combined from 2 independent experiments. e, Violin plots of Tcf7 from scRNA-seq grouped by developmental origins. f, Quantification of PLZF lineage tracing ratios in different tissues from irradiated wild-type mice transferred with LinKit+ progenitors (PLZF-tracing long-term chimera), n = 7, combined from 2 independent experiments. B cells were used as negative control for PLZF labeling. g, Quantification of Ly49H+ ratios in NK cells in different tissues from PLZF-tracing long-term chimeras, n = 7 combined from 2 independent experiments. h - i, Quantification of PLZF lineage tracing ratios (h) and Ly49H+ ratios in NK cells (i) in different tissues from irradiated NSG mice transferred with LinKit+ progenitors (NSG PLZF-tracing long-term chimera) combined from 3 independent experiments. spleen and salivary glands (SG), n = 7; uterus and bone marrow (BM), n = 6. For a-d, f - i, data are mean ± s.e.m. For a,c,d, f - i, statistical analysis was performed using two-tailed unpaired Student’s t-tests.
Extended Data Fig. 6
Extended Data Fig. 6. ENKP-derived and ILCP-derived NK cells are similar to human CD56 dim and CD56 bright NK cells, respectively.
a. Feature plots of surface protein expression in human blood NK measured by CITE-seq. b. UMAP of human blood NK cells analyzed by scRNA-seq. Annotation defined by surface protein expression measured by CITE-seq. c. Feature plots of KIR genes in human blood NK cells analyzed by scRNA-seq. d. Heatmap of Spearman correlation analysis between mouse NK clusters and human NK clusters. e. Heatmap of Spearman correlation analysis between mouse NK developmental originals and human NK clusters. For a - e, data were integrated from datasets of Rückert et al., 2022 and Yang et al., 2019.
Extended Data Fig. 7
Extended Data Fig. 7. ENKP-derived NK cells respond to MCMV infection.
a-b, Analysis of ENKP_NK cells and ILCP_NK cells in peripheral blood on day 7 after MCMV infection. Representative flow plots (a) and quantification of frequencies (c) of ENKP_NK cells and ILCP_NK cells, n = 8 combined from 2 independent experiments. b, Quantification of frequencies of ENKP_NK and ILCP_NK cells in blood without MCMV infection, n = 5, combined from 2 independent experiments. For b and c, 300 ENKPs or ILCPs were transferred into each NSG mice. d, Quantification of ratios of ENKP and ILCP-derived NK cells from NSG mice co-transferred with ENKPs and ILCPs using different congenic markers (CD45.1 vs CD45.2), day 7 after MCMV infection combined from 2 independent experiments. n = 9. For b - d, data are mean ± s.e.m.
Extended Data Fig. 8
Extended Data Fig. 8. Verification of ENKP_NK and ILCP_NK-enriched cell population.
a, Representative histograms and quantification of frequencies of cells expressing specific surface markers in spleen NK cells derived from ENKPs or ILCPs combined from 2 independent experiments. n = 10. b, Representative histograms and quantification of frequencies of cells expressing TCF1-YFP in spleen NK subsets from TCF1-YFP reporter mice combined from 2 independent experiments. n = 5. c - d, Quantification of PLZF-tracing ratios (c) and NK cell numbers (d) in spleen NK subsets from NSG PLZF-tracing long-term chimera day 7 after MCMV infection combined from 2 independent experiments. Not infected, n = 10; MCMV, n = 5. e, Quantification of NK cell numbers in spleen NK subsets in wild-type B6 mice on day 7 after MCMV infection combined from 2 independent experiments. n = 5. f, Quantification of cell number in spleen of total NK cells, NK subsets and ILC1s in Eomes-deficient mice combined from 2 independent experiments. IL-7RACreEomes+/+, n = 5; IL-7RACreEomesfl/fl;, n = 6. g, Quantification of cell number in spleen of total NK cells and NK subsets in Zbtb16-deficient mice combined from 2 independent experiments. Zbtb16+/+, n = 5; Zbtb16GFPcre/GFPcre, n = 6. h, Quantification of cell numbers of spleen NKT cells in Zbtb16-deficient mice combined from 2 independent experiments. n = 3. For a - h, data are mean ± s.e.m., and statistical analysis was performed using two-tailed unpaired Student’s t-tests.
Extended Data Fig. 9
Extended Data Fig. 9. Distinguish ENKP_NK cells and ILCP_NK cells by surface markers.
a, Representative flow plots and quantification of frequencies of NK subsets in spleen NK cells derived from ENKPs or ILCPs combined from 2 independent experiments. n = 10. b, Quantification of PLZF-tracing ratios in spleen NK subsets from NSG PLZF-tracing long-term chimeras combined from 2 independent experiments. n = 6. c, Representative histograms and quantification of frequencies of cells expressing specific surface markers in spleen NK cells derived from ENKPs or ILCPs combined from 2 independent experiments. n = 10. d, Quantification of PLZF-tracing ratios in spleen NK subsets from NSG PLZF-tracing long-term chimeras from 2 independent experiments. n = 6. e, Quantification of PLZF-tracing ratios in spleen total NK cells and NK subset from NSG PLZF-tracing long-term chimeras combined from 2 independent experiments. n = 6. For a - e, data are mean ± s.e.m., and statistical analysis was performed using two-tailed unpaired Student’s t-tests.
Extended Data Fig. 10
Extended Data Fig. 10. Characterization of functions of NK subsets.
a, Representative flow plots and quantification of frequencies of cells expressing cytokines or CD107a in NK subsets, representative data from 2 independent experiments. n = 4. b, Quantification of specific lysis ratios of Yac-1 cells co-cultured with NK subsets, representative data from 2 independent experiments. n = 4. c, Histogram of IFN-γ expression of in vitro differentiated ENKP_NK cells and ILCP_NK cells after stimulation. Representative histograms from 2 independent experiments. d - e, Representative flow plots of gating (d) and IFN-γ expression (e) of NK subsets and ILC1s from cecum lamina propria (LP) after Salmonella infection. f - g, Representative flow plots of gating (f) and IFN-γ expression (g) of NK subsets and ILC1s from ear skin after HSV infection. For a, b, ENKP_NK-enriched population, Ly49H+ and/or Ly49D+; ILCP_NK-enriched population, Ly49HLy49DCD226+(Thy1.2+ and/or CXCR3+). For e, g, ENKP_NK-enriched population, Ly49H+ and/or Ly49D+; ILCP_NK-enriched population, Ly49HLy49DCD226+Thy1.2+. For a, b, data are mean ± s.e.m, and statistical analysis was performed using two-tailed unpaired Student’s t-tests.
Fig. 1
Fig. 1. Characterization of early NK cell development in BM.
a - b, scRNA-seq of BM cells: UMAP (a), and dotplots (b) of expression of surface genes and transcription factors grouped by clusters in a. c, Gating strategy and frequency of ENKPs combined from 3 independent experiments. n = 16 mice. d, Representative flow plots of ENKPs and quantification of ENKPs and NK cells in BM of Nfil3−/− mice, n = 4. Combined data from 2 independent experiments. e, Representative flow plots of ENKPs and quantification of ENKPs and NK cells in BM of Eomes−/− mice, n = 4. Combined data from 2 independent experiments. For c, d and e, data are mean ± s.e.m, and for d and e, statistical analysis used two-tailed unpaired Student’s t-tests.
Fig. 2
Fig. 2. ENKPs are early NK-lineage biased progenitors.
a, Representative flow plots and quantification of in vitro differentiated ILCs, n = 4. Representative data from 3 independent experiments. b, Gating strategy of in vitro clonal assay for ILC lineage potential. c, Results of individual positive clones combined from 2 independent experiments. Each column represents one well, with detected ILC lineages in grey. n is number of wells. d, Flow plots and quantification of group 1 ILCs in liver from ILCP (n = 10) or ENKP-transferred (n = 10) NSG mice combined from 3 independent experiments. e, Quantification of chimerism in spleen combined from 2 independent experiments. CD45.1+ cells are ALP competitors-derived cells. CD45.2+ cells are ALP-derived, ENKP-derived or ILCP-derived cells. ALP group, n = 8; ENKP group, n = 9; ILCP group, n = 8. For a, d, e, data are mean ± s.e.m, and statistical analysis used two-tailed unpaired Student’s t-tests, without any adjustment for multiple comparisons.
Fig. 3
Fig. 3. ENKPs develop independent of ILCPs.
a, Representative histograms and quantification of PLZF-YFP+ ratio in group 1 ILCs (n = 3) in liver and in progenitors (n = 4) in BM combined from 2 independent experiments. b, Representative histograms and quantification of PLZF-YFP+ ratio of progenitor-derived NK cells in spleen and ILC1s in liver combined from 3 independent experiments. ALP-derived NK, n = 9; ENKP-derived NK, n = 7; ILCP-derived NK, n = 6; ILCP-derived ILC1, n = 6. Data are mean ± s.e.m. For b, statistical analysis used two-tailed unpaired Student’s t-test, without any adjustment for multiple comparisons.
Fig. 4
Fig. 4. ENKP and ILCP give rise to distinct NK cells.
a, Heatmap of average expression levels of representative genes differentially expressed in ENKP_NK and ILCP_NK from scRNA-seq. Each column is one developmental origin. Data are shown as z-score. b, Violin plots grouped by developmental origins show representative genes expressed similarly (upper) or differently (middle, higher in ENKP_NK; lower, higher in ILCP_NK) between ENKP_NK and ILCP_NK. c, Representative histograms, and quantification of Ly49H+ ratios in NK cells derived from ENKPs or ILCPs combined from 2 independent experiments. “Total NK” group is total NK cells from wild-type C57BL/6 mice. ENKP_NK, n = 5; ILCP_NK, n = 6; total NK, n = 4. d, Violin plots of human blood NK cells visualizing homologous genes identified to be upregulated in either mouse ENKP_NK or ILCP_NK cells, grouped according to the classification in Extended Data Fig. 6b. e, UMAP of human blood NK cells split by HCMV status analyzed by scRNA-seq. Annotation defined by surface protein expression measured by CITE-seq. f, Violin plots of gene set scores calculated in the human single cell blood NK data using the human homologues of the genes upregulated in either mouse ENKP_NK or ILCP_NK. Plots are split by HCMV status. For c, data are mean ± s.e.m. For d, data are integrated from Ref. 31, 32. For e, f, data are from Ref. 32.
Fig. 5
Fig. 5. ENKP-derived NK cells respond to MCMV infection.
a, c, Analysis of ENKP_NK cells and ILCP_NK cells from spleen on day 7 after MCMV infection. Representative flow plots (a), quantification of total cell numbers of ENKP_NK cells and ILCP_NK cells (c) combined from 2 independent experiments. 300 ENKPs or ILCPs were transferred into each NSG recipient mouse. n = 8. b, Quantification of total numbers of ENKP_NK cells and ILCP_NK cells from NSG mice without MCMV infection, n = 5. Total numbers were normalized to 300 ENKPs, ILCPs or mature NK cells. Combined data from 2 independent experiments. d, Quantification of PLZF-YFP+ ratio in total NK cells on day 7 after MCMV infection combined from 2 independent experiments. Not infected, n = 10; MCMV, n = 6. e, Quantification of total NK cells, PLZF-YFP+ and PLZF-YFP NK subsets on day 7 after MCMV infection combined from 2 independent experiments. Uninfected, n = 10; MCMV, n = 6. For b - e, data are mean ± s.e.m, and statistical analysis used two-tailed unpaired Student’s t-tests, without any adjustment for multiple comparisons.
Fig. 6
Fig. 6. Characterization of functions of NK subsets.
a-c, Representative flow plots (a), histograms (b), and quantification of PLZF-YFP+ ratio (c) in spleen NK subsets from irradiated NSG mice transferred with PLZF-YFPLinKit+ progenitors. Spleen NK cells, n = 7 mice; spleen ILC1, n = 5 mice; liver ILC1, n = 11 mice. d, Quantification of NK cells and ILC1s in cecum lamina propria after Salmonella infection. Not infected, n = 9; Day 1, n = 9; Day 3, n = 10; Day 5, n = 7. e, Quantification of IFN-γ+ ratios and IFN-γ MFI in NK subsets and ILC1s after Salmonella infection. Day 1, n = 4; Day 3, n = 9; Day 5, n = 6. f, Quantification of NK cells in ear skin after HSV infection. Not infected, n = 8; Day 3, n = 9; Day 5, n = 9. g, Quantification of IFN-γ+ ratios and IFN-γ MFI in NK subsets and ILC1s after HSV infection. Day 3, n = 9; Day 5, n = 9. For c - g, n is number of mice. For c, combined from 3 independent experiments; for d - g, combined from 2 independent experiments. For d - g, ENKP_NK-enriched, Ly49H+ and/or Ly49D+; ILCP_NK-enriched, Ly49HLy49DCD226+Thy1.2+. For d - g, data are mean ± s.e.m; for d, f, statistical analysis used two-tailed unpaired Student’s t-tests; for e, g, statistical analysis used two-tailed paired Student’s t-tests. No adjustments were made for multiple comparisons.

References

    1. Vivier E et al. Innate Lymphoid Cells: 10 Years On. Cell 174, 1054–1066 (2018). - PubMed
    1. Yang Q et al. TCF-1 upregulation identifies early innate lymphoid progenitors in the bone marrow. Nat Immunol 16, 1044–1050 (2015). - PMC - PubMed
    1. Constantinides MG, McDonald BD, Verhoef PA & Bendelac A A committed precursor to innate lymphoid cells. Nature 508, 397–401 (2014). - PMC - PubMed
    1. Xu W et al. An Id2(RFP)-Reporter Mouse Redefines Innate Lymphoid Cell Precursor Potentials. Immunity 50, 1054–1068 e1053 (2019). - PMC - PubMed
    1. Klose CSN et al. Differentiation of type 1 ILCs from a common progenitor to all helper-like innate lymphoid cell lineages. Cell 157, 340–356 (2014). - PubMed

LinkOut - more resources