. 2024 Jul;56(7):1527-1536.
doi: 10.1038/s41588-024-01793-9. Epub 2024 Jun 13.

Synthetic surrogates improve power for genome-wide association studies of partially missing phenotypes in population biobanks

Affiliations

Synthetic surrogates improve power for genome-wide association studies of partially missing phenotypes in population biobanks

Zachary R McCaw et al. Nat Genet. 2024 Jul.

Abstract

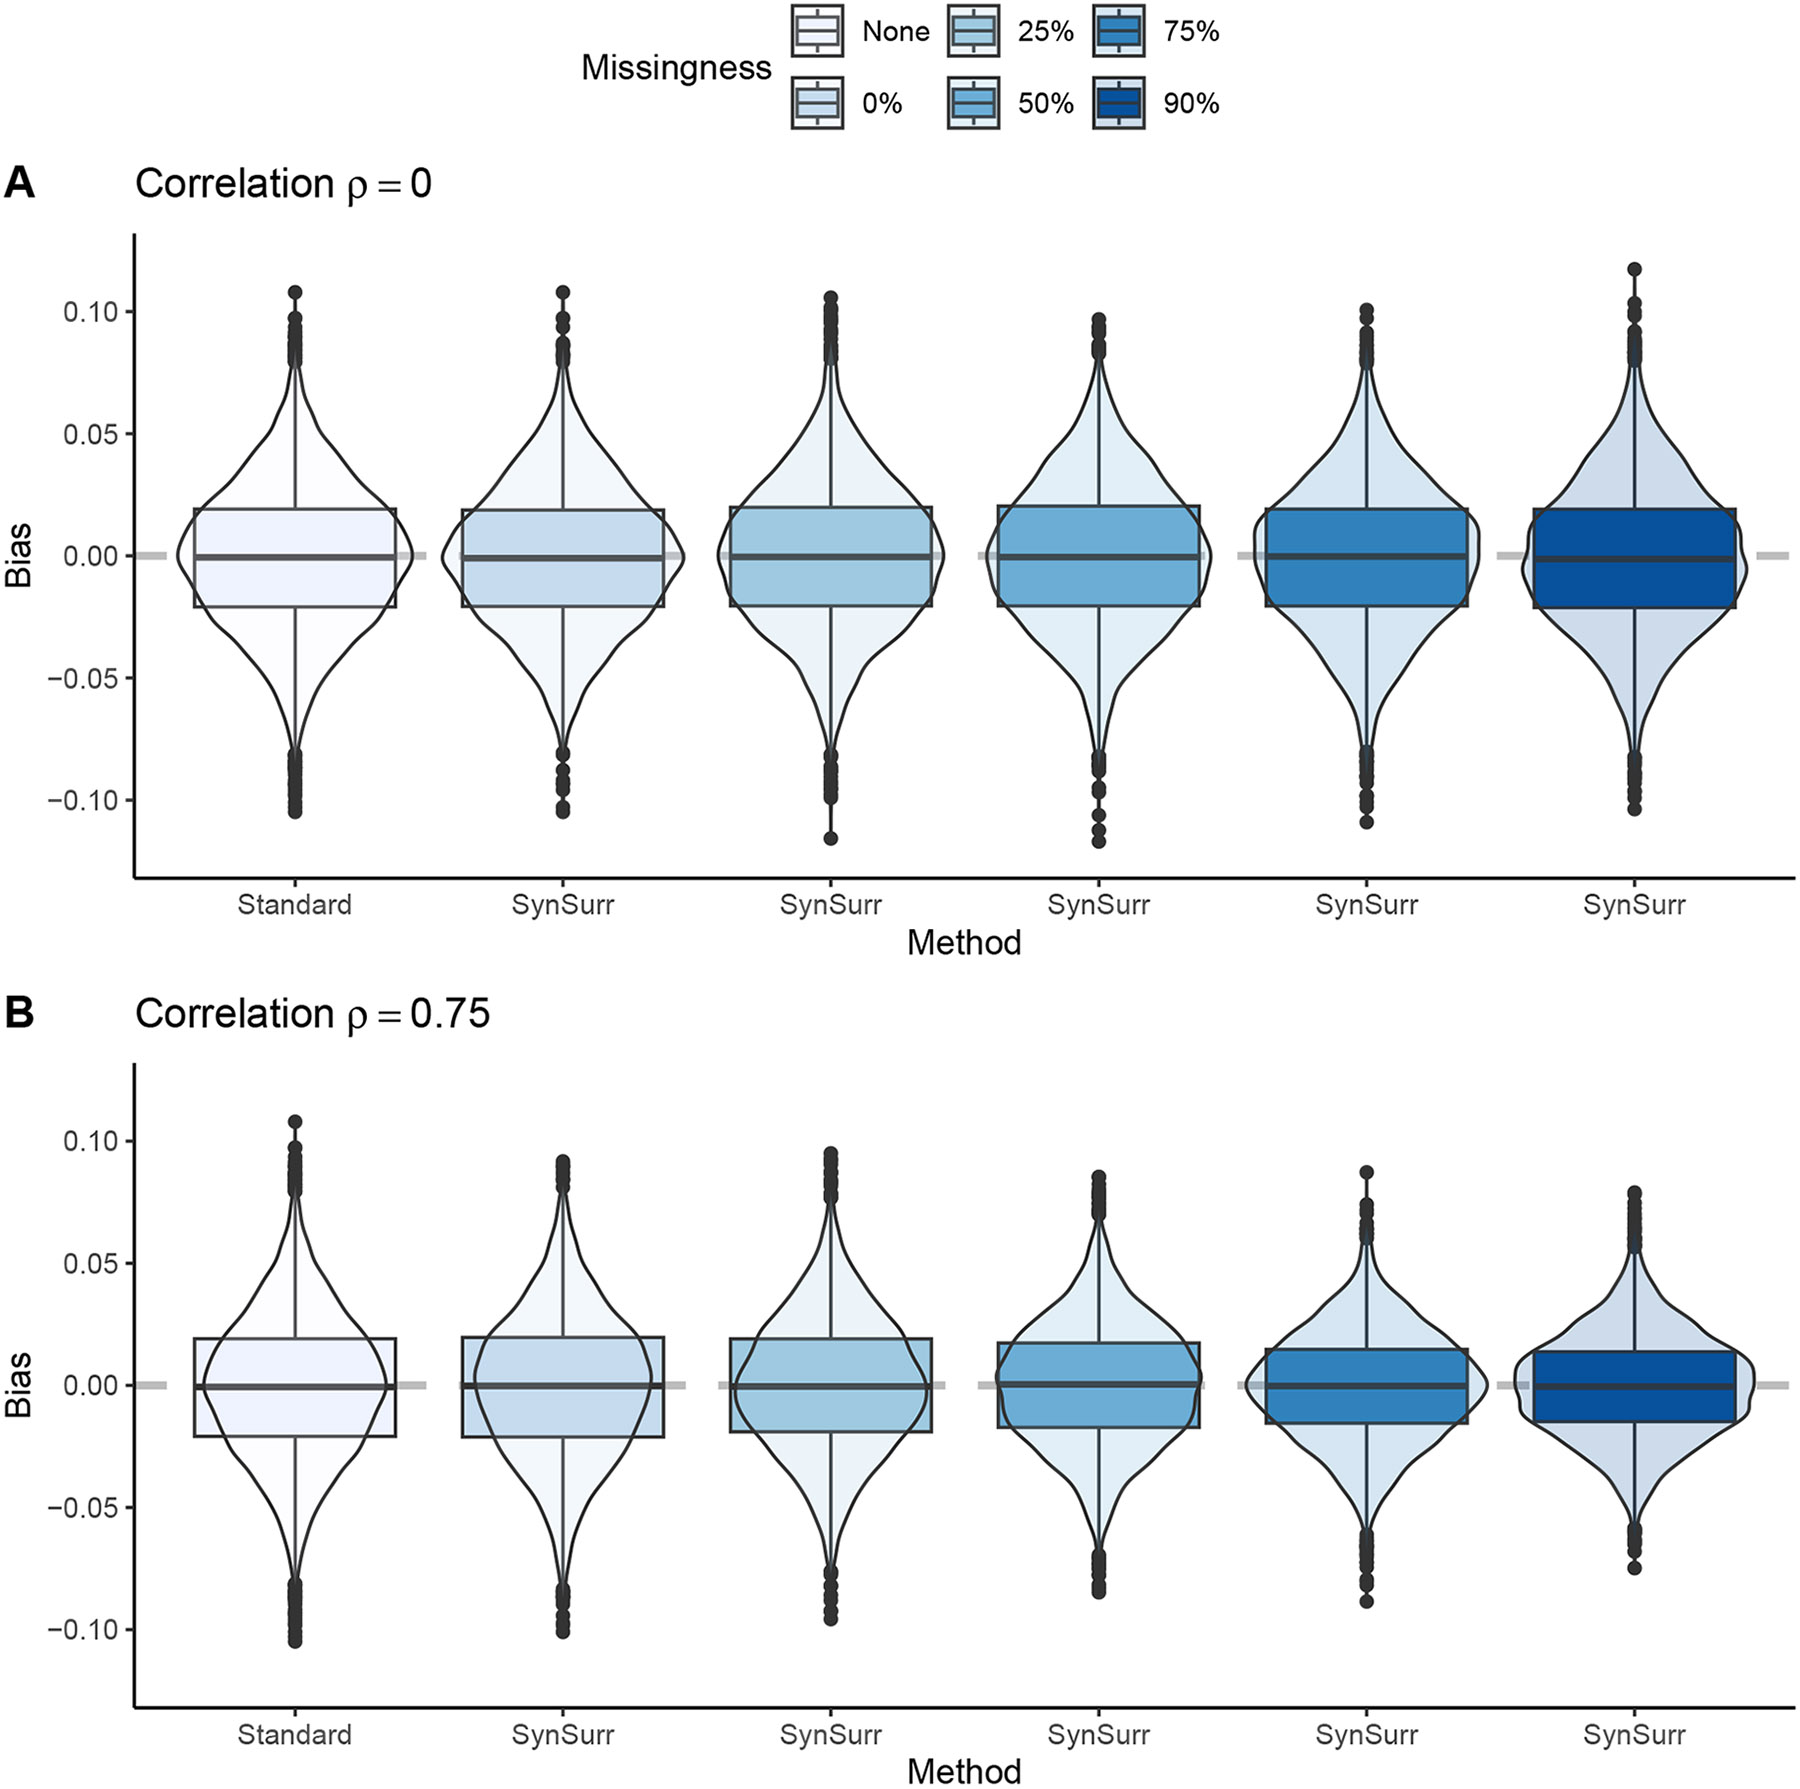
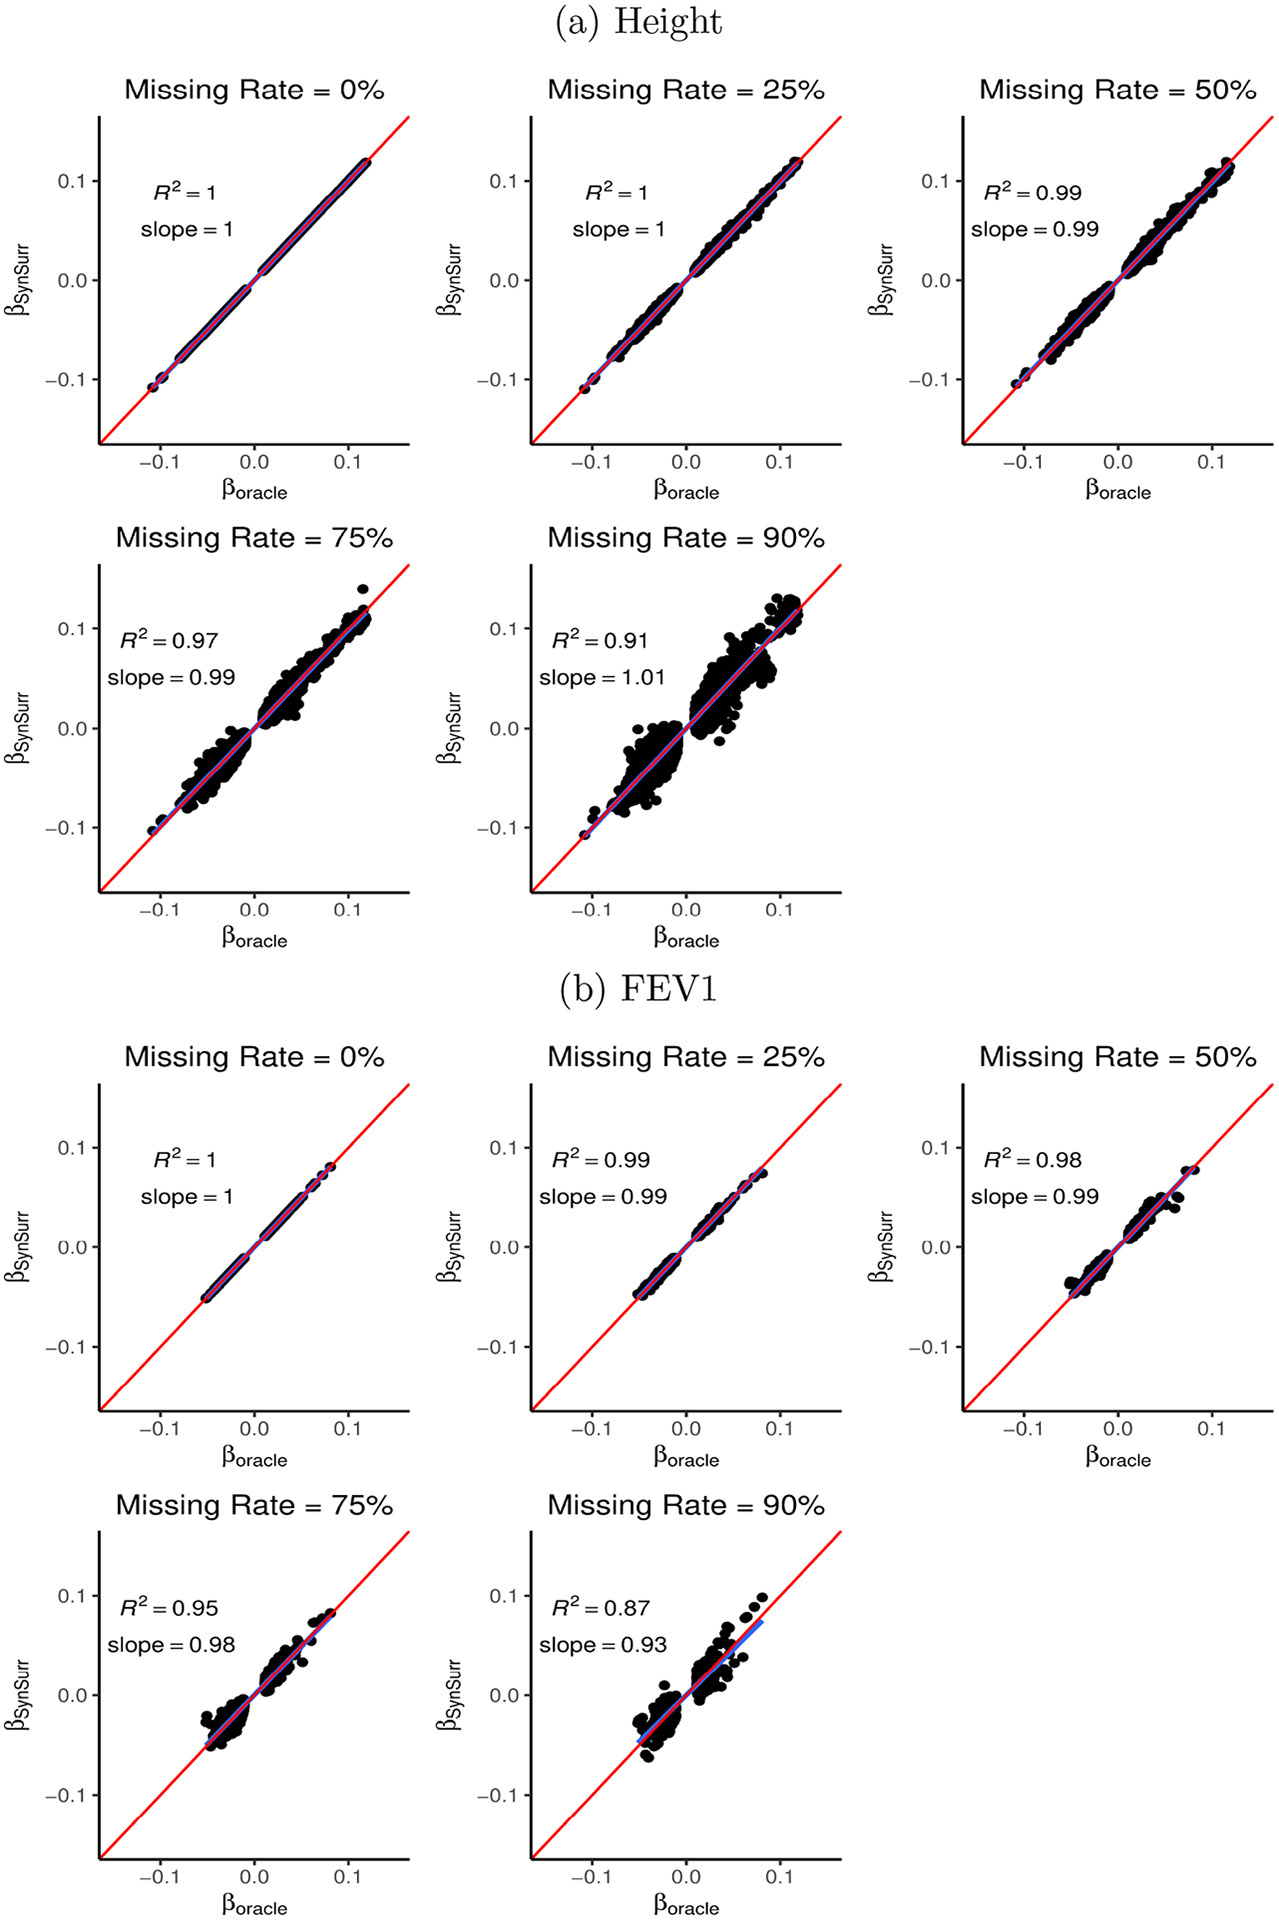
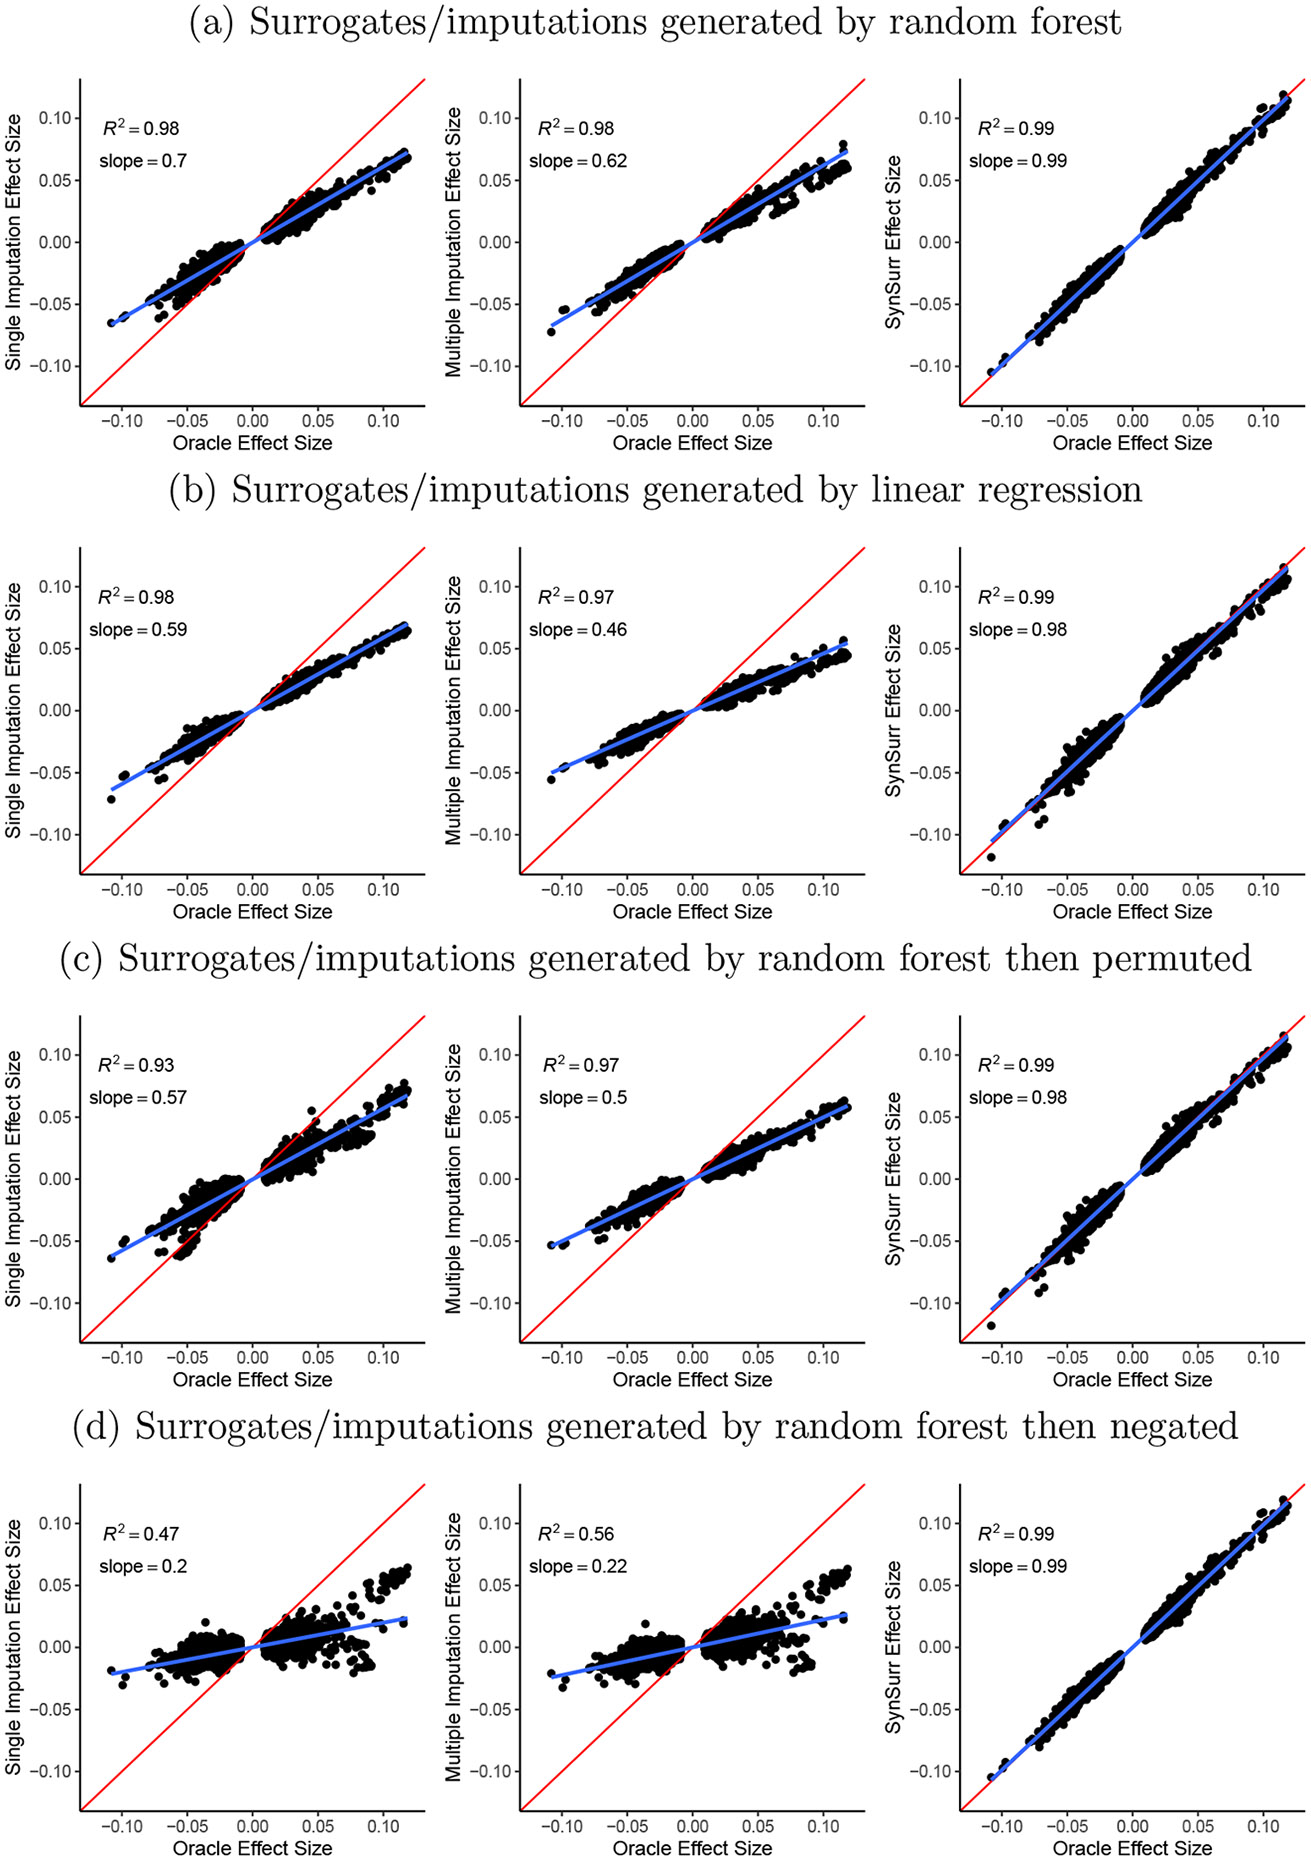
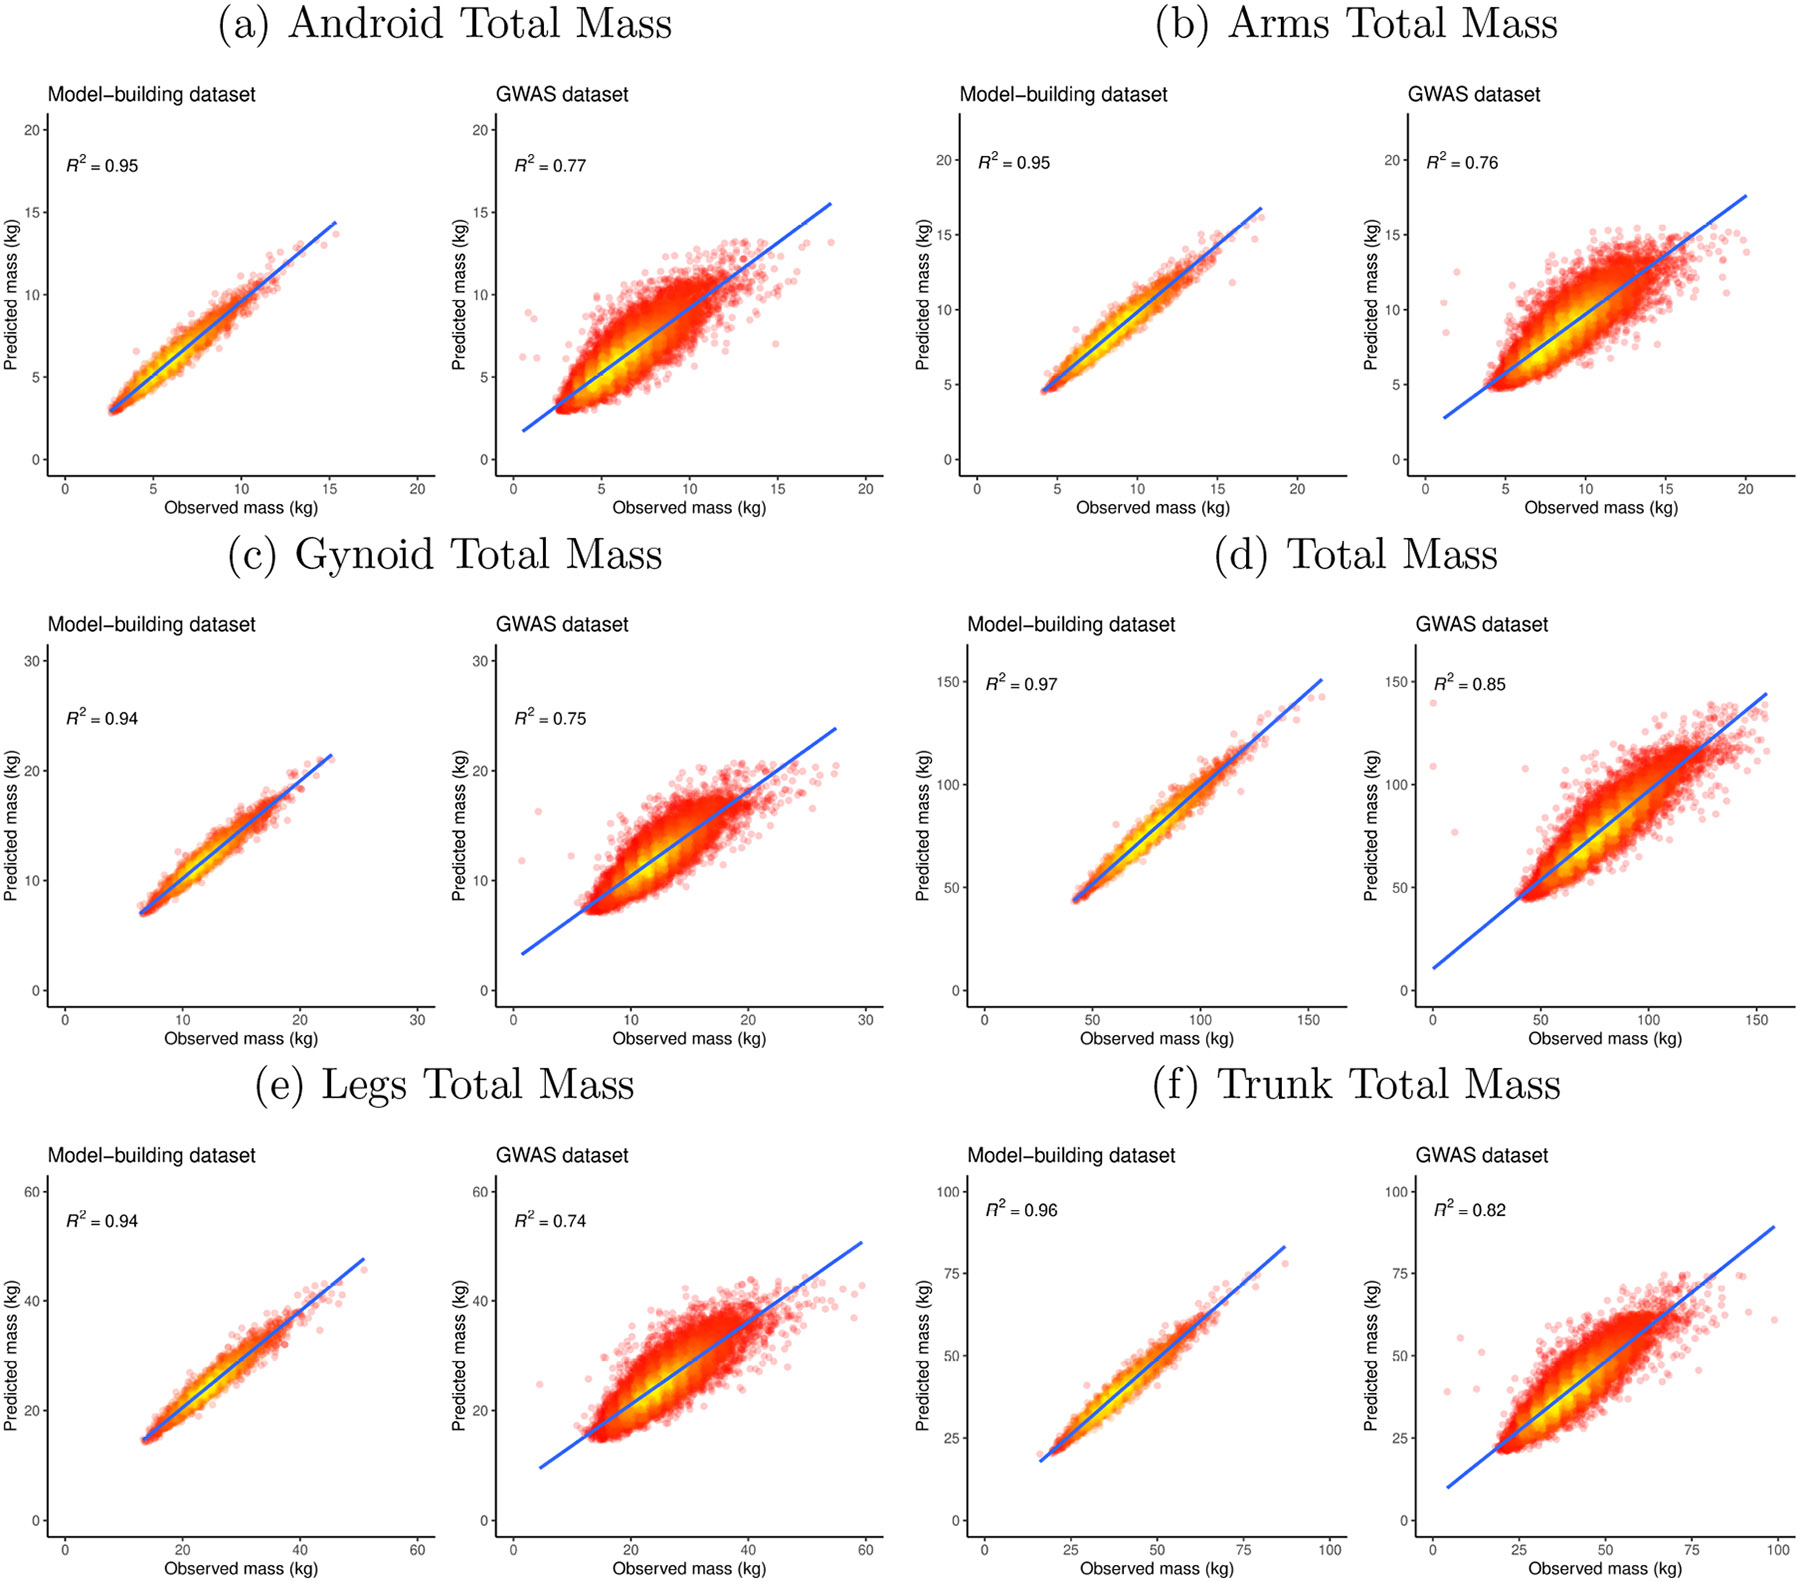
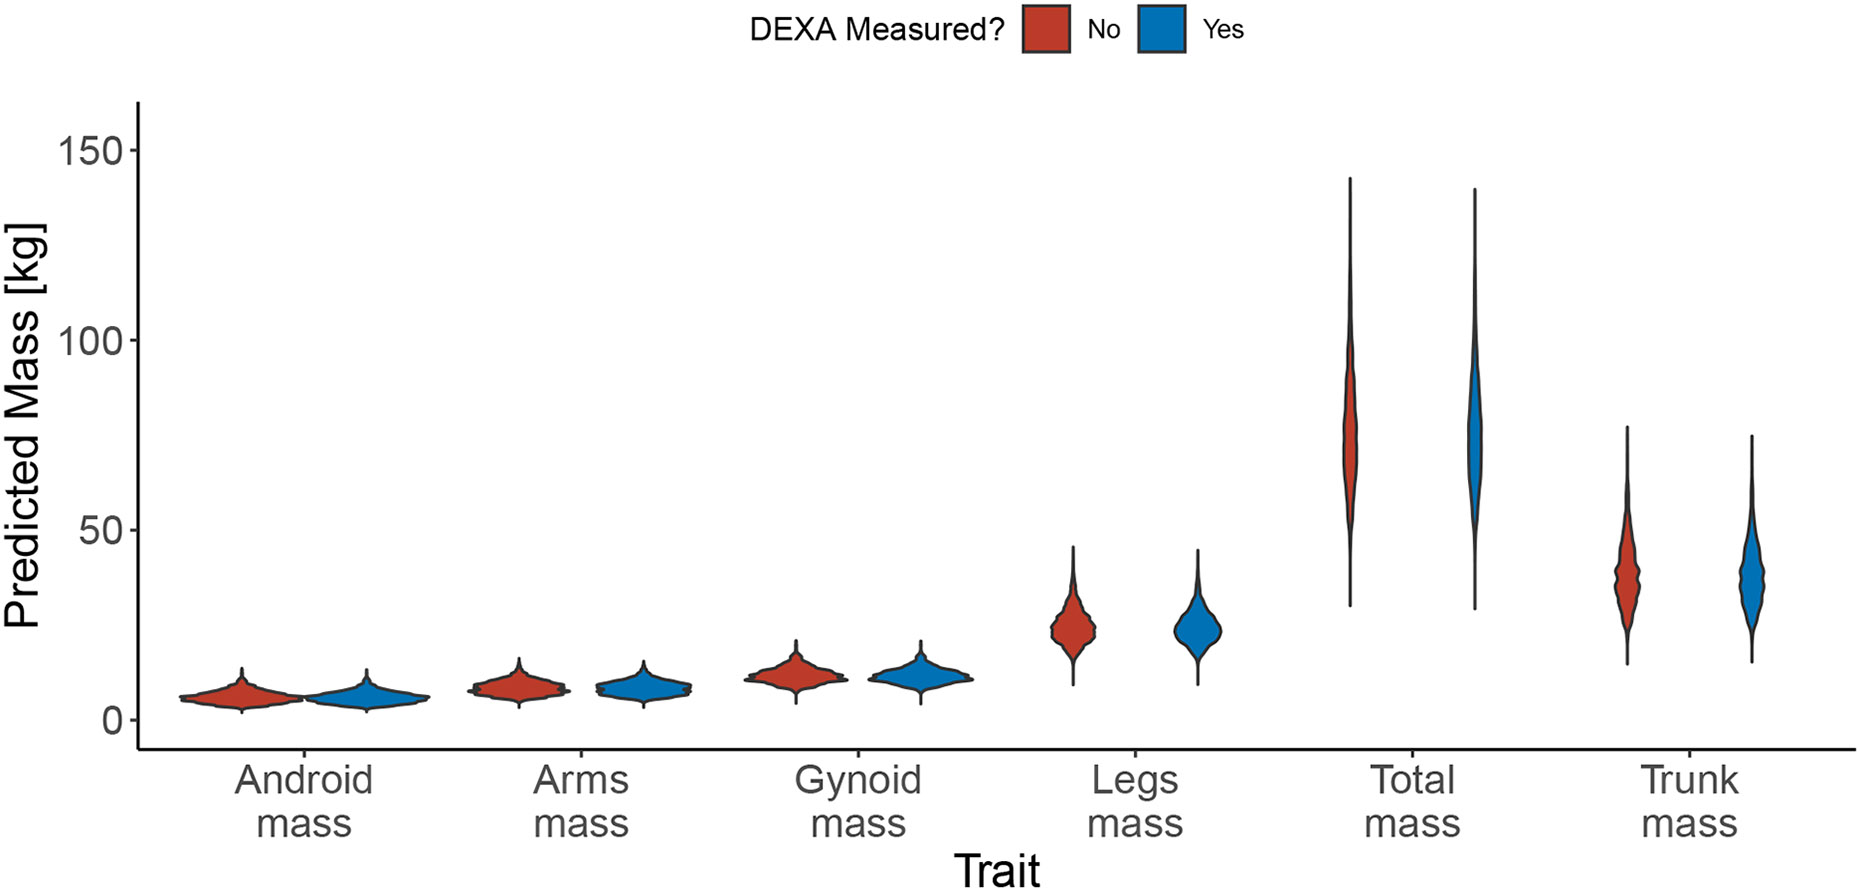
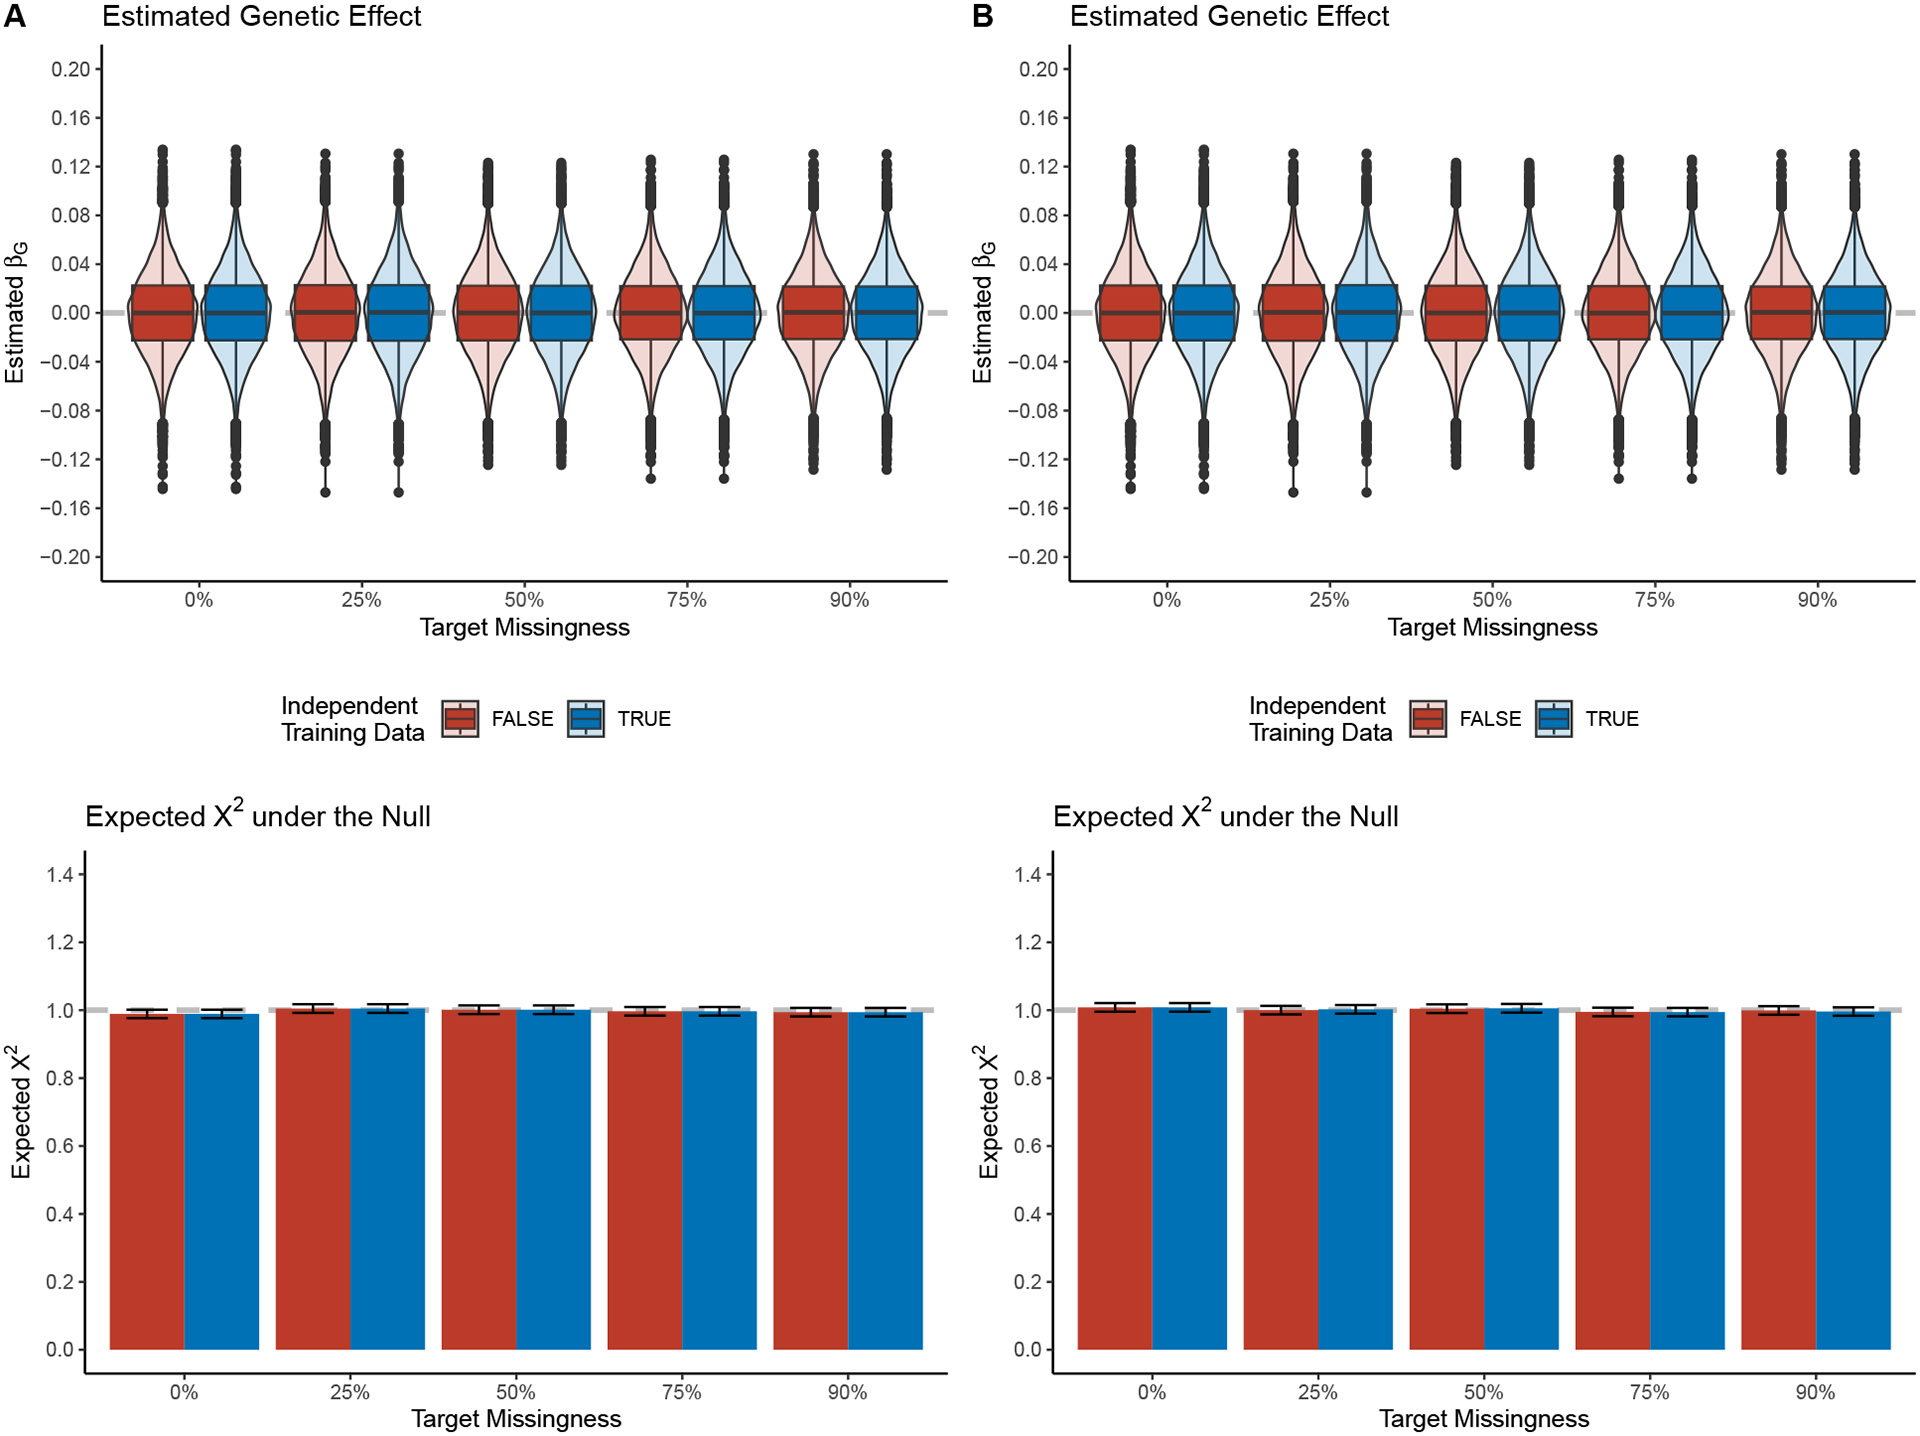
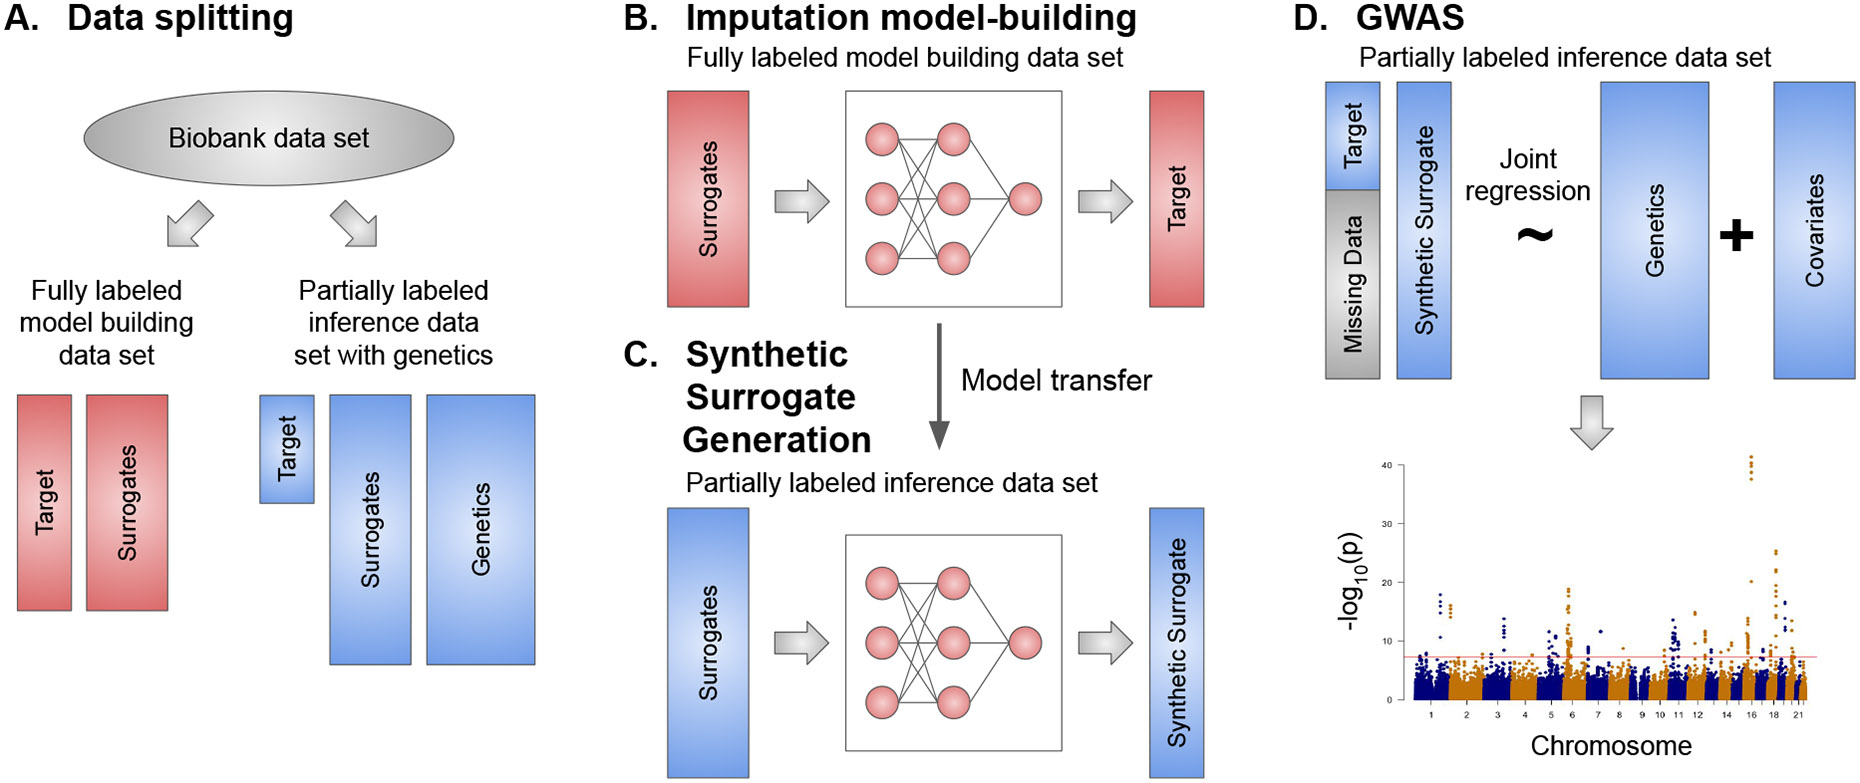
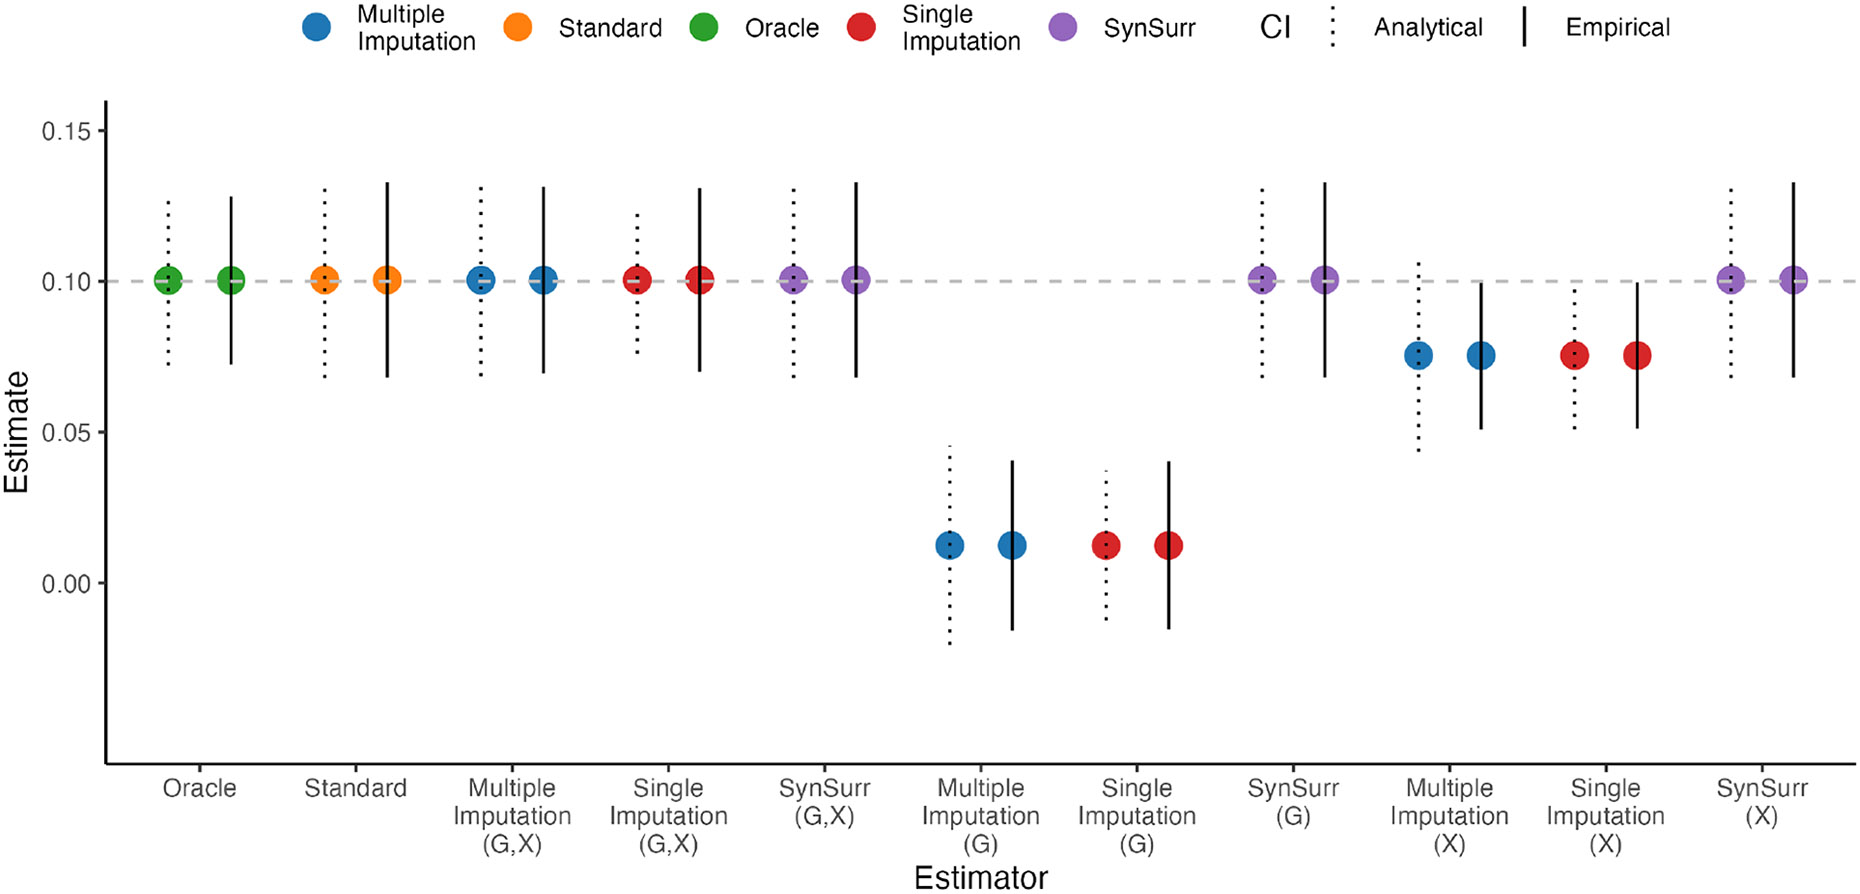
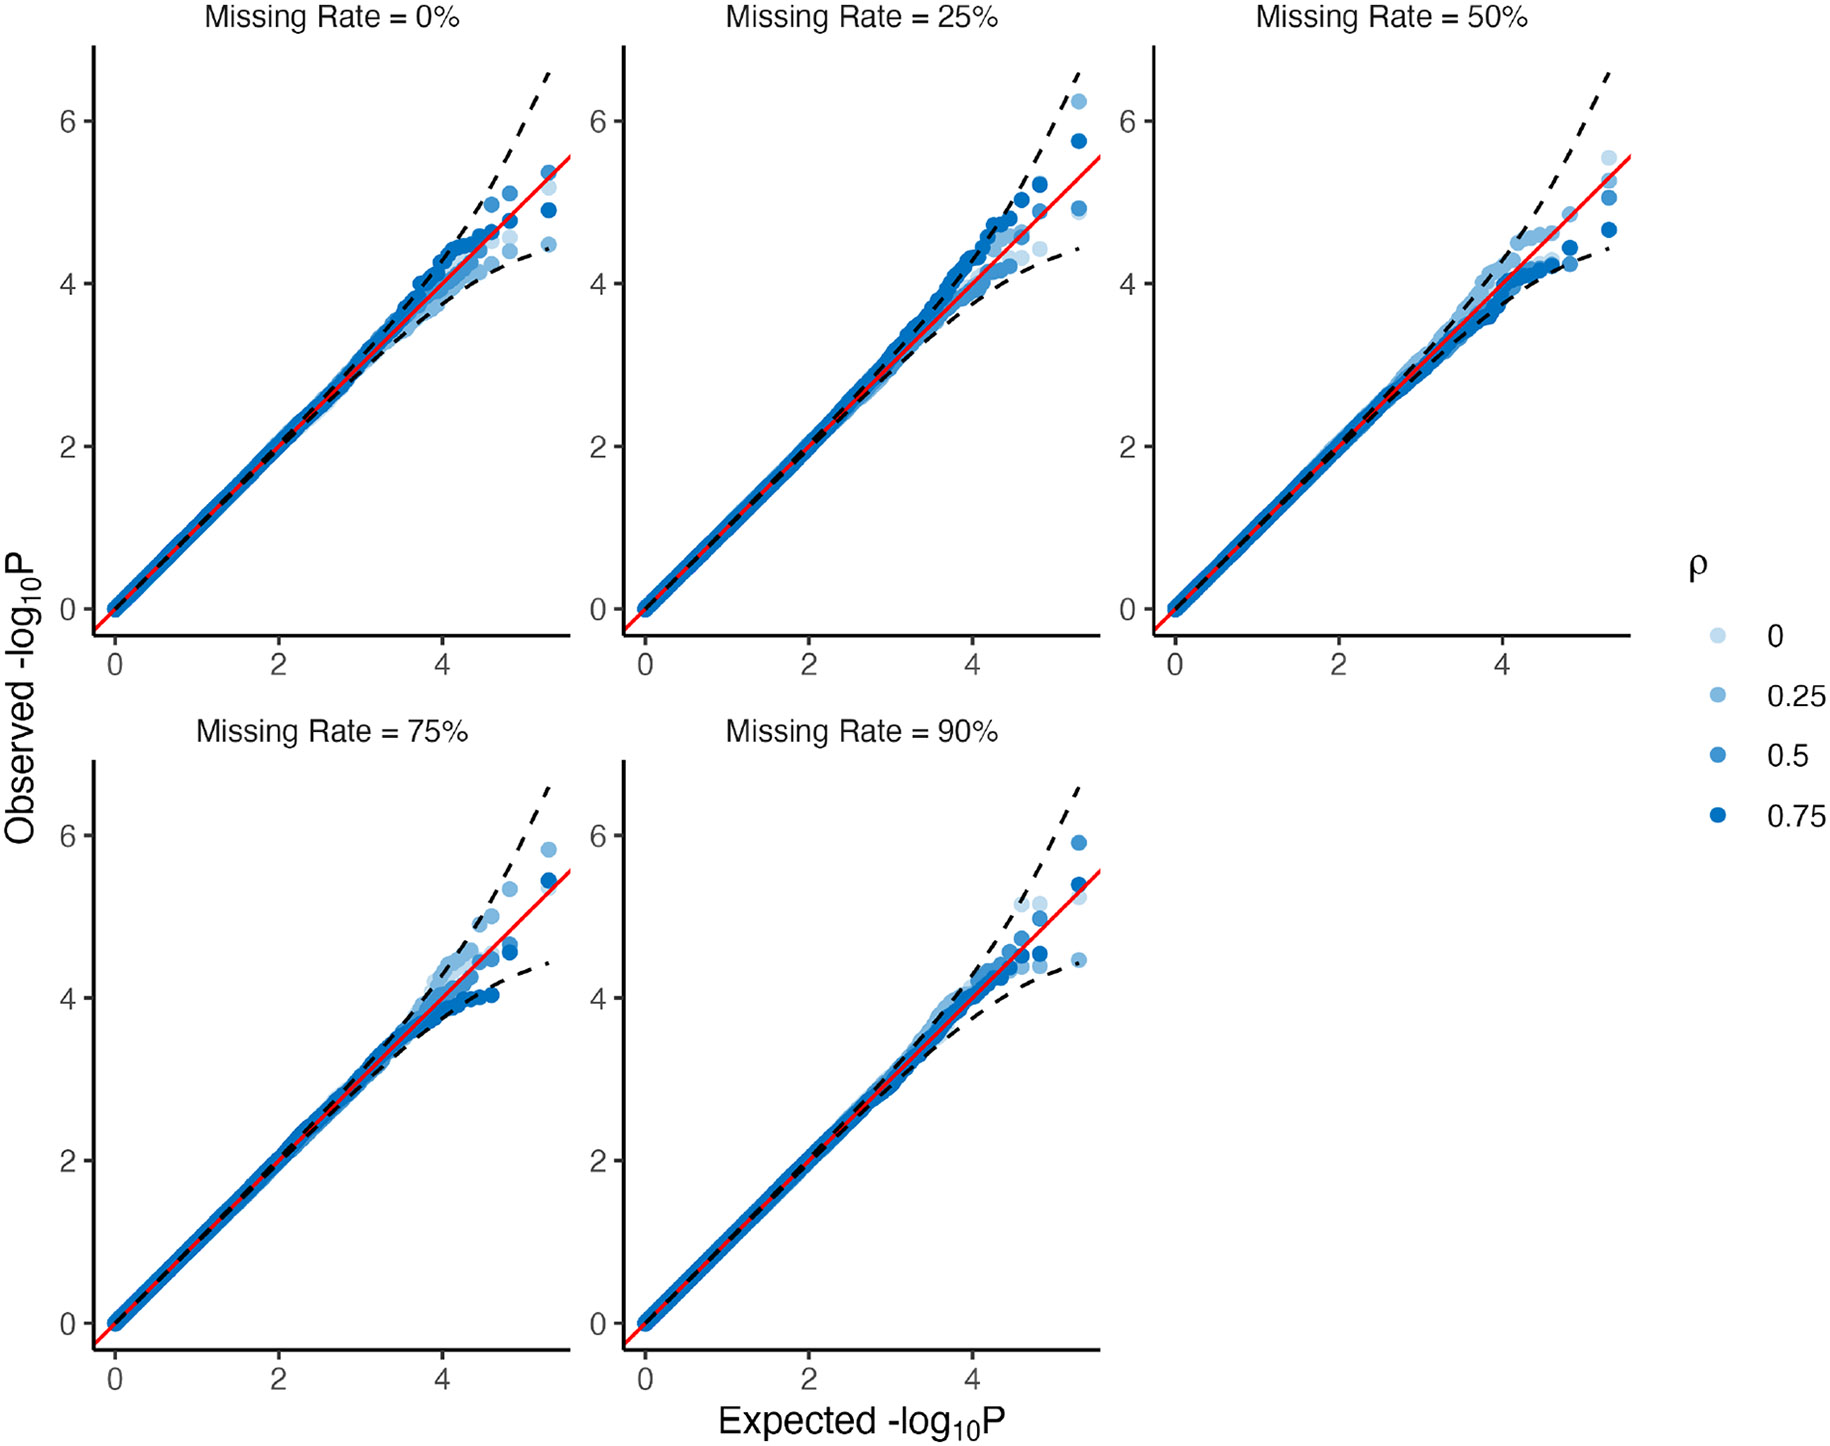
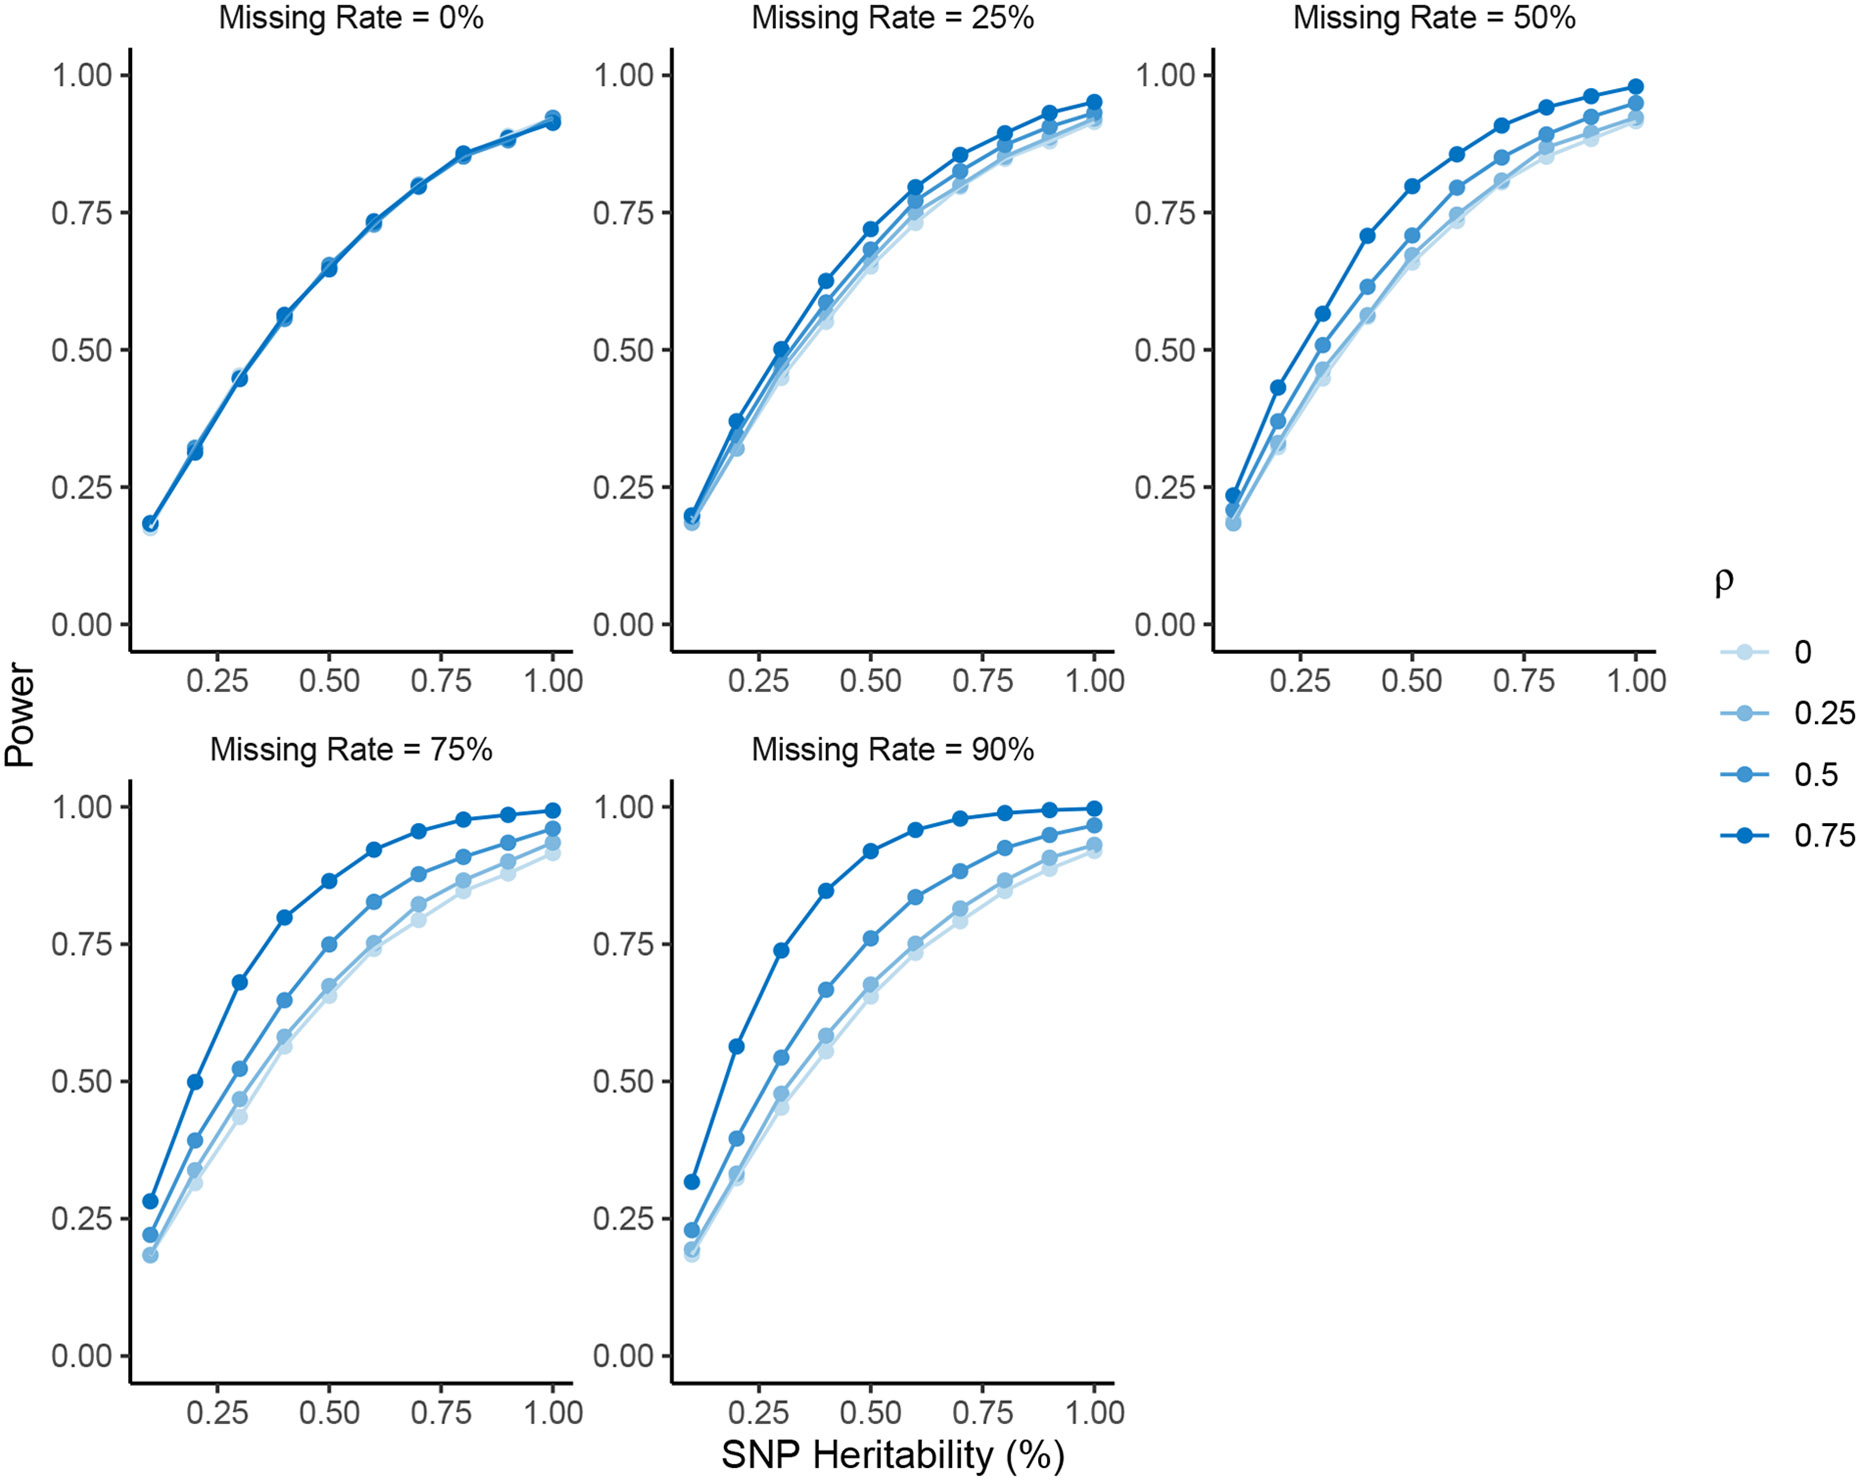
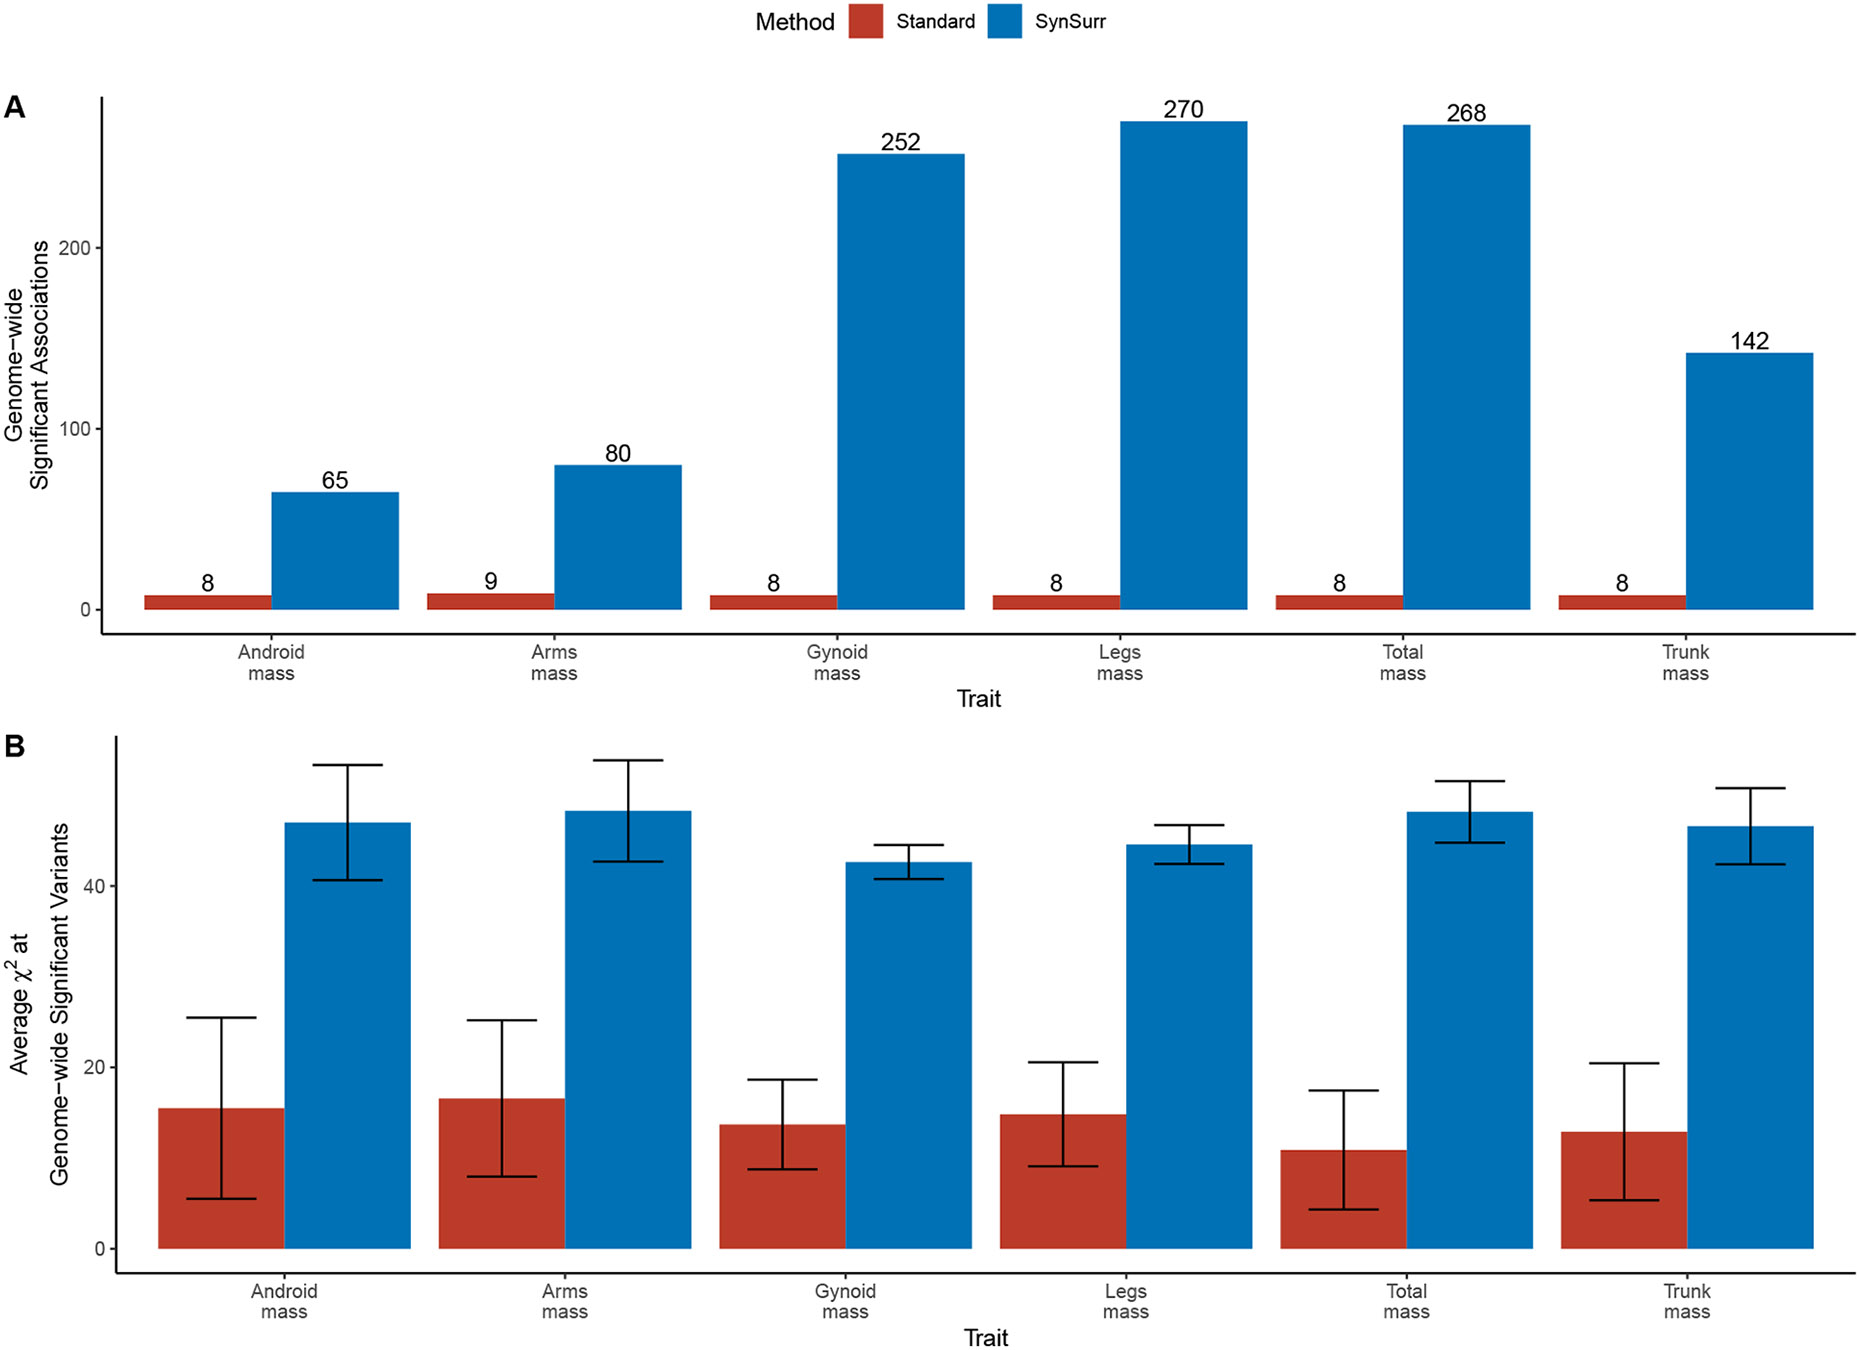
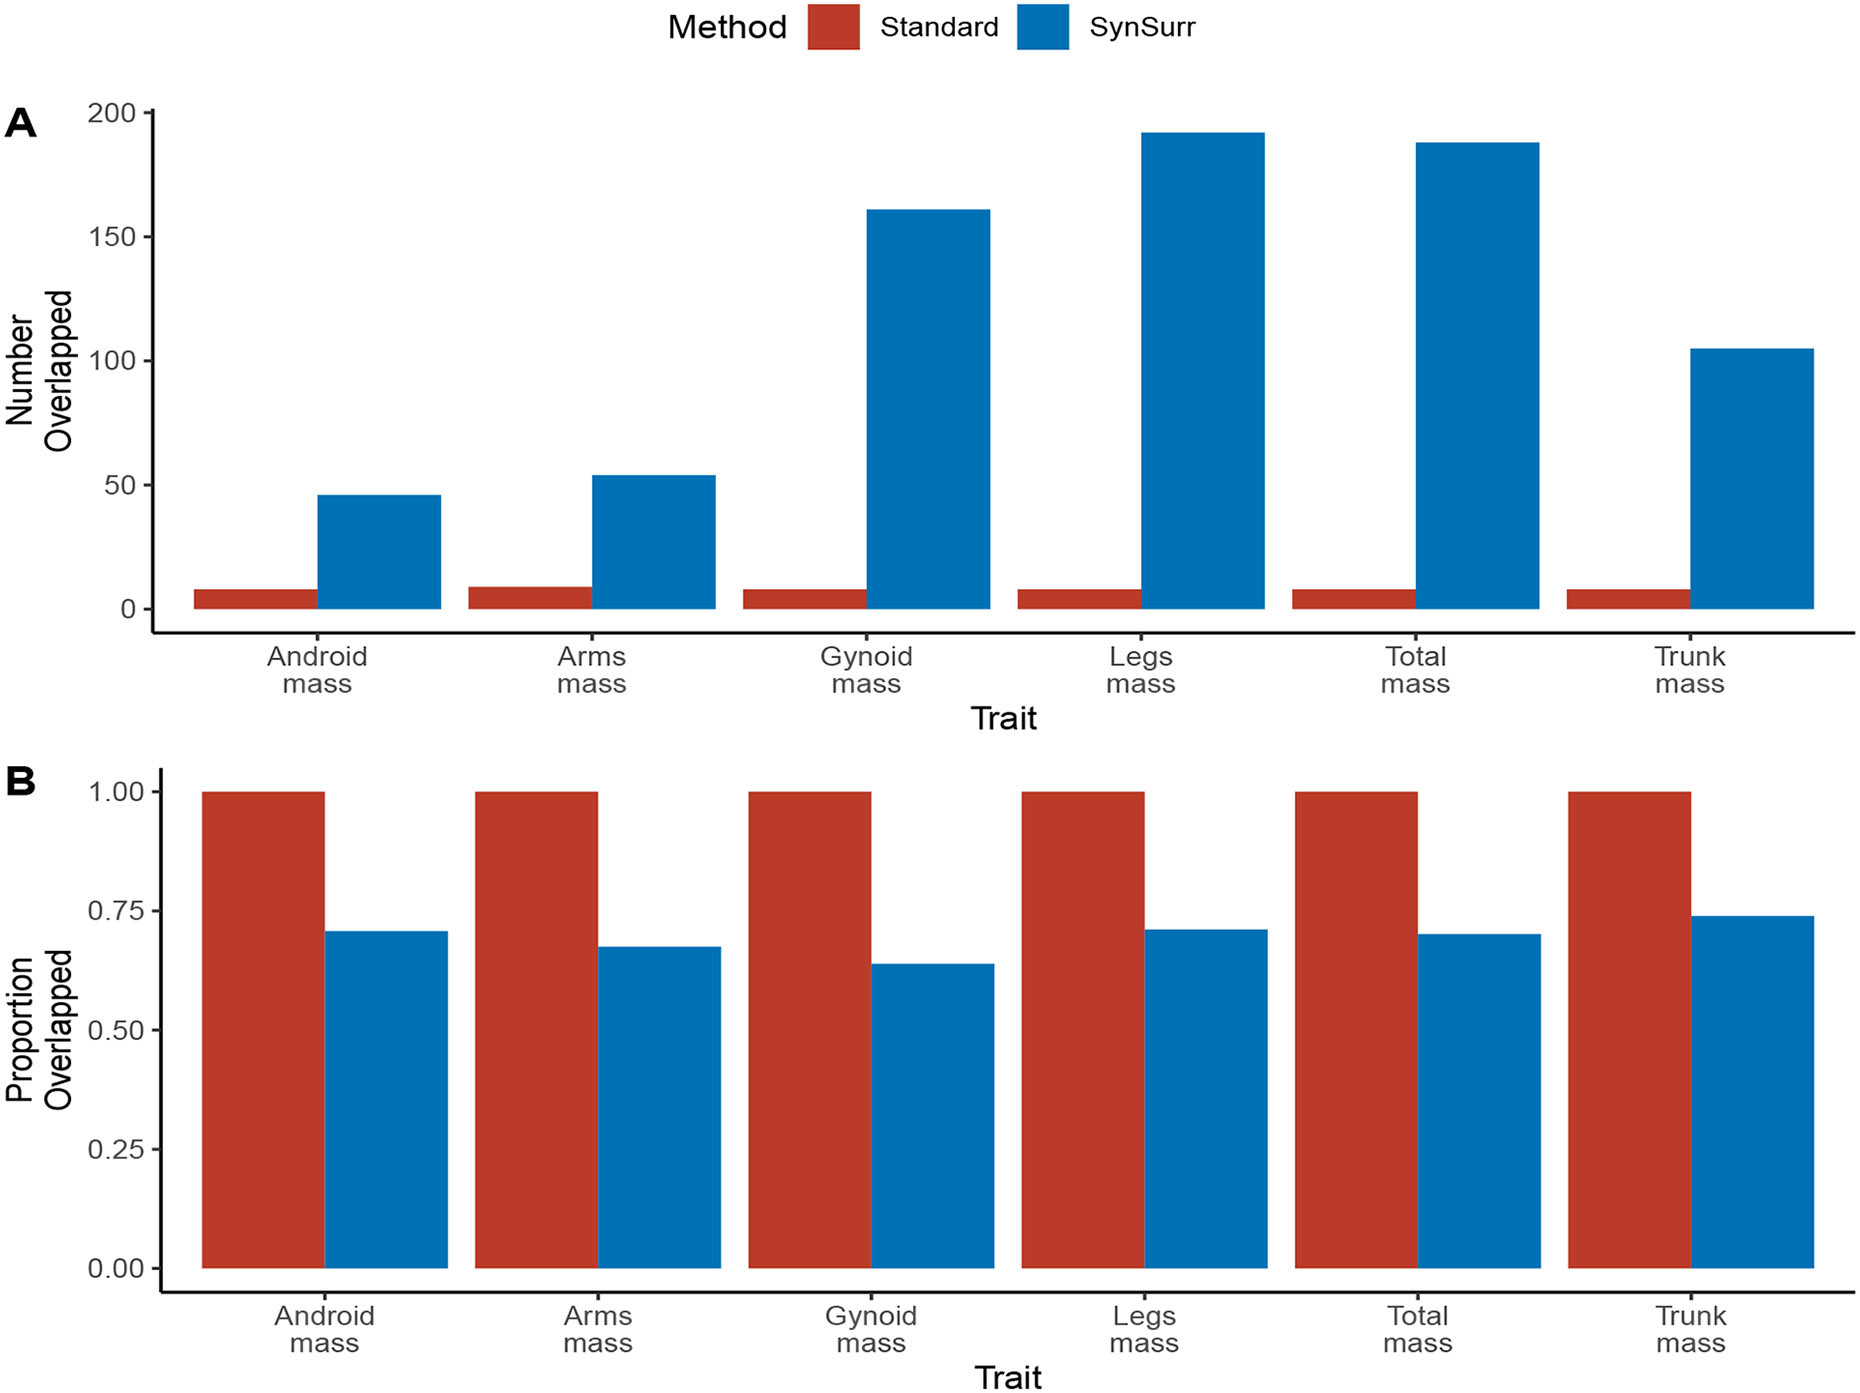
Within population biobanks, incomplete measurement of certain traits limits the power for genetic discovery. Machine learning is increasingly used to impute the missing values from the available data. However, performing genome-wide association studies (GWAS) on imputed traits can introduce spurious associations, identifying genetic variants that are not associated with the original trait. Here we introduce a new method, synthetic surrogate (SynSurr) analysis, which makes GWAS on imputed phenotypes robust to imputation errors. Rather than replacing missing values, SynSurr jointly analyzes the original and imputed traits. We show that SynSurr estimates the same genetic effect as standard GWAS and improves power in proportion to the quality of the imputations. SynSurr requires a commonly made missing-at-random assumption but relaxes the requirements of existing imputation methods by not requiring correct model specification. We present extensive simulations and ablation analyses to validate SynSurr and apply it to empower the GWAS of dual-energy X-ray absorptiometry traits within the UK Biobank.


Figures

Extended Data Figure 1:
Extended Data Figure 1:. Robustness and precision of SynSurr with an uninformative and informative synthetic surrogate.
In all cases, the number of subjects with observed phenotypes was n=103. The number of subjects with missing phenotypes was varied to achieve the indicated level of missingness. The standard estimator utilizes the observed values of Y only. In panel A, the synthetic surrogate has correlation ρ=0.00 with the target phenotype, and is in fact independent of the target phenotype. Use of the SynSurr estimator with this uninformative surrogate results in no loss of efficiency relative to the standard analysis. In panel B, the synthetic surrogate has correlation ρ=0.75 with the target phenotype. SynSurr becomes more efficient as the number of subjects with missing target outcomes increases. The center of the box plot is the median, the upper and lower bounds of the box are the 75th and 25th percentiles, and the whiskers extend from the minimum to the maximum. The number of simulation replicates is 5 × 10³.
Extended Data Figure 2:
Extended Data Figure 2:. Signal recovery of SynSurr relative to the oracle GWAS for height and FEV1.
A slope of 1.0 indicates that the estimated effect sizes are consistent with the oracle effect sizes. Note that although the slope deviates from 1.0 at 90% missigness, the slope approaches 1.0 as missingness declines. The following figure, which assesses signal recovery for standard GWAS, provides a point of comparison for the R2 values.
Extended Data Figure 3:
Extended Data Figure 3:. Signal recovery of imputation-based approaches and SynSurr relative to the oracle GWAS for height with 50% missingness.
A slope of 1.0 indicates that the estimated effect sizes are consistent with the oracle effect sizes, whereas a slope deviating from 1.0 suggests the presence of bias.
Extended Data Figure 4:
Extended Data Figure 4:. Predicted vs. observed values of body composition phenotypes within the model-building and GWAS data sets.
A random forest was trained to predict each of the 6 body composition phenotypes, obtained via DEXA scan, using 4,584 subjects allocated to the model-building data set. The GWAS dataset consists of 29,577 unrelated subjects with body compositions measured via DEXA. Model inputs included age, sex, height, body weight, body mass index, and 5 impedance measures (whole body, left arm, right arm, left leg and right leg).
Extended Data Figure 5:
Extended Data Figure 5:. Distribution of predicted body masses comparing subjects with and without DEXA measurements.
The violin plot shows the kernel density estimation of the distribution of the data, with the tips of the violin indicating the maximum and minimum observed values among subjects. Sample sizes: n=29,577 independent subjects with DEXA measurements; n=317,921 subjects without DEXA measurements.
Extended Data Figure 6:
Extended Data Figure 6:. SynSurr remains unbiased and properly controls the type I error when the same data are utilized for model training and for GWAS.
The number of subjects with observed phenotypes was n=103, while the number with missing phenotypes was varied to achieve the indicated level of missingness. The model that generated the synthetic surrogate was either trained in the GWAS data set or in an independent data set of size n=103. Upper shows the distribution of effect sizes across 20 × 103. The true genetic effect size is βG=0.1. The center of the box plot is the median, the upper and lower bounds of the box are the 75th and 25th percentiles, and the whiskers extend from the 5th to the 95th percentile. Lower shows the average χ2 statistic under H0:βG=0 across 50 × 103 simulation replicates, for which the expected value is 1.0. Error bars are 95% confidence intervals for the mean. Panel A (left) considers a “misspecified” (k=2) model that can only capture quadratic dependence of Y on X, while Panel B (right) considers a “correctly specified” model (k=3) that can capture the cubic dependence. As seen, the validity of SynSurr is not contingent on correct specification of the surrogate model.
Extended Data Figure 7:
Extended Data Figure 7:. Survey of assumptions surrounding missing phenotypic data in GWAS.
The methods sections of all studies contributing summary statistics to the GWAS catalog between May 1st and November 1st, 2023, were manually reviewed. Among 47 studies, 24 did not address missing phenotypic data. Of the 23 remaining, 21 made an assumption of missing at random (MAR) or missing completely at random (MCAR).
Figure 1:
Figure 1:. Graphical overview of a SynSurr GWAS.
A. The data set is first split into a fully labeled model-building data set, including the target phenotype and surrogates, and a partially labeled inference data set, which also includes genetics. B. Within the model-building data set, an imputation model is trained to predicted the target phenotype on the basis of surrogates. C. The imputation model is transferred to the partially labeled inference data set and applied to predict the target outcome for all subjects. The predicted value of the target outcome is referred to as the “synthetic surrogate”. Importantly, the synthetic surrogate is maintained as a separate and distinct outcome from the partially missing target phenotype. D. Finally, within the inference data set, the partially missing target phenotype and the fully observed synthetic surrogate are jointly regressed on genotype and covariates to identify genetic variants associated with the target outcome.
Figure 2:
Figure 2:. Unlike imputation-based estimators, SynSurr is robust to misspecification of the imputation model.
The true value for the parameter of interest is βG=0.1, corresponding to a variant with h2=1%. For each estimator, the sample size is n=104, the mean value across 103 simulations is shown by the point, and two 95% confidence intervals (CIs) are presented: the dotted CI is based on the analytical standard error (SE) while the solid CI is based on the empirical SE. The oracle estimator has access to the complete version of Y, before 25% of values were set to missing. The standard estimator has access to the observed values of Y only. The imputation-based estimators impute the missing values of Y using an imputation-model fit on an independent data set. The set of covariates used to fit the imputation model are shown as a tuple: the imputation model based on G and X is correctly specified, whereas that based on G alone or X alone is misspecified. The SynSurr estimator jointly analyzes the partially missing Y with the synthetic surrogate Y^, where Y^ is generated for all subjects from the imputation model. The key observation is that SynSurr does not require a correctly specified generative model to yield unbiased estimation and valid inference.
Figure 3:
Figure 3:. SynSurr controls type I error across missingness rates and target-surrogate correlations.
Type I error is the probability of incorrectly rejecting the null hypothesis H0:βG=0. In all cases, the number of subjects with observed phenotypes was n=103. The number of subjects with missing phenotypes was varied to achieve the indicated level of missingness. The synthetic surrogate has correlation ρ{0.00,0.25,0.50,0.75} with the target phenotype. The number of simulation replicates is 106. P-values are two-sided and were calculated by SynSurr. Error bands (dashed black lines) represent 95% confidence intervals around the expected −log10 (p-values) under the null hypothesis. Adherence to the diagonal (red line) indicates that the p-values are uniformly distributed under the null.
Figure 4:
Figure 4:. Power of SynSurr across various missing rates, target-surrogate correlations, and SNP heritabilities.
Power is the probability of correctly rejecting the null hypothesis H0:βG=0. In all cases, the number of subjects with observed phenotypes was n=103. The number of subjects with missing phenotypes was varied to achieve the indicated level of missingness. In each panel, the synthetic surrogate has correlation ρ{0.00,0.25,0.50,0.75} with the target phenotype and the SNP heritability was varied from 0.1% to 1%. When there is no missingness, SynSurr is equivalent to the standard analysis and shows no variation across values of ρ. The power of SynSurr increases with increasing missingness and target-surrogate correlation. The number of simulation replicates is 104.
Figure 5:
Figure 5:. Comparing SynSurr and standard GWAS with respect to the number and significance of genome-wide significant associations for body composition traits.
A. Number of genome-wide significant (GWS) associations (p<5×10⁸) with DEXA body composition traits for standard and synthetic surrogate (SynSurr) GWAS. P-values are two-sided and are calculated by linear regression (Standard) or SynSurr. B. Average χ2 statistic at the union of variants that reached genome-wide significance under either method. A greater expected χ2 statistic directly corresponds to greater power to detect an association. Error bars are 95% confidence intervals for the mean. The number of independent GWS variants averaged across is shown in A.
Figure 6:
Figure 6:. External validation via overlap of genome-wide significant variants for body composition with associations from the GWAS catalog.
Variants from the GWAS catalog associated with body fat distribution, body fat percentage, fat body mass, and lean body mass were compiled. A study variant was considered overlapped if it fell within 250 kb of a GWAS catalog variant. Panels A and B show the counts and proportions of overlapped variants, respectively. Note that, with 1 exception, all variants identified by standard GWAS were also identified by SynSurr (Supplementary Table 21). The perfect overlap of the standard GWAS variants with known body composition associations in panel B is a direct consequence of the standard GWAS detecting very few genome-wide significant variants (8.3 on average), and indicates that all of these variants were previously known.

Similar articles

Cited by

  • Influence of multi-species data on gene-disease associations in substance use disorder using random walk with restart models.
    Castaneda EU, Moore S, Bubier JA, Grady SK, Langston MA, Chesler EJ, Baker EJ. Castaneda EU, et al. PLoS One. 2025 Jun 16;20(6):e0325201. doi: 10.1371/journal.pone.0325201. eCollection 2025. PLoS One. 2025. PMID: 40522980 Free PMC article.
  • A statistical framework for powerful multi-trait rare variant analysis in large-scale whole-genome sequencing studies.
    Li X, Chen H, Selvaraj MS, Van Buren E, Zhou H, Wang Y, Sun R, McCaw ZR, Yu Z, Arnett DK, Bis JC, Blangero J, Boerwinkle E, Bowden DW, Brody JA, Cade BE, Carson AP, Carlson JC, Chami N, Chen YI, Curran JE, de Vries PS, Fornage M, Franceschini N, Freedman BI, Gu C, Heard-Costa NL, He J, Hou L, Hung YJ, Irvin MR, Kaplan RC, Kardia SLR, Kelly T, Konigsberg I, Kooperberg C, Kral BG, Li C, Loos RJF, Mahaney MC, Martin LW, Mathias RA, Minster RL, Mitchell BD, Montasser ME, Morrison AC, Palmer ND, Peyser PA, Psaty BM, Raffield LM, Redline S, Reiner AP, Rich SS, Sitlani CM, Smith JA, Taylor KD, Tiwari H, Vasan RS, Wang Z, Yanek LR, Yu B; NHLBI Trans-Omics for Precision Medicine (TOPMed) Consortium; Rice KM, Rotter JI, Peloso GM, Natarajan P, Li Z, Liu Z, Lin X. Li X, et al. bioRxiv [Preprint]. 2023 Nov 2:2023.10.30.564764. doi: 10.1101/2023.10.30.564764. bioRxiv. 2023. Update in: Nat Comput Sci. 2025 Feb;5(2):125-143. doi: 10.1038/s43588-024-00764-8. PMID: 37961350 Free PMC article. Updated. Preprint.
  • A statistical framework for multi-trait rare variant analysis in large-scale whole-genome sequencing studies.
    Li X, Chen H, Selvaraj MS, Van Buren E, Zhou H, Wang Y, Sun R, McCaw ZR, Yu Z, Jiang MZ, DiCorpo D, Gaynor SM, Dey R, Arnett DK, Benjamin EJ, Bis JC, Blangero J, Boerwinkle E, Bowden DW, Brody JA, Cade BE, Carson AP, Carlson JC, Chami N, Chen YI, Curran JE, de Vries PS, Fornage M, Franceschini N, Freedman BI, Gu C, Heard-Costa NL, He J, Hou L, Hung YJ, Irvin MR, Kaplan RC, Kardia SLR, Kelly TN, Konigsberg I, Kooperberg C, Kral BG, Li C, Li Y, Lin H, Liu CT, Loos RJF, Mahaney MC, Martin LW, Mathias RA, Mitchell BD, Montasser ME, Morrison AC, Naseri T, North KE, Palmer ND, Peyser PA, Psaty BM, Redline S, Reiner AP, Rich SS, Sitlani CM, Smith JA, Taylor KD, Tiwari HK, Vasan RS, Viali S, Wang Z, Wessel J, Yanek LR, Yu B; NHLBI Trans-Omics for Precision Medicine (TOPMed) Consortium; Dupuis J, Meigs JB, Auer PL, Raffield LM, Manning AK, Rice KM, Rotter JI, Peloso GM, Natarajan P, Li Z, Liu Z, Lin X. Li X, et al. Nat Comput Sci. 2025 Feb;5(2):125-143. doi: 10.1038/s43588-024-00764-8. Epub 2025 Feb 7. Nat Comput Sci. 2025. PMID: 39920506 Free PMC article.
  • Genetic association studies using disease liabilities from deep neural networks.
    Yang L, Sadler MC, Altman RB. Yang L, et al. Am J Hum Genet. 2025 Mar 6;112(3):675-692. doi: 10.1016/j.ajhg.2025.01.019. Epub 2025 Feb 21. Am J Hum Genet. 2025. PMID: 39986278 Free PMC article.
  • Valid inference for machine learning-assisted genome-wide association studies.
    Miao J, Wu Y, Sun Z, Miao X, Lu T, Zhao J, Lu Q. Miao J, et al. Nat Genet. 2024 Nov;56(11):2361-2369. doi: 10.1038/s41588-024-01934-0. Epub 2024 Sep 30. Nat Genet. 2024. PMID: 39349818 Free PMC article.

References

    1. Kurki M, Karjalainen J, Palta P, et al. FinnGen provides genetic insights from a well-phenotyped isolated population. Nature 613, 508–518 (2023). - PMC - PubMed
    1. Gaziano JM et al. Million Veteran Program: A mega-biobank to study genetic influences on health and disease. Journal of clinical epidemiology 70, 214–223 (2016). - PubMed
    1. Bycroft C. et al. The UK Biobank resource with deep phenotyping and genomic data. Nature 562, 203–209 (2018). - PMC - PubMed
    1. Beesley LJ et al. The emerging landscape of health research based on biobanks linked to electronic health records: Existing resources, statistical challenges, and potential opportunities. Statistics in medicine 39, 773–800 (2020). - PMC - PubMed
    1. Tan VY & Timpson NJ The UK Biobank: A Shining Example of Genome-Wide Association Study Science with the Power to Detect the Murky Complications of Real-World Epidemiology. Annual Review of Genomics and Human Genetics 23 (2022). - PubMed

Methods-only References

    1. Lawlor D, Harbord R, Sterne J, Timpson N & Smith G Mendelian randomization: Using genes as instruments for makingcausal inferences in epidemiology. Statistics in Medicine 27, 1133–1163 (2008). - PubMed
    1. McCaw Z. Surrogate Regression 10.5281/zenodo.10897842. - DOI
    1. Gao J, Gronsbell J & McCaw Z Synthetic Surrogate Analysis 10.5281/zenodo.10901237. - DOI
    1. McCaw ZR SurrogateRegression: Surrogate Outcome Regression Analysis Comprehensive R Archive Network (2020). https://CRAN.R-project.org/package=SurrogateRegression.
    1. Meng X-L & Rubin DB Maximum likelihood estimation via the ECM algorithm: A general framework. Biometrika 80, 267–278 (1993).

LinkOut - more resources