

Revealing critical mechanisms in determining sorghum resistance to drought and salt using mRNA, small RNA and degradome sequencing
- PMID: 38872092
- PMCID: PMC11177356
- DOI: 10.1186/s12870-024-05230-1
Revealing critical mechanisms in determining sorghum resistance to drought and salt using mRNA, small RNA and degradome sequencing
Abstract
Background: Plant growth and development are severely threatened by drought and salt stresses. Compared with structural genes, transcription factors (TFs) play more pivotal roles in plant growth and stress adaptation. However, the underlying mechanisms of sorghum adapting to drought and salt are insufficient, and systematic analysis of TFs in response to the above stresses is lacking.
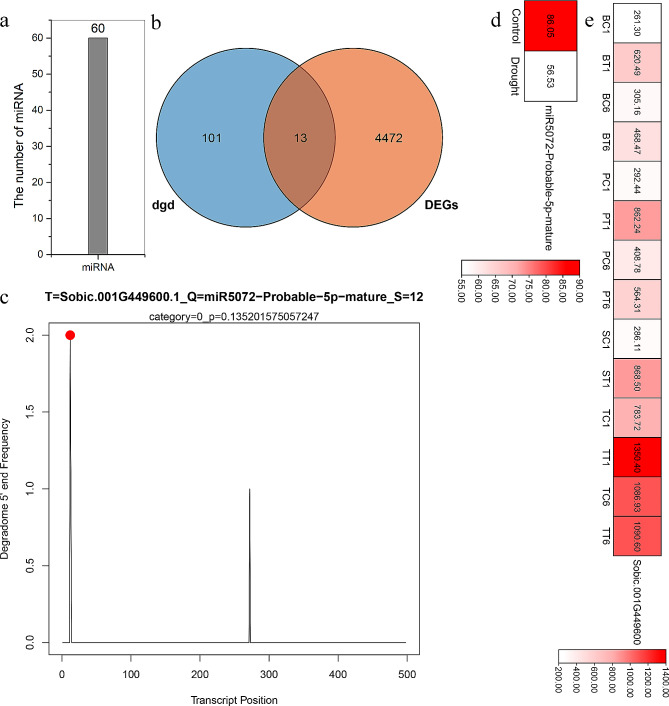
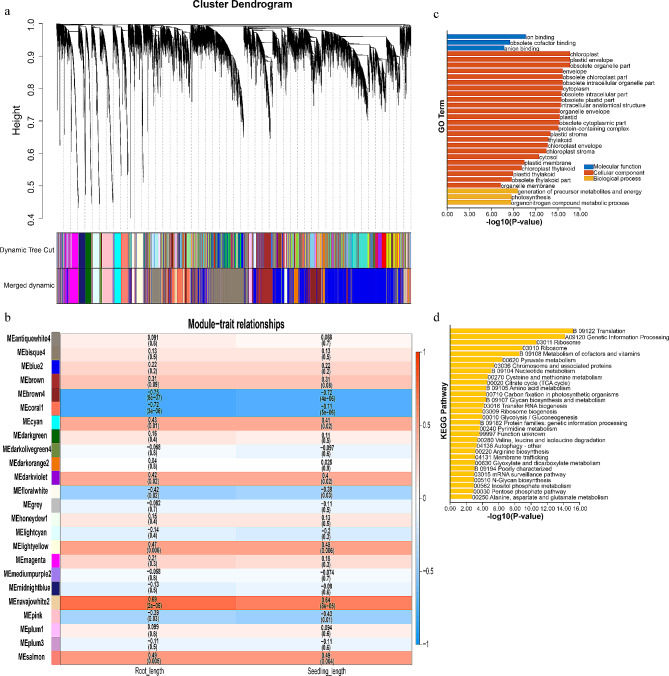
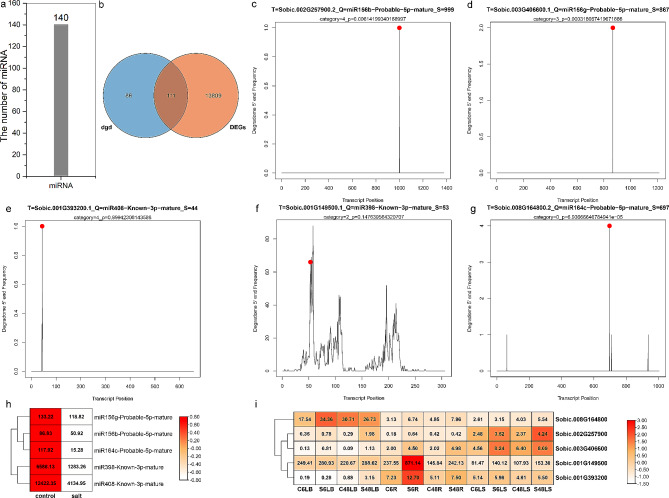
Results: In this study, TFs were identified in sorghum and model plants (Arabidopsis thaliana and rice), and gene number and conserved domain were compared between sorghum and model plants. According to syntenic analysis, the expansion of sorghum and rice TFs may be due to whole-genome duplications. Between sorghum and model plants TFs, specific conserved domains were identified and they may be related to functional diversification of TFs. Forty-five key genes in sorghum, including four TFs, were likely responsible for drought adaption based on differently expression analysis. MiR5072 and its target gene (Sobic.001G449600) may refer to the determination of sorghum drought resistance according to small RNA and degradome analysis. Six genes were associated with drought adaptation of sorghum based on weighted gene co-expression network analysis (WGCNA). Similarly, the core genes in response to salt were also characterized using the above methods. Finally, 15 candidate genes, particularly two TFs (Sobic.004G300300, HD-ZIP; Sobic.003G244100, bZIP), involved in combined drought and salt resistance of sorghum were identified.
Conclusions: In summary, the findings in this study help clarify the molecular mechanisms of sorghum responding to drought and salt. We identified candidate genes and provide important genetic resource for potential development of drought-tolerant and salt-tolerant sorghum plants.
Keywords: Drought; Multiomics; Salt; Sorghum; Transcription factor.
© 2024. The Author(s).
Conflict of interest statement
The authors declare no competing interests.
Figures


Similar articles
-
Five novel transcription factors as potential regulators of OsNHX1 gene expression in a salt tolerant rice genotype.Plant Mol Biol. 2017 Jan;93(1-2):61-77. doi: 10.1007/s11103-016-0547-7. Epub 2016 Oct 20. Plant Mol Biol. 2017. PMID: 27766460
-
Genome-wide analyses of direct target genes of four rice NAC-domain transcription factors involved in drought tolerance.BMC Genomics. 2018 Jan 12;19(1):40. doi: 10.1186/s12864-017-4367-1. BMC Genomics. 2018. PMID: 29329517 Free PMC article.
-
Cross-species multiple environmental stress responses: An integrated approach to identify candidate genes for multiple stress tolerance in sorghum (Sorghum bicolor (L.) Moench) and related model species.PLoS One. 2018 Mar 28;13(3):e0192678. doi: 10.1371/journal.pone.0192678. eCollection 2018. PLoS One. 2018. PMID: 29590108 Free PMC article.
-
Transcription Factors Associated with Abiotic and Biotic Stress Tolerance and Their Potential for Crops Improvement.Genes (Basel). 2019 Sep 30;10(10):771. doi: 10.3390/genes10100771. Genes (Basel). 2019. PMID: 31575043 Free PMC article. Review.
-
Association between Reactive Oxygen Species, Transcription Factors, and Candidate Genes in Drought-Resistant Sorghum.Int J Mol Sci. 2024 Jun 12;25(12):6464. doi: 10.3390/ijms25126464. Int J Mol Sci. 2024. PMID: 38928168 Free PMC article. Review.
References
-
- Zheng LW, Ma SJ, Zhou T, Yue CP, Hua YP, Huang JY. Genome-wide identification of Brassicaceae B-BOX genes and molecular characterization of their transcriptional responses to various nutrient stresses in allotetraploid rapeseed. BMC Plant Biol. 2021;21(1):288. doi: 10.1186/s12870-021-03043-0. - DOI - PMC - PubMed
-
- Zheng L, Yang Y, Ma S, Wang W, Zhang J, Yue C, Wang Y, Song M, Hao X, Huang J. Genome-wide identification of Brassinosteroid Signaling downstream genes in nine Rosaceae species and analyses of their roles in stem growth and stress response in Apple. Front Genet. 2021;12:640271. doi: 10.3389/fgene.2021.640271. - DOI - PMC - PubMed
MeSH terms
Substances
Grants and funding
LinkOut - more resources
Full Text Sources
