. 2024 Jun 13;22(1):328.
doi: 10.1186/s12964-024-01677-9.

Mitochondrial DNA release via the mitochondrial permeability transition pore activates the cGAS-STING pathway, exacerbating inflammation in acute Kawasaki disease

Affiliations

Mitochondrial DNA release via the mitochondrial permeability transition pore activates the cGAS-STING pathway, exacerbating inflammation in acute Kawasaki disease

Ke Wei et al. Cell Commun Signal. .

Abstract

Background: Kawasaki disease (KD) is an immune vasculitis of unknown origin, characterized by transient inflammation. The activation of the cGAS-STING pathway, triggered by mitochondrial DNA (mtDNA) release, has been implicated in the onset of KD. However, its specific role in the progression of inflammation during KD's acute phase remains unclear.

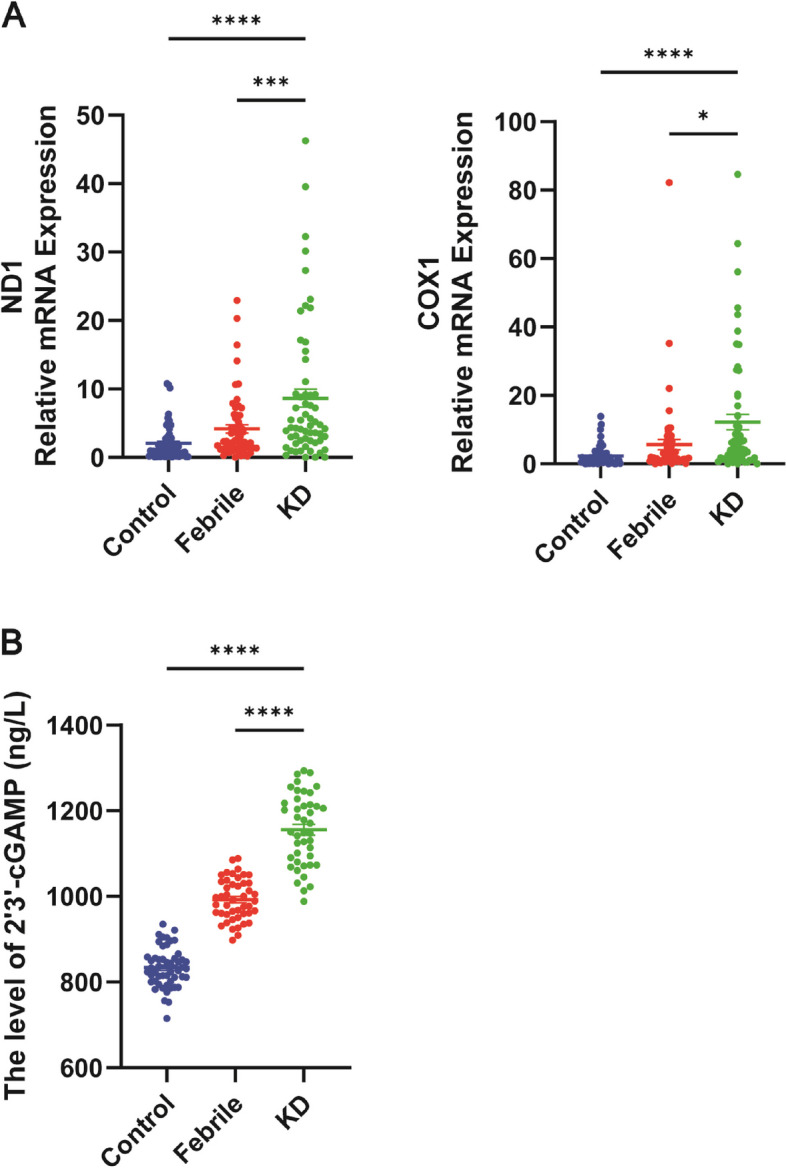
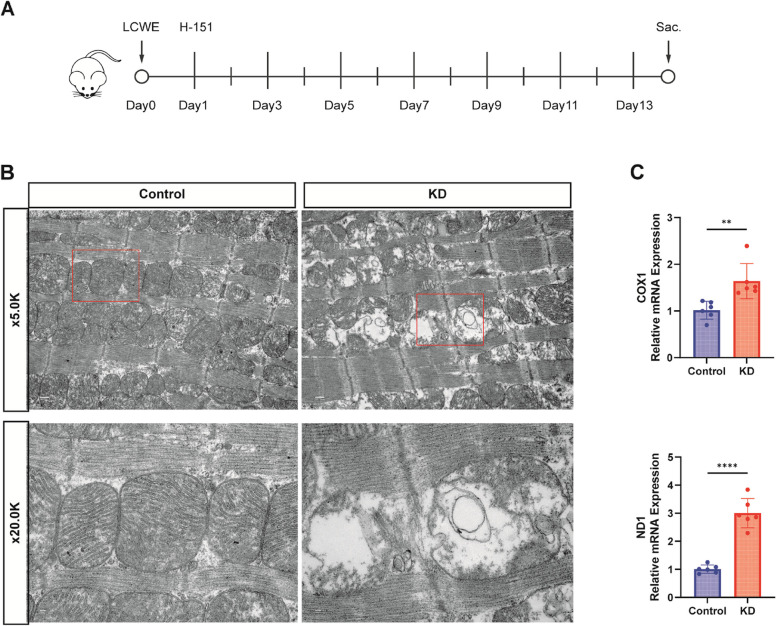
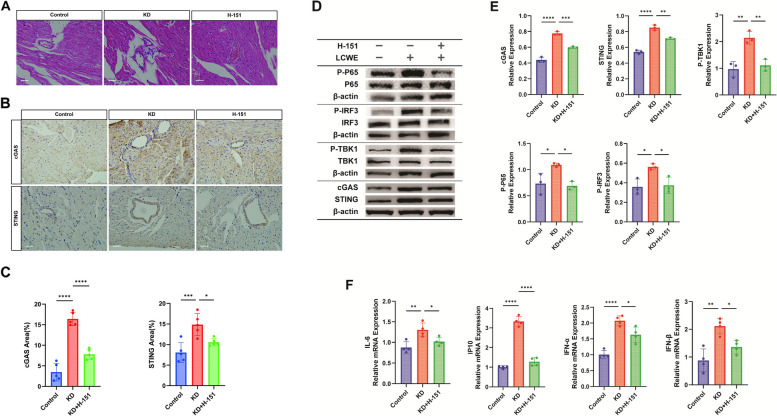
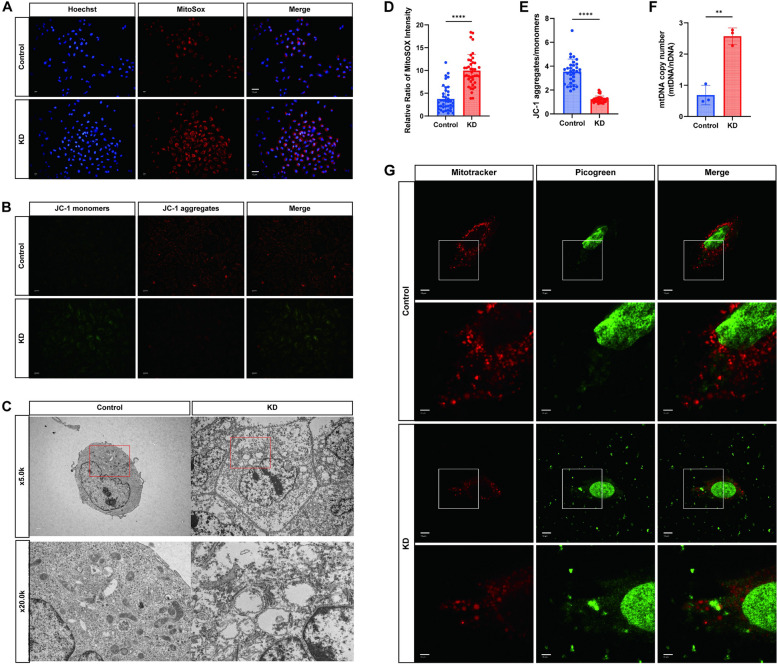
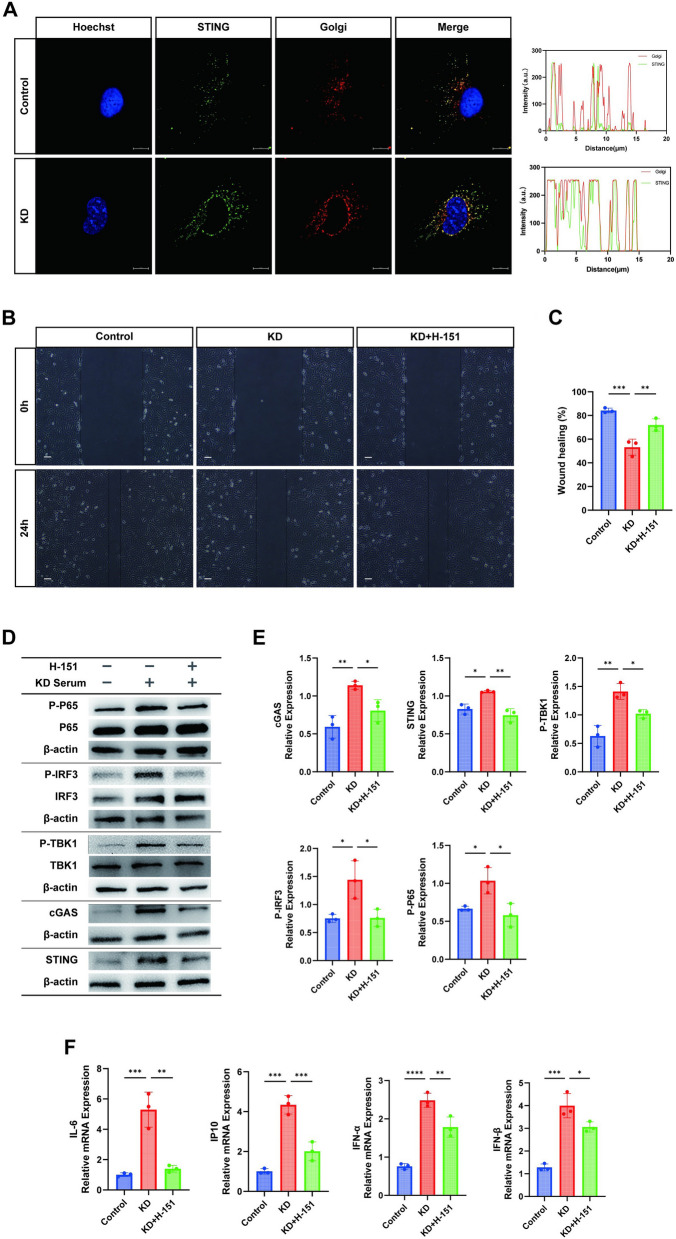
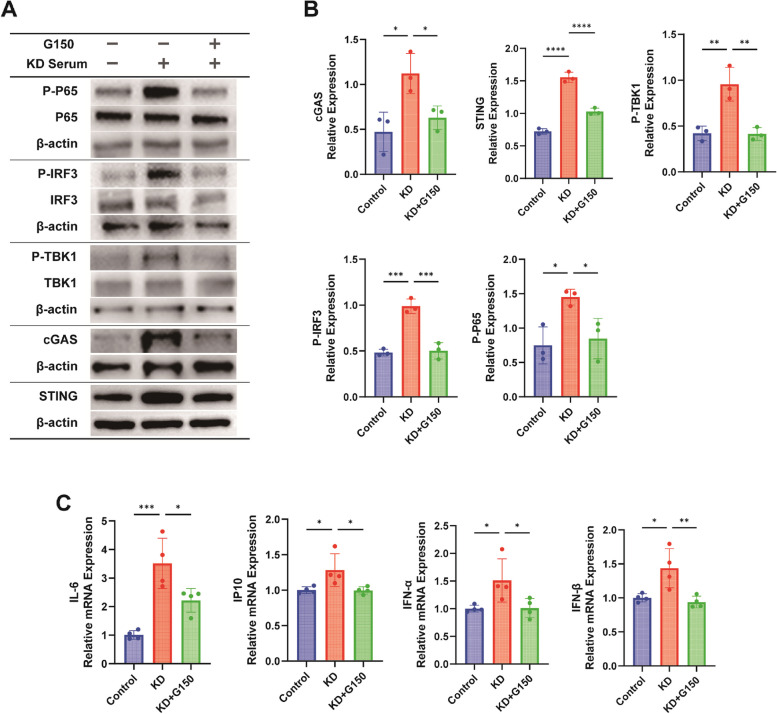
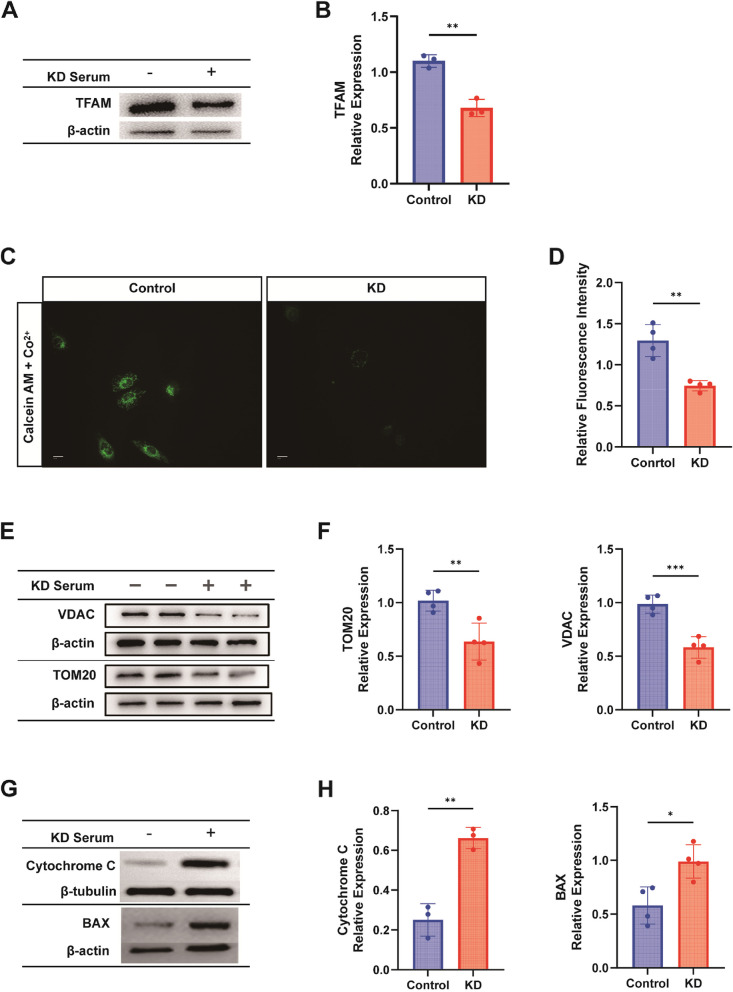
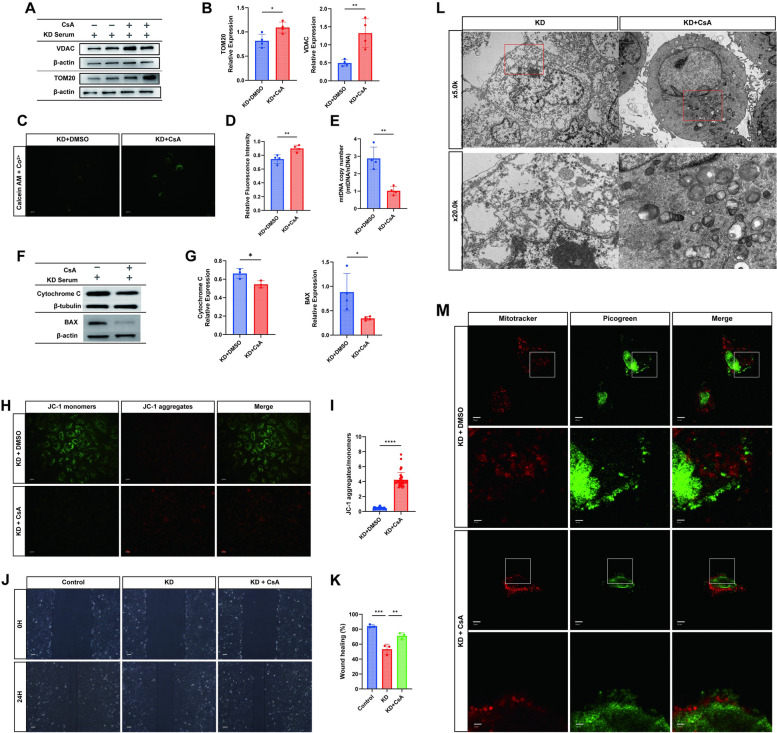
Methods: We measured mtDNA and 2'3'-cGAMP expression in KD patient serum using RT-qPCR and ELISA. A murine model of KD was induced by injecting Lactobacillus casei cell wall extract (LCWE), after which cGAS-STING pathway activation and inflammatory markers were assessed via immunohistochemistry, western blot, and RT-qPCR. Human umbilical vein endothelial cells (HUVECs) were treated with KD serum and modulators of the cGAS-STING pathway for comparative analysis. Mitochondrial function was evaluated using Mitosox staining, mPTP opening was quantified by fluorescence microscopy, and mitochondrial membrane potential (MMP) was determined with JC-1 staining.

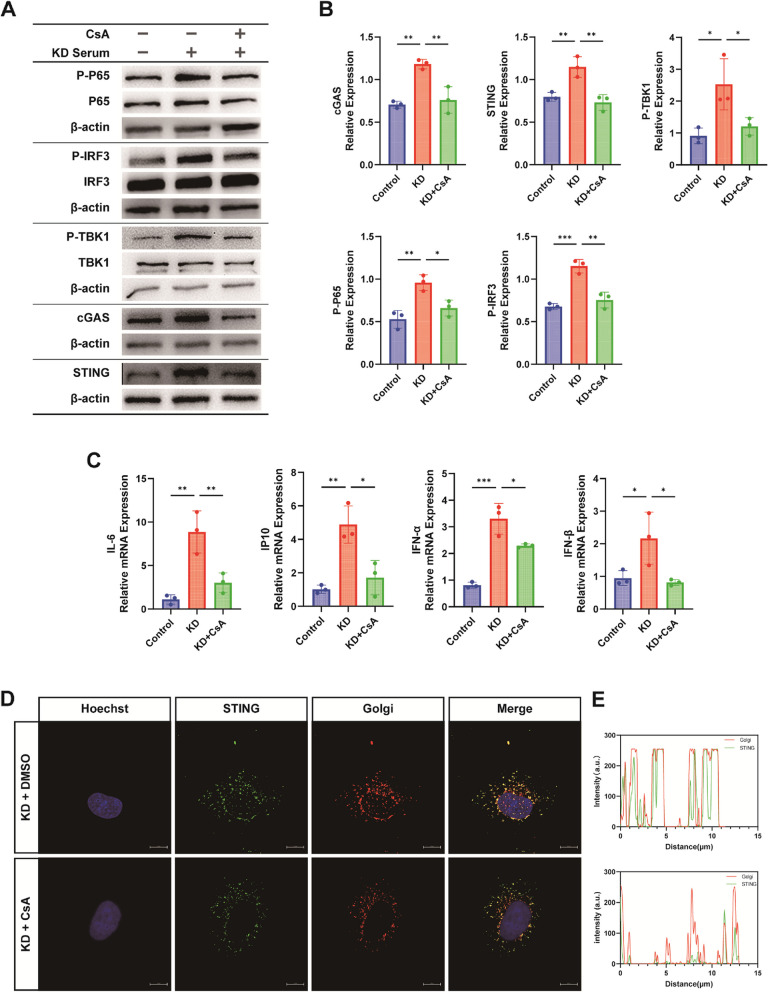
Results: KD patient serum exhibited increased mtDNA and 2'3'-cGAMP expression, with elevated levels of pathway-related proteins and inflammatory markers observed in both in vivo and in vitro models. TEM confirmed mitochondrial damage, and further studies demonstrated that inhibition of mPTP opening reduced mtDNA release, abrogated cGAS-STING pathway activation, and mitigated inflammation.

Conclusion: These findings indicate that mtDNA released through the mPTP is a critical activator of the cGAS-STING pathway, contributing significantly to KD-associated inflammation. Targeting mtDNA release or the cGAS-STING pathway may offer novel therapeutic approaches for KD management.

Keywords: Kawasaki disease; cGAS-STING pathway; mPTP; mtDNA.


Conflict of interest statement

The authors declare no competing interests.

Figures

Fig. 1
Fig. 1
Enhanced mtDNA Release and Elevated cGAS/STING Pathway Activation in KD Patients. A Quantification of peripheral blood free mitochondrial DNA was performed using qRT-PCR in the control, febrile, and Kawasaki disease (KD) groups (n = 60). B Expression levels of peripheral blood serum 2’3’-cGAMP were analyzed by ELISA among the different groups (n = 51). The data, shown as mean ± SEM from at least three independent experiments. Statistical analysis was performed using a t-test between two groups. Asterisks denote statistical significance: *P < 0.05, **P < 0.01, ***P < 0.001, ****P < 0.0001
Fig. 2
Fig. 2
Mitochondrial Damage and mtDNA Release in KD Animal Models. Control group: injected with equal volume of PBS, KD group: injected with LCWE, H-151 group: injected with H-151 (7 mg/kg) every other day after LCWE injection according to the modeling protocol. A Example of the modeling timeline of the mouse model simulating Kawasaki disease immune vasculitis. B Representative images of cardiac mitochondrial structure and morphology in control and KD mice observed under transmission electron microscopy (n = 3). Scale bar = 2.0 µm/500 nm. C RT-qPCR to detect the expression of peripheral blood plasma free mitochondrial DNA specific genes ND1 and COX1 mRNA in mice of the ccontrol and KD groups (n = 6)
Fig. 3
Fig. 3
Activation of the cGAS-STING Pathway in KD Animal Models. A HE staining to detect inflammatory infiltration of coronary arteries in mice of the Control, KD, and H-151 treatment groups (n = 5). Scale bar = 10 µm. B Representative images of immunohistochemistry showing expression of cGAS and STING in mice heart tissues (n = 5). Scale bar = 10 µm. C Relative quantitative statistics of the immunohistochemistry-positive area of cGAS and STING (n = 5). D Western Blot to detect the expression of key proteins of the cGAS-STING signaling pathway: cGAS, STING, P-TBK1, P-P65, P-IRF3 (n = 3) in mice heart tissues. E Quantitative statistical plots of relevant proteins detected by Western Blot (n = 3). F RT-qPCR to detect the expression of inflammatory factors downstream of the pathway: IL-6, IP10, IFNα, IFNβ mRNA (n = 4). T-test was used for data analysis between two groups, and one-way analysis of variance was used for data analysis of more than two groups. Data are shown as mean ± SD of at least three independent experiments. P values are indicated by asterisks: *P < 0.05, **P < 0.01, ***P < 0.001, ****P < 0.0001
Fig. 4
Fig. 4
Mitochondrial Dysfunction and mtDNA Release in KD Cell Models. A Representative fluorescence images showing mitochondrial superoxide detected by MitoSOX Red staining among different groups (n = 40). Scale bar = 10 µm. B Representative fluorescence images illustrating mitochondrial membrane potential stained with the JC-1 kit and observed via fluorescence microscopy for mitochondrial monomers and multimers (n = 32). Scale bar = 10 µm. C Representative images displaying the morphology and structure of mitochondria in cells from different groups observed under a transmission electron microscope (n = 3). Scale bar = 1.0/5.0 µm. D Bar graph depicting the quantification of MitoSOX signal intensity fluorescence (n = 40). E Bar graph representing the ratio of JC-1 monomer to multimer (n = 32). F Cytoplasmic DNA extracts without mitochondria were used to calculate the mitochondrial copy number of the various treatment groups via RT-qPCR (n = 3). G Mitotracker labeling of mitochondria and PicoGreen labeling of DNA were performed and observed under confocal microscopy in different treatment groups. Mitotracker labeled mitochondria, PicoGreen labeled DNA, and focusing microscopy were used to observe DNA not colocalizing with nuclei and mitochondria (n = 3). (Red: mitotracker, Green: mtDNA). Scale bar = 10/30 µm. T-test was utilized for data analysis between two groups. Data are presented as mean ± SD of at least three independent experiments. P-values are denoted by asterisks: *P < 0.05, **P < 0.01, ***P < 0.001, ****P < 0.0001
Fig. 5
Fig. 5
Activation of the cGAS-STING Axis in KD Cell Models. Control group: No special treatment, KD group: HUVECs co-cultured with KD inactivated serum for 24 h, H-151 group: HUVECs pre-treated with H-151 (1.5 µM) for 1 h, then co-cultured with KD inactivated serum for 24 h. A Confocal microscopy observation representative images depicting the colocalization of STING and Golgi apparatus with quantitative analysis of visualized co-localization. Scale bar = 10 µm. B-C Cell scratch assay for statistical comparison of cell migration ability and mobility among different groups (n = 3). Scale bar = 10 µm. D-E Western blotting for detection of cGAS-STING pathway-associated proteins (cGAS, STING, P-TBK1, P-IRF3, P-P65) in the control, KD, and H-151 groups (n = 3), with quantification of protein expression levels and grey values. F RT-qPCR to detect the expression of downstream inflammatory factors IL-6, IP10, IFNα and IFNβ (n = 3) mRNAs among the three groups. One-way analysis of variance was used for data analysis of more than two groups. Data are presented as mean ± SD from at least three independent experiments. p-values are denoted by asterisks: *P < 0.05, **P < 0.01, ***P < 0.001, ****P < 0.0001
Fig. 6
Fig. 6
Inhibition of cGAS Suppresses Inflammatory Responses in KD Cell Models. Control group: No special treatment, KD group: HUVECs co-cultured with KD inactivated serum for 24 h, G150 group: HUVECs pre-treated with G150 (5 µM) for 1 h, then co-cultured with KD inactivated serum for 24 h. A-B Western blot (WB) was used to detect the protein molecules and grayscale quantification of the cGAS-STING signaling pathway after the addition of G150 (n = 3). C RT-qPCR was used to detect the relative expression levels of inflammatory factor mRNA downstream of the cGAS-STING signaling pathway after the addition of G150 (n = 4). One-way analysis of variance was used for data analysis of more than two groups. Data are presented as mean ± SD from at least three independent experiments. p-values are denoted by asterisks: *P < 0.05, **P < 0.01, ***P < 0.001, ****P < 0.0001
Fig. 7
Fig. 7
Contribution of mPTP Opening and TFAM Downregulation to Cytoplasmic mtDNA Accumulation. A Western blot depicting the protein expression level of TFAM among different groups (n = 3). B Bar graph illustrating the quantification of grey values of TFAM in different groups (n = 3). C-D mPTP Opening Level Detection: Calciumxanthophyll AM/Co2 + quenching staining represented in fluorescence images for quantitative analysis of fluorescence intensity(n = 4). Scale bar = 10 µm. EF Western blot assay for VDAC (n = 4) and TOMM20 (n = 4) expression, along with a histogram for quantification of grey scale values. G-H Western blot assay for BAX (n = 4) and Cytochrome C (n = 3) expression, along with a histogram for quantification of grey scale values. T-test was utilized for data analysis between two groups. Data are presented as mean ± SD from at least three independent experiments. p-values are denoted by asterisks: *P < 0.05, **P < 0.01, ***P < 0.001, ****P < 0.0001
Fig. 8
Fig. 8
Pharmacological Inhibition of mPTP Reduces Cytoplasmic Mitochondrial DNA Accumulation and Improves Mitochondrial Function. Control Group: No special treatment, KD Group: HUVECs co-cultivated with KD inactivated serum for 24 h, CsA Group: HUVECs pre-treated with CsA (10 µM) for 1 h, followed by co-cultivation with KD inactivated serum for 24 h. A Western blot assay for VDAC (n = 4) and TOMM20 (n = 4) expression. B Quantification of grey values for TOM20 and VDAC (n = 4). C Representative fluorescence images of calcium xanthophyll AM/Co2 + quenching staining in Control and KD groups (n = 4). Scale bar = 10 µm. D Quantification of fluorescence intensity of the open level of mPTP in different treatments (n = 4). E Cytoplasmic DNA extracts without mitochondria used for calculating mitochondrial copy number in different treatment groups by qRT-PCR (n = 4). F-G Western blot assay for BAX (n = 4) and Cytochrome C (n = 3) expression, along with a histogram for quantification of grey scale values. H-I JC-1 kit staining of mitochondrial membrane potential and observation of mitochondrial monomers under a fluorescence microscope in different groups. Bar graphs represent the ratio of JC-1 monomers to multimers (n = 37). Scale bar = 10 µm. J-K Cellular scratch assay to detect cell migration ability between different groups. Bar graphs represent the rate of healing (n = 3). Scale bar = 10 µm. L Representative images of cellular mitochondrial morphology and structure under a transmission electron microscope (n = 3). Scale bar = 1.0/5.0 µm. M Confocal microscopy images of Mitotracker-labeled mitochondria, picogreen-labeled DNA, and DNA not colocalized with nuclei and mitochondria in different groups (n = 3). (Red: mitotracker, Green: mtDNA). Scale bar = 10 µm. Data analysis: T test for comparisons between two groups. One-way analysis of variance for comparisons of more than two groups. Data shown as mean ± SD of at least three independent experiments. p values indicated by asterisks: *P < 0.05, **P < 0.01, ***P < 0.001, ****P < 0.0001
Fig. 9
Fig. 9
Reduced mtDNA Release Attenuates Inflammatory Responses by Inhibiting cGAS-STING Activation. A-B Western blot analysis of cGAS-STING pathway-related proteins: cGAS, STING, P-TBK1, P-IRF3, and P-P65 (n = 3). C RT-qPCR quantification of downstream inflammatory factors IL-6, IP10, IFNα, IFNβ mRNA expression among the three groups (n = 3). D-E Representative images and visual co-localization analysis of STING colocalization with the Golgi apparatus observed under confocal microscopy. Scale bar = 10 µm. Data analysis: One-way analysis of variance used for data analysis of more than two groups. Data presented as mean ± SD of at least three independent experiments. p-values indicated by asterisks: *P < 0.05, **P < 0.01, ***P < 0.001, ****P < 0.0001

Similar articles

Cited by

References

    1. Gorelik M, Chung SA, Ardalan K, Binstadt BA, Friedman K, Hayward K, Imundo LF, Lapidus SK, Kim S, Son MB, Sule S, Tremoulet AH, Van Mater H, Yildirim-Toruner C, Langford CA, Maz M, Abril A, Guyatt G, Archer AM, Conn DL, Full KA, Grayson PC, Ibarra MF, Merkel PA, Rhee RL, Seo P, Stone JH, Sundel RP, Vitobaldi OI, Warner A, Byram K, Dua AB, Husainat N, James KE, Kalot M, Lin YC, Springer JM, Turgunbaev M, Villa-Forte A, Turner AS, Mustafa RA. 2021 American College of Rheumatology/Vasculitis Foundation Guideline for the Management of Kawasaki Disease. Arthritis Care Res (Hoboken) 2022;74(4):538–548. doi: 10.1002/acr.24838. - DOI - PubMed
    1. Koch RE, Josefson CC, Hill GE. Mitochondrial function, ornamentation, and immunocompetence. Biol Rev Camb Philos Soc. 2017;92(3):1459–1474. doi: 10.1111/brv.12291. - DOI - PubMed
    1. Yan C, Duanmu X, Zeng L, Liu B, Song Z. Mitochondrial DNA: Distribution, Mutations, and Elimination. Cells. 2019;8(4):379. doi: 10.3390/cells8040379. - DOI - PMC - PubMed
    1. Boguszewska K, Szewczuk M, Kaźmierczak-Barańska J, Karwowski BT. The Similarities between Human Mitochondria and Bacteria in the Context of Structure, Genome, and Base Excision Repair System. Molecules. 2020;25(12):2857. doi: 10.3390/molecules25122857. - DOI - PMC - PubMed
    1. Nogami H, Murachi S. Phalangeal acroosteolysis associated with Down syndrome. Birth Defects Orig Artic Ser. 1975;11(2):344–346. - PubMed

Publication types

MeSH terms