

Decoding temporal heterogeneity in NSCLC through machine learning and prognostic model construction
- PMID: 38872167
- PMCID: PMC11170806
- DOI: 10.1186/s12957-024-03435-0
Decoding temporal heterogeneity in NSCLC through machine learning and prognostic model construction
Abstract
Background: Non-small cell lung cancer (NSCLC) is a prevalent and heterogeneous disease with significant genomic variations between the early and advanced stages. The identification of key genes and pathways driving NSCLC tumor progression is critical for improving the diagnosis and treatment outcomes of this disease.
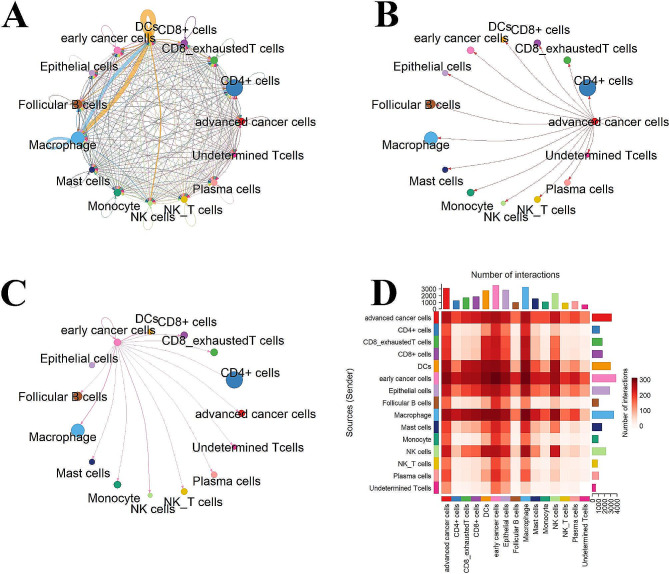
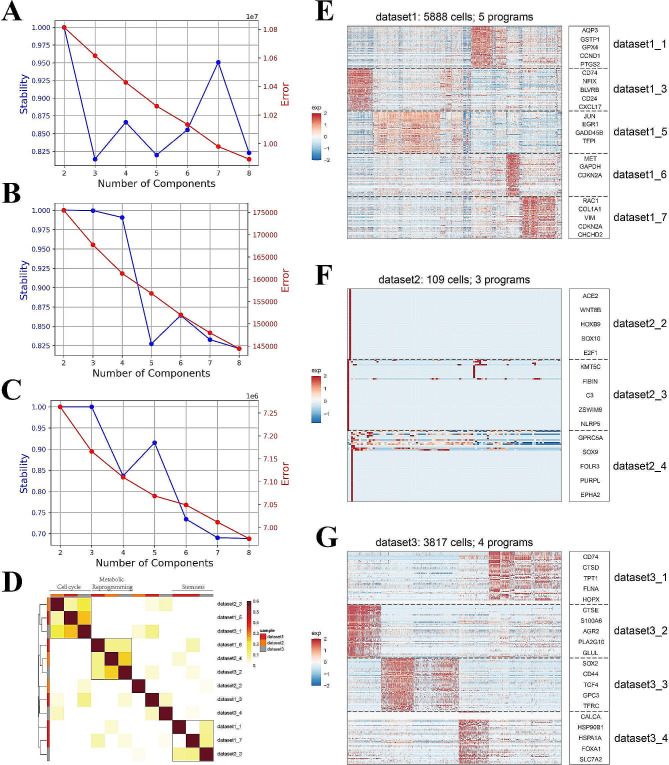
Methods: In this study, we conducted single-cell transcriptome analysis on 93,406 cells from 22 NSCLC patients to characterize malignant NSCLC cancer cells. Utilizing cNMF, we classified these cells into distinct modules, thus identifying the diverse molecular profiles within NSCLC. Through pseudotime analysis, we delineated temporal gene expression changes during NSCLC evolution, thus demonstrating genes associated with disease progression. Using the XGBoost model, we assessed the significance of these genes in the pseudotime trajectory. Our findings were validated by using transcriptome sequencing data from The Cancer Genome Atlas (TCGA), supplemented via LASSO regression to refine the selection of characteristic genes. Subsequently, we established a risk score model based on these genes, thus providing a potential tool for cancer risk assessment and personalized treatment strategies.
Results: We used cNMF to classify malignant NSCLC cells into three functional modules, including the metabolic reprogramming module, cell cycle module, and cell stemness module, which can be used for the functional classification of malignant tumor cells in NSCLC. These findings also indicate that metabolism, the cell cycle, and tumor stemness play important driving roles in the malignant evolution of NSCLC. We integrated cNMF and XGBoost to select marker genes that are indicative of both early and advanced NSCLC stages. The expression of genes such as CHCHD2, GAPDH, and CD24 was strongly correlated with the malignant evolution of NSCLC at the single-cell data level. These genes have been validated via histological data. The risk score model that we established (represented by eight genes) was ultimately validated with GEO data.
Conclusion: In summary, our study contributes to the identification of temporal heterogeneous biomarkers in NSCLC, thus offering insights into disease progression mechanisms and potential therapeutic targets. The developed workflow demonstrates promise for future applications in clinical practice.
Keywords: Machine learning; Non-small cell lung cancer; Temporal heterogeneity.
© 2024. The Author(s).
Conflict of interest statement
The authors declare no competing interests.
The authors have no conflicts of interest to declare.
Figures


Similar articles
-
Bioinformatic analysis revealing mitotic spindle assembly regulated NDC80 and MAD2L1 as prognostic biomarkers in non-small cell lung cancer development.BMC Med Genomics. 2020 Aug 14;13(1):112. doi: 10.1186/s12920-020-00762-5. BMC Med Genomics. 2020. PMID: 32795325 Free PMC article.
-
Revealing prognostic insights of programmed cell death (PCD)-associated genes in advanced non-small cell lung cancer.Aging (Albany NY). 2024 May 8;16(9):8110-8141. doi: 10.18632/aging.205807. Epub 2024 May 8. Aging (Albany NY). 2024. PMID: 38728242 Free PMC article.
-
Development of a prognostic model for NSCLC based on differential genes in tumour stem cells.Sci Rep. 2024 Sep 9;14(1):20938. doi: 10.1038/s41598-024-71317-2. Sci Rep. 2024. PMID: 39251710 Free PMC article.
-
Construction of a novel radioresistance-related signature for prediction of prognosis, immune microenvironment and anti-tumour drug sensitivity in non-small cell lung cancer.Ann Med. 2025 Dec;57(1):2447930. doi: 10.1080/07853890.2024.2447930. Epub 2025 Jan 10. Ann Med. 2025. PMID: 39797413 Free PMC article.
-
Genotyping and genomic profiling of non-small-cell lung cancer: implications for current and future therapies.J Clin Oncol. 2013 Mar 10;31(8):1039-49. doi: 10.1200/JCO.2012.45.3753. Epub 2013 Feb 11. J Clin Oncol. 2013. PMID: 23401433 Free PMC article. Review.
Cited by
-
Deciphering the role of acetylation-related gene NAT10 in colon cancer progression and immune evasion: implications for overcoming drug resistance.Discov Oncol. 2025 May 15;16(1):774. doi: 10.1007/s12672-025-02617-w. Discov Oncol. 2025. PMID: 40374962 Free PMC article.
References
MeSH terms
Substances
Grants and funding
- Grants No.62072144/National Natural Science Foundation of China
- Grants No. 61971166/National Natural Science Foundation of China
- LBH-Q20159/Postdoctoral Scientific Research Development Fund of Heilongjiang Province
- LBH-Q19144/Postdoctoral Scientific Research Development Fund of Heilongjiang Province
LinkOut - more resources
Full Text Sources
Medical
Research Materials
