. 2024 Jun 14;43(1):164.
doi: 10.1186/s13046-024-03073-0.

ALKBH5 promotes non-small cell lung cancer progression and susceptibility to anti-PD-L1 therapy by modulating interactions between tumor and macrophages

Affiliations

ALKBH5 promotes non-small cell lung cancer progression and susceptibility to anti-PD-L1 therapy by modulating interactions between tumor and macrophages

Xin Hua et al. J Exp Clin Cancer Res. .

Abstract

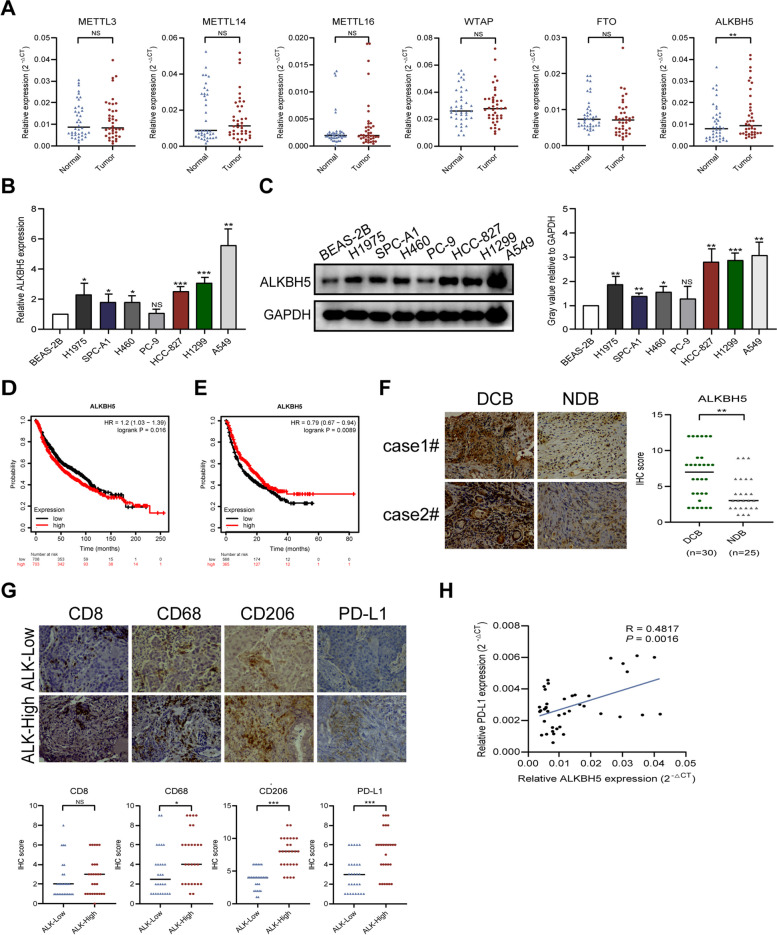
Background: Understanding the mechanisms that mediate the interaction between tumor and immune cells may provide therapeutic benefit to patients with cancer. The N6-methyladenosine (m6A) demethylase, ALKBH5 (alkB homolog 5), is overexpressed in non-small cell lung cancer. However, its role in the tumor microenvironment is unknown.

Methods: Datasets and tissue samples were used to determine the relationship between ALKBH5 expression and immunotherapy efficacy. Bioinformatic analysis, colorimetric assay to determine m6A RNA methylation, dual luciferase reporter assay, RNA/m6A-modified RNA immunoprecipitation, RNA stability assay, and RNA sequencing were used to investigate the regulatory mechanism of ALKBH5 in non-small cell lung cancer. In vitro and in vivo assays were performed to determine the contribution of ALKBH5 to the development of non-small cell lung cancer.

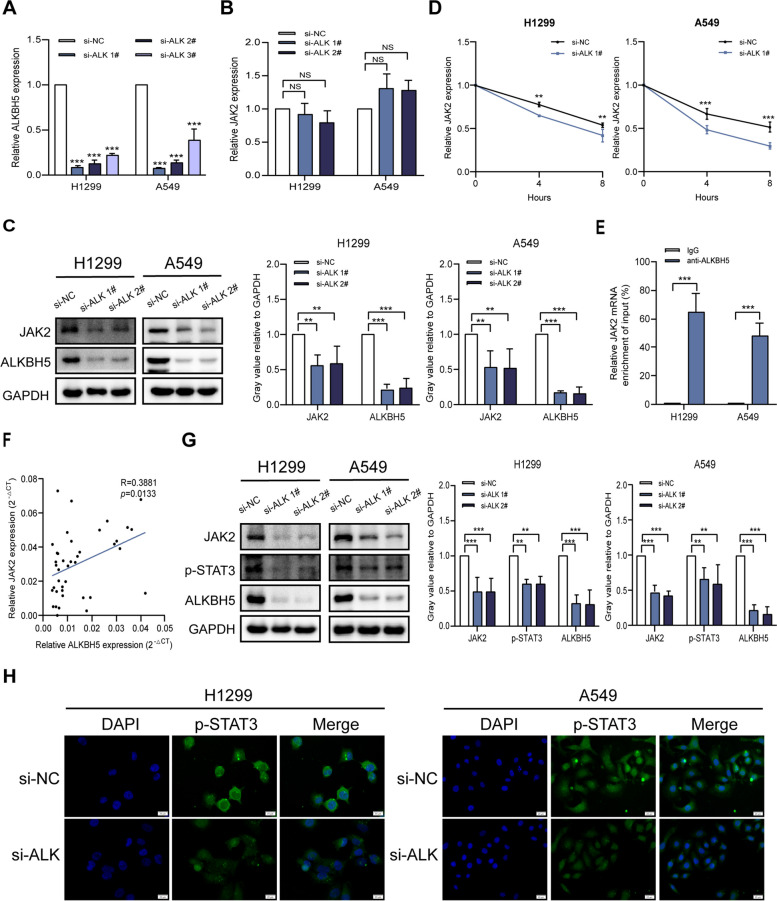
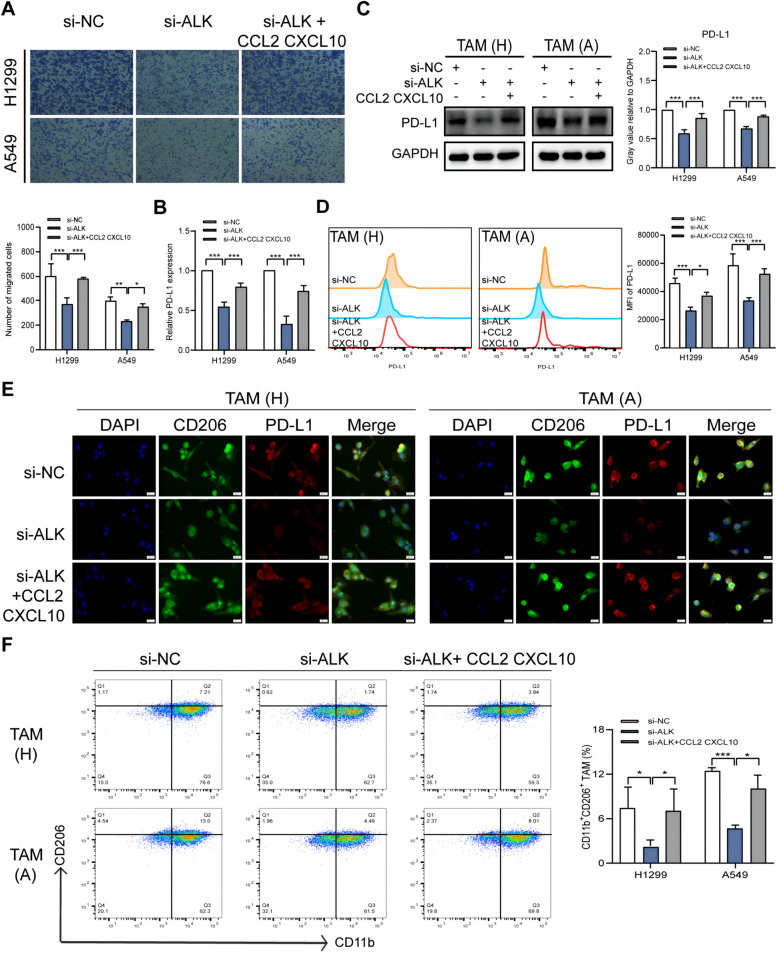
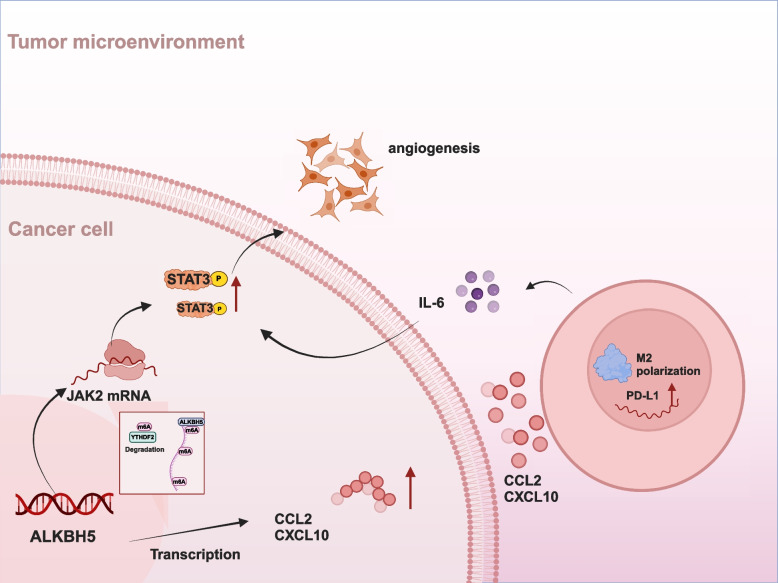
Results: ALKBH5 was upregulated in primary non-small cell lung cancer tissues. ALKBH5 was positively correlated with programmed death-ligand 1 expression and macrophage infiltration and was associated with immunotherapy response. JAK2 was identified as a target of ALKBH5-mediated m6A modification, which activates the JAK2/p-STAT3 pathway to promote non-small cell lung cancer progression. ALKBH5 was found to recruit programmed death-ligand 1-positive tumor-associated macrophages and promote M2 macrophage polarization by inducing the secretion of CCL2 and CXCL10. ALKBH5 and tumor-associated macrophage-secreted IL-6 showed a synergistic effect to activate the JAK2/p-STAT3 pathway in cancer cells.

Conclusions: ALKBH5 promotes non-small cell lung cancer progression by regulating cancer and tumor-associated macrophage behavior through the JAK2/p-STAT3 pathway and the expression of CCL2 and CXCL10, respectively. These findings suggest that targeting ALKBH5 is a promising strategy of enhancing the anti-tumor immune response in patients with NSCLC and that identifying ALKBH5 status could facilitate prediction of clinical response to anti-PD-L1 immunotherapy.

Keywords: ALKBH5; JAK2/p-STAT3 pathway; N6-methyladenosine demethylase; Non-small cell lung cancer; Tumor microenvironment; Tumor-associated macrophage.


Conflict of interest statement

The authors declare that they have no competing interests.

Figures

Fig. 1
Fig. 1
ALKBH5 is upregulated in NSCLC and is associated with the immune response. A qRT-PCR analysis of m6A regulators (ALKBH5, FTO, METTL3/14/16, and WTAP) in 40 pairs of NSCLC tissues and adjacent normal tissues. B qRT-PCR analysis of ALKBH5 expression in A549, BEAS-2B, H460, H1299, H1975, HCC-827, PC-9, and SPC-A1 cells. C Western blot analysis of ALKBH5 expression in A549, BEAS-2B, H460, H1299, H1975, HCC-827, PC-9, and SPC-A1 cells. GAPDH was used as the loading control. D Kaplan–Meier analysis of the relationship between ALKBH5 expression and overall survival in patients with lung cancer. E Kaplan–Meier analysis of the relationship between ALKBH5 expression and overall survival in patients with cancer treated with immunotherapy. F Representative immunohistochemical images of ALKBH5 in DCB (n = 30) and NDB (n = 25) groups (left panel; scale bar = 20 µm) and immunohistochemistry correlation analysis (right panel). G Representative immunohistochemical images of CD8, CD68, CD206, and PD-L1 in the low (n = 28) and high ALKBH5 (n = 27) expression groups (upper panel; scale bar = 20 µm) and immunohistochemistry correlation analysis (lower panel). H Pearson correlation coefficient analysis of ALKBH5 and PD-L1 expression in 40 cases of NSCLC. *P < 0.05; **P < 0.01; ***P < 0.001; NS, not significant
Fig. 2
Fig. 2
ALKBH5 upregulates JAK2 expression to activate the JAK2/p-STAT3 pathway. A qRT-PCR analysis of the efficiency of siRNA-mediated knockdown of ALKBH5 in A549 and H1299 cells. B qRT-PCR analysis of JAK2 expression in A549 and H1299 cells transfected with ALKBH5 siRNA. C Western blot analysis of ALKBH5 and JAK2 expression in A549 and H1299 cells transfected with ALKBH5 siRNA (loading control = GAPDH). D The mRNA stability of JAK2 in ALKBH5-knockdown A549 and H1299 cells treated with actinomycin D (5 µg/mL). E RIP–qRT-PCR analysis of the binding affinity of ALKBH5 to JAK2 in A549 and H1299 cells (control = IgG). F Pearson correlation coefficient analysis of ALKBH5 and JAK2 mRNA expression in 40 cases of NSCLC. G Western blot analysis of ALKBH5, JAK2, and p-STAT3 expression in A549 and H1299 cells with or without ALKBH5 knockdown (loading control = GAPDH). H Immunofluorescence analysis of p-STAT3 expression in A549 and H1299 cells with or without ALKBH5 knockdown (scale bar = 20 μm). **P < 0.01; ***P < 0.001; NS, not significant
Fig. 3
Fig. 3
ALKBH5 regulates JAK2 expression in an m6A-YTHDF2-dependent manner. A qRT-PCR analysis of the efficiency of ALKBH5 overexpression in H1299 and H1975 cells transfected with OE-NC, OE-ALKBH5, and OE-H204A. B Overall m6A deposited RNAs in H1299 and H1975 cells transfected with OE-NC, OE-ALKBH5, and OE-H204A detected using the colorimetric m6A assay. C Western blot analysis of ALKBH5, JAK2, and p-STAT3 expression in H1299 and H1975 cells transfected with OE-NC, OE-ALKBH5, or OE-H204A (loading control = GAPDH). D MeRIP–qRT-PCR analysis of m6A modification sequences of JAK2 transcript in ALKBH5 overexpression and knockdown H1299 cells. E Schematic showing the sequence of the wild type and m6A motif mutation (A to T) plasmids containing luciferase reporter gene vectors. F Dual luciferase reporter analysis of wild type and m6A motif mutation reporter vector plasmids in A549 and H1299 cells with or without ALKBH5 knockdown. G qRT-PCR analysis of the efficiency of YTHDF2 knockdown in siRNA-transfected A549 and H1299 cells. H qRT-PCR analysis of JAK2 mRNA expression in A549 and H1299 cells transfected with YTHDF2 siRNA. I Western blot analysis of JAK2 and YTHDF2 expression in A549 and H1299 cells with or without YTHDF2 knockdown (loading control = GAPDH). J RIP–qRT-PCR analysis of the binding affinity of YTHDF2 to JAK2 in A549 and H1299 cells (control = IgG). K The mRNA stability of JAK2 in YTHDF2-knockdown A549 and H1299 cells treated with actinomycin D (5 µg/mL). L Western blot analysis of JAK2 expression in ALKBH5-knockdown A549 and H1299 cells with or without YTHDF2 deficiency (loading control = GAPDH). *P < 0.05; **P < 0.01; ***P < 0.001; NS, not significant
Fig. 4
Fig. 4
ALKBH5 induces PD-L1 expression and the malignant phenotype of NSCLC by regulating the JAK2/p-STAT3 pathway. A qRT-PCR analysis of PD-L1 expression in ALKBH5-overexpressing H1299 and H1975 cells treated with or without AG490 (50 μM). B Western blot analysis of PD-L1 and p-STAT3 expression in ALKBH5-overexpressing H1299 and H1975 cells treated with AG490 (50 μM; loading control = GAPDH). C CCK-8 assay of the proliferation of ALKBH5-overexpressing H1299 and H1975 cells treated with or without AG490 (50 μM). D Colony formation assay of ALKBH5-overexpressing H1299 and H1975 cells treated with or without AG490 (50 μM). E Transwell assay of the migration of ALKBH5-overexpressing H1299 and H1975 cells treated with or without AG490 (50 μM). F Quantification of tube formation in HUVECs treated with the supernatant of ALKBH5-overexpressing H1299 and H1975 cells treated with or without AG490 (50 μM; magnification, × 100). G qRT-PCR analysis of VEGFA expression in ALKBH5-overexpressing H1299 and H1975 cells treated with or without AG490 (50 μM). H ELISA of VEGFA secreted into the supernatant of ALKBH5-overexpressing H1299 and H1975 cells treated with or without AG490 (50 μM). *P < 0.05; **P < 0.01; ***P < 0.001
Fig. 5
Fig. 5
RNA sequencing identifies CCL2 and CXCL10 as targets of ALKBH5. A Volcano plot of up- (red) and down-regulated (green) genes (log2[Fold Change] > 1 and P < 0.05) in H1299 cells transfected in triplicate with si-ALKBH5 or si-NC. B Gene Ontology analysis of differentially expressed genes after ALKBH5 knockdown. C qRT-PCR analysis of the expression of six selected chemokines in A549 and H1299 cells transfected with ALKBH5 siRNA. D ELISA of CCL2 and CXCL10 secreted into the supernatant of ALKBH5-knockdown A549 and H1299 cells. E qRT-PCR analysis of CCL2 and CXCL10 expression in H1299 and H1975 cells transfected with OE-NC, OE-ALKBH5, and OE-H204A. F ELISA of CCL2 and CXCL10 secreted into the supernatant of H1299 and H1975 cells transfected with OE-NC, OE-ALKBH5, and OE-H204A. *P < 0.05; **P < 0.01; ***P < 0.001; NS, not significant
Fig. 6
Fig. 6
ALKBH5 recruits PD-L1+ TAMs and promotes M2 macrophage polarization. A Transwell assay of the migration of PMA-stimulated THP-1 cells co-cultured with conditioned medium from ALKBH5-knockdown A549 and H1299 cells treated with or without CCL2 (200 ng/mL) and CXCL10 (50 ng/mL) recombinant proteins. B qRT-PCR analysis of PD-L1 expression in PMA-stimulated THP-1 cells co-cultured with ALKBH5-knockdown A549 and H1299 cells treated with or without CCL2 (200 ng/mL) and CXCL10 (50 ng/mL) recombinant proteins. C Western blot analysis of PD-L1 expression in PMA-stimulated THP-1 cells co-cultured with ALKBH5-knockdown A549 and H1299 cells treated with or without CCL2 (200 ng/mL) and CXCL10 (50 ng/mL) recombinant proteins (loading control = GAPDH). D Flow cytometry analysis of the mean fluorescence intensity (MFI) of PD-L1 in CD206+ TAMs co-cultured with ALKBH5-knockdown A549 and H1299 cells treated with or without CCL2 (200 ng/mL) and CXCL10 (50 ng/mL) recombinant proteins. E Immunofluorescence analysis of CD206+PD-L1+ TAMs in PMA-stimulated THP-1 cells co-cultured with ALKBH5-knockdown A549 and H1299 cells treated with or without CCL2 (200 ng/mL) and CXCL10 (50 ng/mL) recombinant proteins (blue = DAPI; green = CD206; red = PD-L1; scale bar = 20 µm). F Flow cytometry analysis of the percentage of CD11b+CD206+ TAMs in PMA-stimulated THP-1 cells co-cultured with ALKBH5-knockdown A549 and H1299 cells treated with or without CCL2 (200 ng/mL) and CXCL10 (50 ng/mL) recombinant proteins. *P < 0.05; **P < 0.01; ***P < 0.001
Fig. 7
Fig. 7
ALKBH5 has a synergistic effect with IL-6 on the activation of the JAK2/p-STAT3 pathway. A Schematic of the co-culture model (created with BioRender.com). B qRT-PCR analysis of IL-6 expression in A549 or H1299 cells, THP-1 macrophages, and PMA-stimulated THP-1 cells co-cultured with ALKBH5-knockdown or control A549 and H1299 cells. C ELISA of IL-6 secreted from A549 or H1299 cells, THP-1 macrophages, and PMA-stimulated THP-1 cells co-cultured with ALKBH5-knockdown or control A549 and H1299 cells. D qRT-PCR analysis of ALKBH5 expression in H1299 and H1975 cells treated with or without IL-6 (20 ng/mL). E Western blot analysis of ALKBH5, p-JAK2, and p-STAT3 expression in H1299 and H1975 cells treated with or without IL-6 (20 ng/mL; loading control = GAPDH). F Western blot analysis of p-STAT3 expression in ALKBH5-overexpressing H1299 and H1975 cells treated with or without IL-6 (20 ng/mL; loading control = GAPDH). *P < 0.05; **P < 0.01; ***P < 0.001; NS, not significant
Fig. 8
Fig. 8
ALKBH5 promotes tumor growth in vivo and is sensitive to anti PD-L1 therapy. A qRT-PCR analysis of the efficiency of ALKBH5 overexpression in LLC cells. B Western blot analysis of the efficiency of ALKBH5 overexpression in LLC cells (loading control = GAPDH). C Left panel: ALKBH5 overexpression promotes tumor growth in C57BL/6 J mice (n = 4). Middle panel: Tumor volumes measured by growth curve every three days from day 6 to day 21 after cell transplantation. Right panel: Tumor weight determined immediately after removal from C57BL/6 J mice. D qRT-PCR analysis of tumor mRNA expression of CCL2, CXCL10, JAK2, and PD-L1. E ELISA of CCL2 and CXCL10 in plasma. F Representative immunohistochemical images of ALKBH5, CD8, CD31, CD206, F4/80, JAK2, Ki-67, and PD-L1 expression in ALKBH5-overexpressing and control mice (upper panel; scale bar = 20 µm) and immunohistochemistry correlation analysis (lower panel). G qRT-PCR analysis of the efficiency of ALKBH5 knockdown in LLC cells. H Western blot analysis of the efficiency of ALKBH5 knockdown in LLC cells (loading control = GAPDH). I Schematic of the cell transplantation and drug administration experiment (created with BioRender.com). J Left panel: ALKBH5 knockdown and anti-PD-L1 therapy attenuated tumor growth in C57BL/6 J mice (n = 4). Middle panel: Tumor volumes measured by growth curve every three days from days 6 to 21 after cell transplantation. Right panel: Tumor weight determined immediately after removal from C57BL/6 J mice. K Tumor inhibition rate of ALKBH5-knockdown and control mice treated with anti-PD-L1 therapy. *P < 0.05; **P < 0.01; ***P < 0.001; NS, not significant
Fig. 9
Fig. 9
Illustrative model of the proposed mechanism.ALKBH5 promotes NSCLC progression and susceptibility to anti-PD-L1 therapy by modulating the interactions between tumor and macrophages (created with BioRender.com)

Similar articles

Cited by

References

    1. Siegel RL, Miller KD, Fuchs HE, Jemal A. Cancer statistics, 2022. CA Cancer J Clin. 2022;72:7–33. doi: 10.3322/caac.21708. - DOI - PubMed
    1. Kim SJ, Khadka D, Seo JH. Interplay between Solid Tumors and Tumor Microenvironment. Front Immunol. 2022;13:882718. doi: 10.3389/fimmu.2022.882718. - DOI - PMC - PubMed
    1. Mao XQ, Xu J, Wang W, Liang C, Hua J, Liu J, et al. Crosstalk between cancer-associated fibroblasts and immune cells in the tumor microenvironment: new findings and future perspectives. Mol Cancer. 2021;20:131. doi: 10.1186/s12943-021-01428-1. - DOI - PMC - PubMed
    1. Cheng C, Zhuge LD, Xiao X, Luan SY, Yuan Y. Overcoming resistance to PD-1/PD-L1 inhibitors in esophageal cancer. Front Oncol. 2022;12:955163. doi: 10.3389/fonc.2022.955163. - DOI - PMC - PubMed
    1. Tang Q, Chen Y, Li XJ, Long SQ, Shi Y, Yu YY, et al. The role of PD-1/PD-L1 and application of immune-checkpoint inhibitors in human cancers. Front Immunol. 2022;13:964442. doi: 10.3389/fimmu.2022.964442. - DOI - PMC - PubMed

MeSH terms