

Seabirds show foraging site and route fidelity but demonstrate flexibility in response to local information
- PMID: 38872225
- PMCID: PMC11177427
- DOI: 10.1186/s40462-024-00467-9
Seabirds show foraging site and route fidelity but demonstrate flexibility in response to local information
Abstract
Background: Fidelity to a given foraging location or route may be beneficial when environmental conditions are predictable but costly if conditions deteriorate or become unpredictable. Understanding the magnitude of fidelity displayed by different species and the processes that drive or erode it is therefore vital for understanding how fidelity may shape the demographic consequences of anthropogenic change. In particular, understanding the information that individuals may use to adjust their fidelity will facilitate improved predictions of how fidelity may change as environments change and the extent to which it will buffer individuals against such changes.
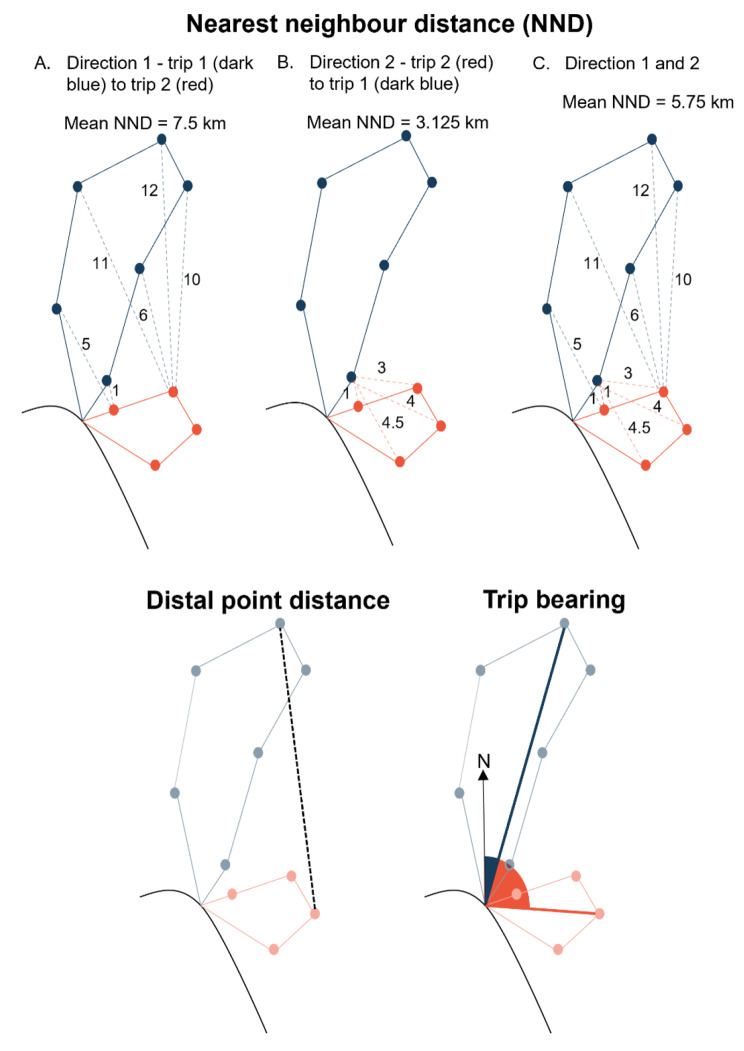
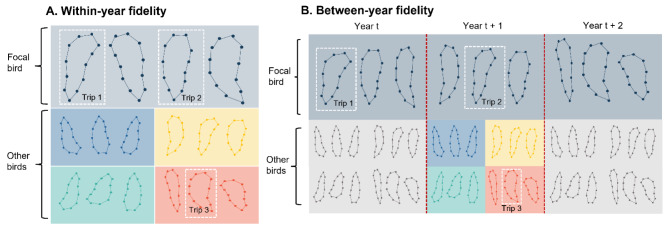
Methods: We used movement data collected during the breeding season across eight years for common guillemots, Atlantic puffins, razorbills, and black-legged kittiwakes breeding on the Isle of May, Scotland to understand: (1) whether foraging site/route fidelity occurred within and between years, (2) whether the degree of fidelity between trips was predicted by personal foraging effort, and (3) whether different individuals made more similar trips when they overlapped in time at the colony prior to departure and/or when out at sea suggesting the use of the same local environmental cues or information on the decisions made by con- and heterospecifics.
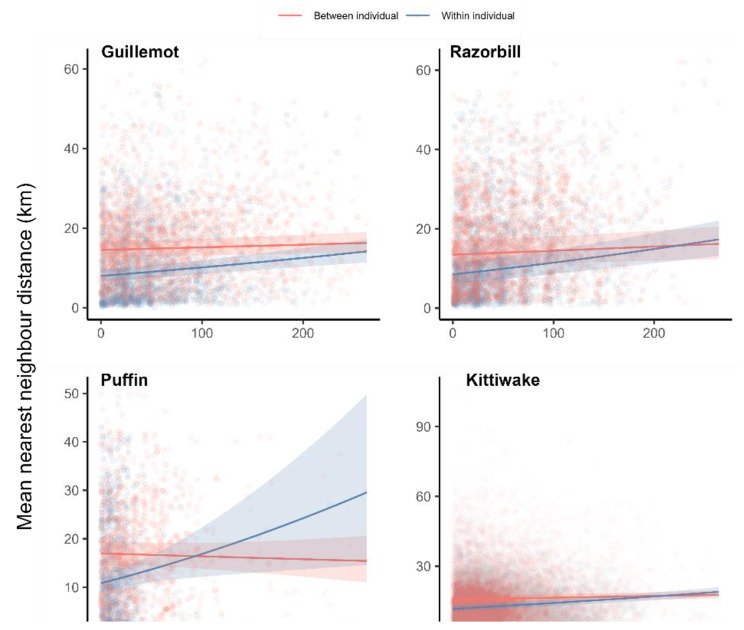
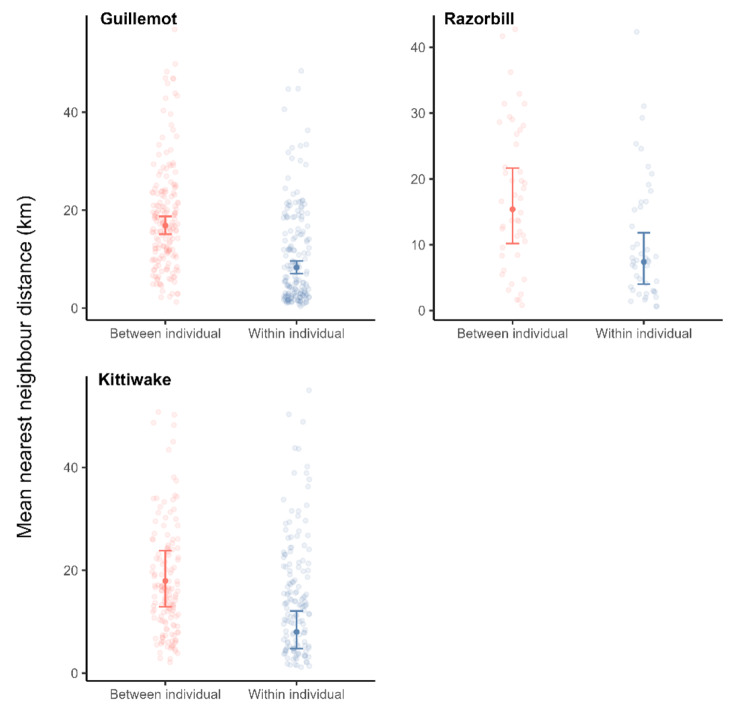
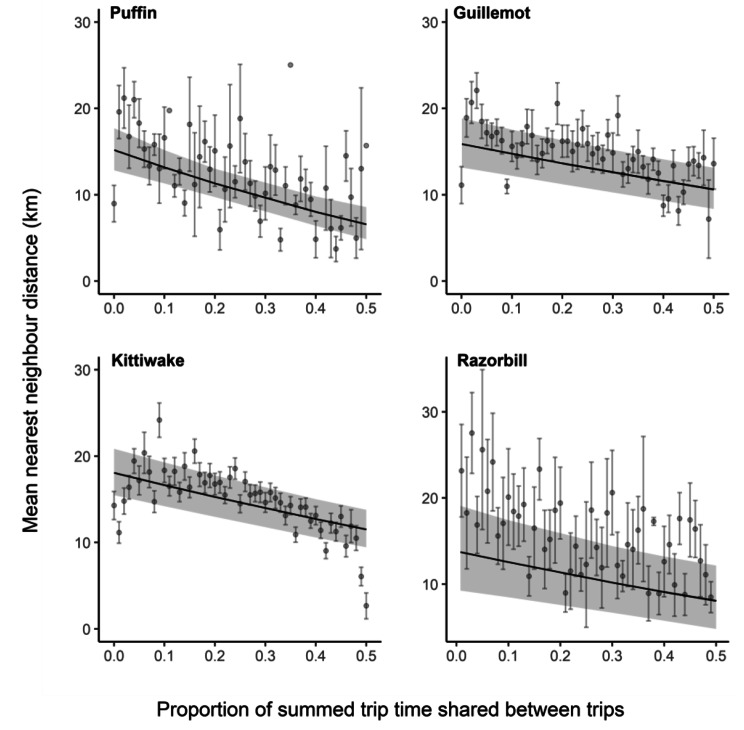
Results: All species exhibited site and route fidelity both within- and between-years, and fidelity between trips in guillemots and razorbills was related to metrics of foraging effort, suggesting they adjust fidelity to their personal foraging experience. We also found evidence that individuals used local environmental cues of prey location or availability and/or information gained by observing conspecifics when choosing foraging routes, particularly in puffins, where trips of individuals that overlapped temporally at the colony or out at sea were more similar.
Conclusions: The fidelity shown by these seabird species has the potential to put them at greater risk in the face of environmental change by driving individuals to continue using areas being degraded by anthropogenic pressures. However, our results suggest that individuals show some flexibility in their fidelity, which may promote resilience under environmental change. The benefits of this flexibility are likely to depend on numerous factors, including the rapidity and spatial scale of environmental change and the reliability of the information individuals use to choose foraging sites or routes, thus highlighting the need to better understand how organisms combine cues, prior experience, and other sources of information to make movement decisions.
Keywords: Atlantic puffin; Black-legged kittiwake; Common guillemot; Foraging route fidelity; Foraging trip; Individual foraging site fidelity; Razorbill.
© 2024. The Author(s).
Conflict of interest statement
The authors declare no competing interests.
Figures
References
-
- Phillips R, Lewis S, González-Solís J, Daunt F. Causes and consequences of individual variability and specialization in foraging and migration strategies of seabirds. Mar Ecol Prog Ser. 2017;578:117–50. doi: 10.3354/meps12217. - DOI
Grants and funding
LinkOut - more resources
Full Text Sources
