

Temporal trends and disparities of population attributable fractions of modifiable risk factors for dementia in China: a time-series study of the China health and retirement longitudinal study (2011-2018)
- PMID: 38872868
- PMCID: PMC11170192
- DOI: 10.1016/j.lanwpc.2024.101106
Temporal trends and disparities of population attributable fractions of modifiable risk factors for dementia in China: a time-series study of the China health and retirement longitudinal study (2011-2018)
Abstract
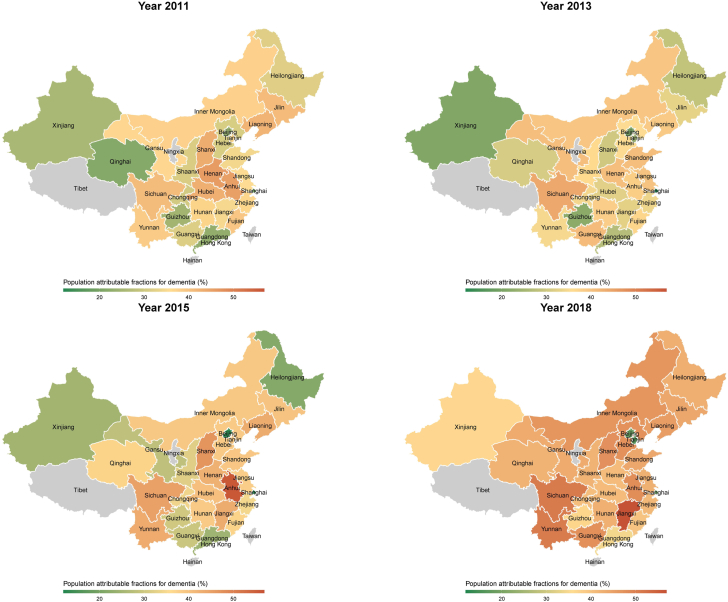
Background: In China, dementia poses a significant public health challenge, exacerbated by an ageing population and lifestyle changes. This study assesses the temporal trends and disparities in the population-attributable fractions (PAFs) of modifiable risk factors (MRFs) for new-onset dementia from 2011 to 2018.
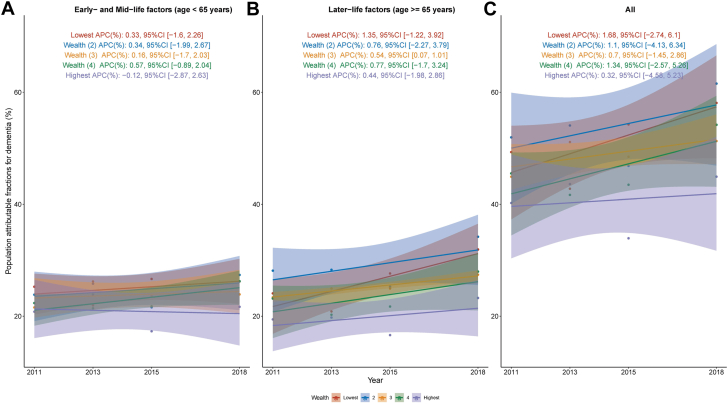
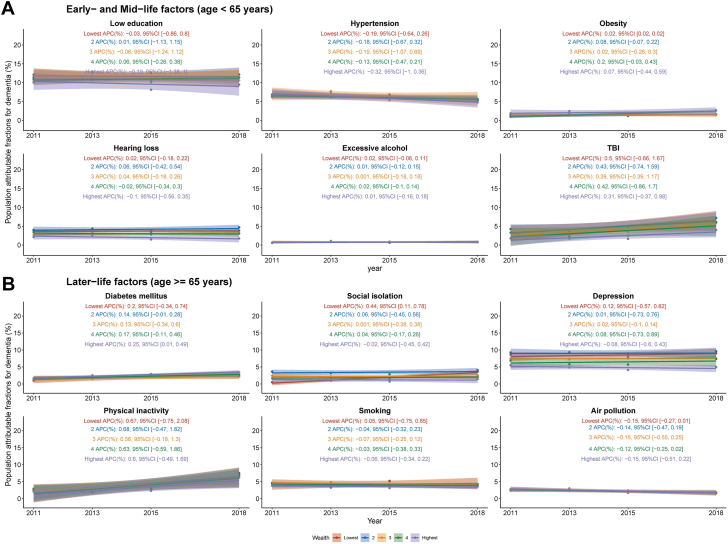
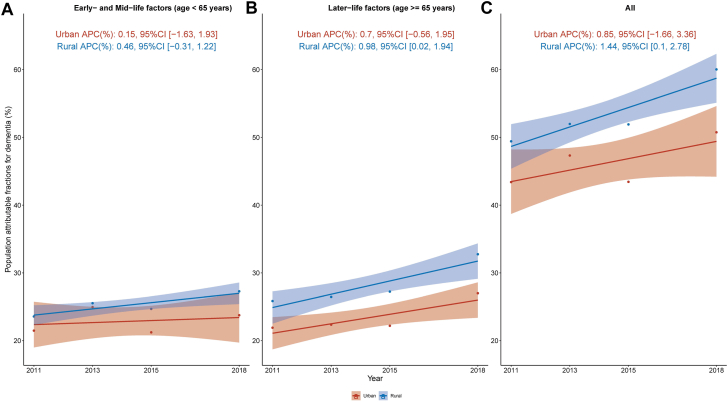
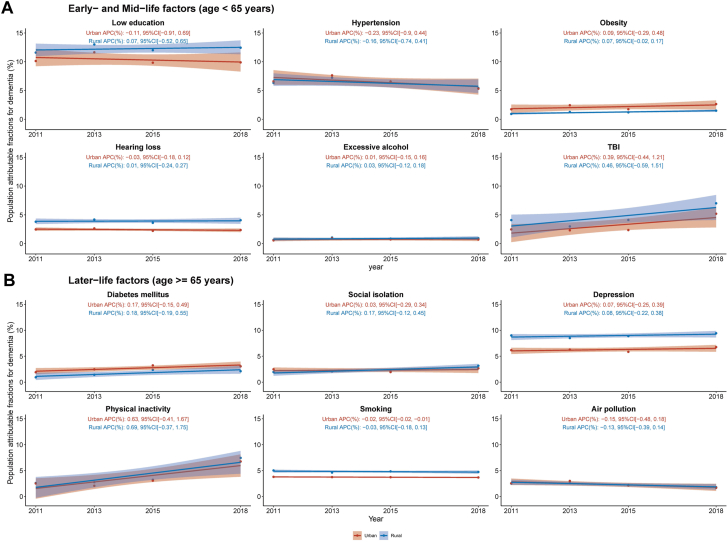
Methods: We used data from the China Health and Retirement Longitudinal Study (CHARLS), covering 75,214 person-waves. We calculated PAFs for 12 MRFs identified by the Lancet Commission (including six early-to mid-life factors and six late-life factors). We also determined the individual weighted PAFs (IW-PAFs) for each risk factor. Subgroup analyses were conducted by sex, socio-economic status (SES), and geographic location.
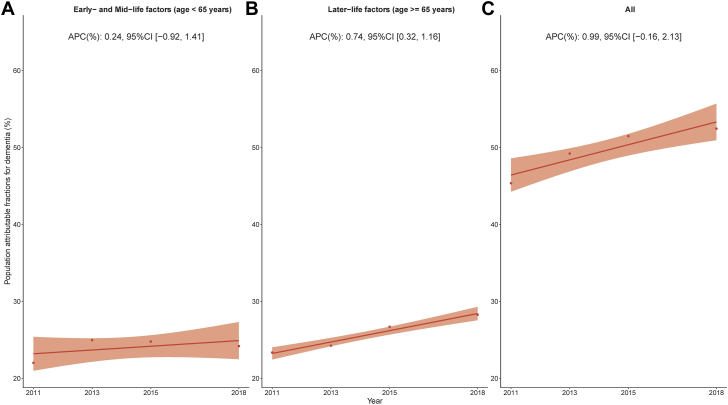
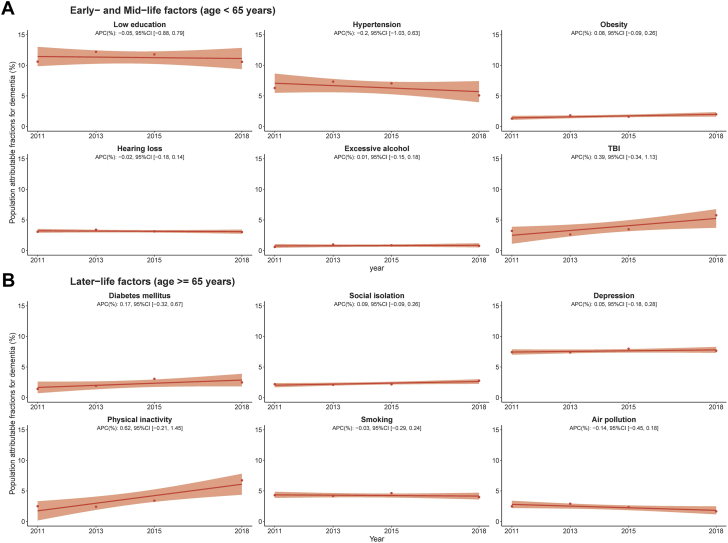
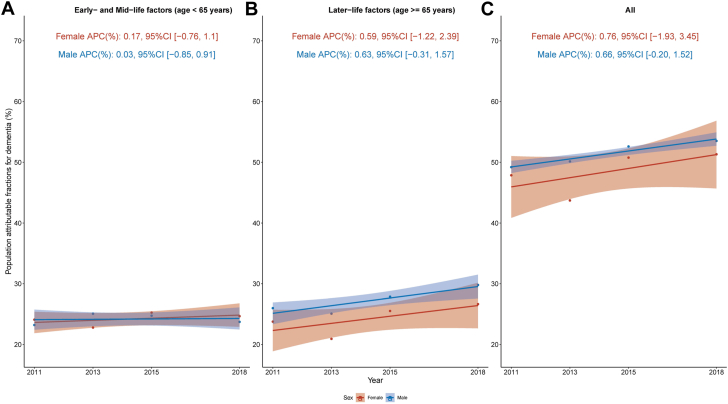
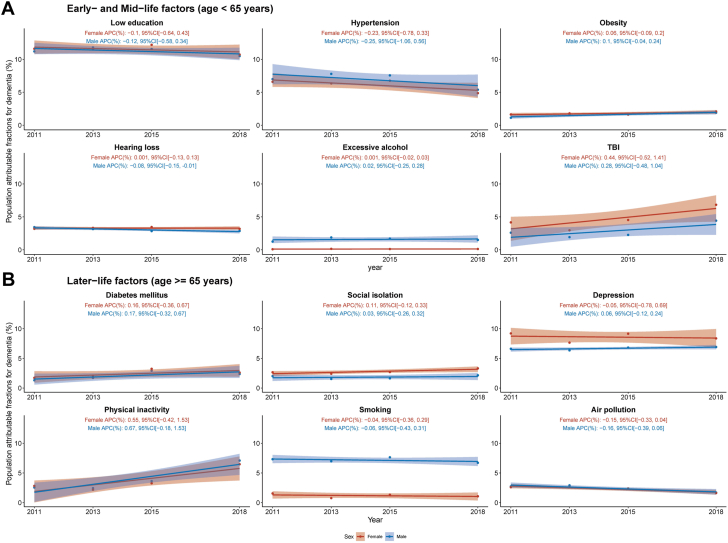
Findings: The overall PAF for dementia MRFs had a slight increase from 45.36% in 2011 to 52.46% in 2018, yet this change wasn't statistically significant. During 2011-2018, the most contributing modifiable risk was low education (average IW-PAF 11.3%), followed by depression, hypertension, smoking, and physical inactivity. Over the eight-year period, IW-PAFs for risk factors like low education, hypertension, hearing loss, smoking, and air pollution showed decreasing trends, while others increased, but none of these changes were statistically significant. Sex-specific analysis revealed higher IW-PAFs for traumatic brain injury (TBI), social isolation, and depression in women, and for alcohol and smoking in men. The decline in IW-PAF for men's hearing loss were significant. Lower-income individuals had higher overall MRF PAFs, largely due to later-life factors like depression. Early-life factors, such as TBI and low education, also contributed to SES disparities. Rural areas reported higher overall MRF PAFs, driven by factors like depression, low education, and hearing loss. The study also found that the gap in MRF PAFs across different SES groups or regions either remained constant or increased over the study period.
Interpretation: The study reveals a slight but non-significant increase in dementia's MRF PAF in China, underscoring the persistent relevance of these risk factors. The findings highlight the need for targeted public health strategies, considering the demographic and regional differences, to effectively tackle and reduce dementia risk in China's diverse population.
Funding: This work was supported by the PKU Young Scholarship in Global Health and Development.
Keywords: China; Dementia; Disparity; Population attributable fractions; Temporal trend.
© 2024 The Authors. Published by Elsevier Ltd.
Conflict of interest statement
SC and all other others declare no conflict of interest with this work.
Figures
Similar articles
-
Temporal trends in population attributable fractions of modifiable risk factors for dementia: a time-series study of the English Longitudinal Study of Ageing (2004-2019).BMC Med. 2024 Jun 26;22(1):268. doi: 10.1186/s12916-024-03464-2. BMC Med. 2024. PMID: 38926751 Free PMC article.
-
Preventing dementia in Italy: Estimations of modifiable risk factors and public health implications.J Prev Alzheimers Dis. 2025 Jan 13;12(3):100055. doi: 10.1016/j.tjpad.2024.100055. Online ahead of print. J Prev Alzheimers Dis. 2025. PMID: 39809612 Free PMC article.
-
Population Attributable Fraction of Modifiable Risk Factors for Dementia in Turkey.Dementia (London). 2025 Jun 29:14713012251357162. doi: 10.1177/14713012251357162. Online ahead of print. Dementia (London). 2025. PMID: 40583126
-
Community wide interventions for increasing physical activity.Cochrane Database Syst Rev. 2015 Jan 5;1(1):CD008366. doi: 10.1002/14651858.CD008366.pub3. Cochrane Database Syst Rev. 2015. PMID: 25556970 Free PMC article.
-
Individual-level interventions to reduce personal exposure to outdoor air pollution and their effects on people with long-term respiratory conditions.Cochrane Database Syst Rev. 2021 Aug 9;8(8):CD013441. doi: 10.1002/14651858.CD013441.pub2. Cochrane Database Syst Rev. 2021. PMID: 34368949 Free PMC article.
Cited by
-
Association of chronic kidney disease with cognitive impairment risk in middle-aged and older adults: the first longitudinal evidence from CHARLS.Sci Rep. 2024 Oct 7;14(1):23265. doi: 10.1038/s41598-024-74420-6. Sci Rep. 2024. PMID: 39370425 Free PMC article.
-
Closing the gap in dementia research by community-based cohort studies in the Chinese population.Lancet Reg Health West Pac. 2025 Jan 21;55:101465. doi: 10.1016/j.lanwpc.2025.101465. eCollection 2025 Feb. Lancet Reg Health West Pac. 2025. PMID: 39902152 Free PMC article. Review.
-
Population attributable fractions for modifiable risk factors of dementia in China: an updated analysis.Lancet Reg Health West Pac. 2024 Nov 21;52:101247. doi: 10.1016/j.lanwpc.2024.101247. eCollection 2024 Nov. Lancet Reg Health West Pac. 2024. PMID: 39640538 Free PMC article. No abstract available.
-
Development and validation of a dynamic nomogram for predicting cognitive impairment risk in older adults with dentures: analysis from CHARLS and CLHLS data.BMC Geriatr. 2025 Feb 25;25(1):127. doi: 10.1186/s12877-025-05758-3. BMC Geriatr. 2025. PMID: 40000983 Free PMC article.
-
Association between baseline cardio-kidney-metabolic syndrome, its transition and cognitive impairment: result from CHARLS study.Diabetol Metab Syndr. 2025 Jun 13;17(1):211. doi: 10.1186/s13098-025-01779-5. Diabetol Metab Syndr. 2025. PMID: 40514737 Free PMC article.
References
-
- Li F., Qin W., Zhu M., Jia J. Model-based projection of dementia prevalence in China and worldwide: 2020-2050. J Alzheimers Dis. 2021;82(4):1823–1831. - PubMed
-
- Jia L., Du Y., Chu L., et al. Prevalence, risk factors, and management of dementia and mild cognitive impairment in adults aged 60 years or older in China: a cross-sectional study. Lancet Public Health. 2020;5(12):e661–e671. - PubMed
Grants and funding
LinkOut - more resources
Full Text Sources
Miscellaneous
