. 2024 May 29:38:101744.
doi: 10.1016/j.bbrep.2024.101744. eCollection 2024 Jul.

Blockage of TMEM189 induces G2/M arrest and inhibits the growth of breast tumors

Affiliations

Blockage of TMEM189 induces G2/M arrest and inhibits the growth of breast tumors

Song Chen et al. Biochem Biophys Rep. .

Abstract

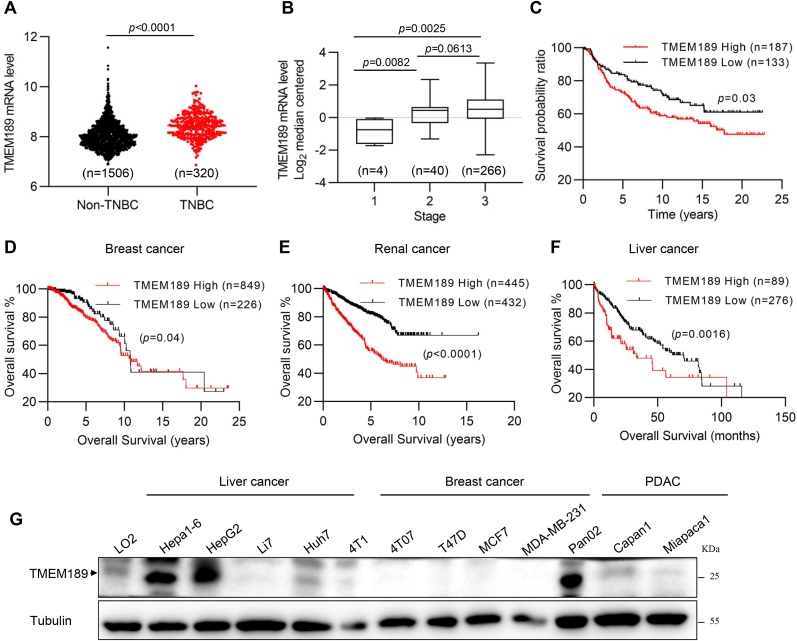
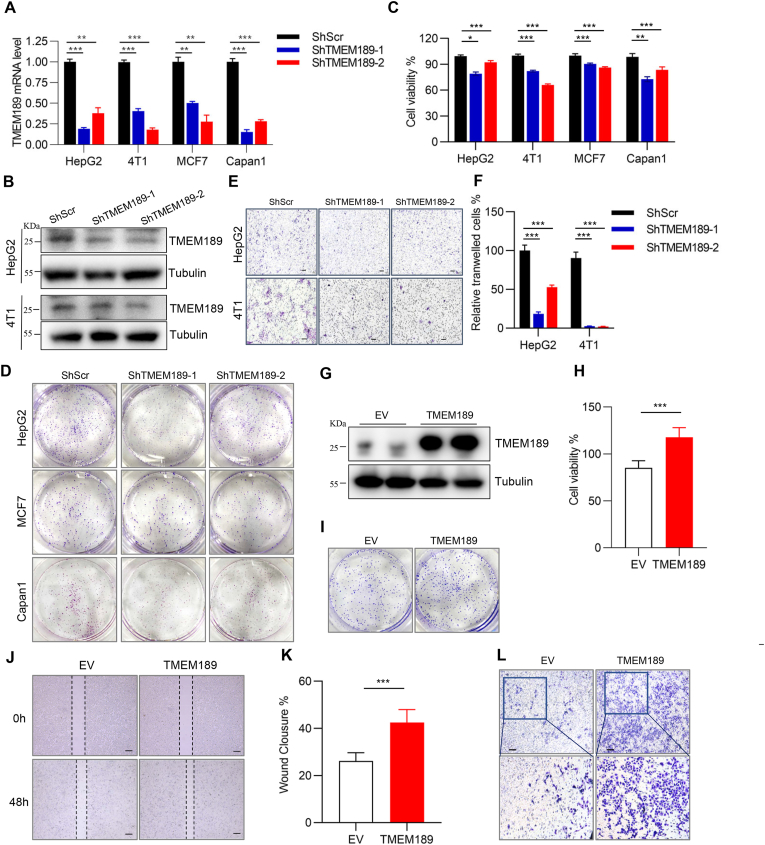
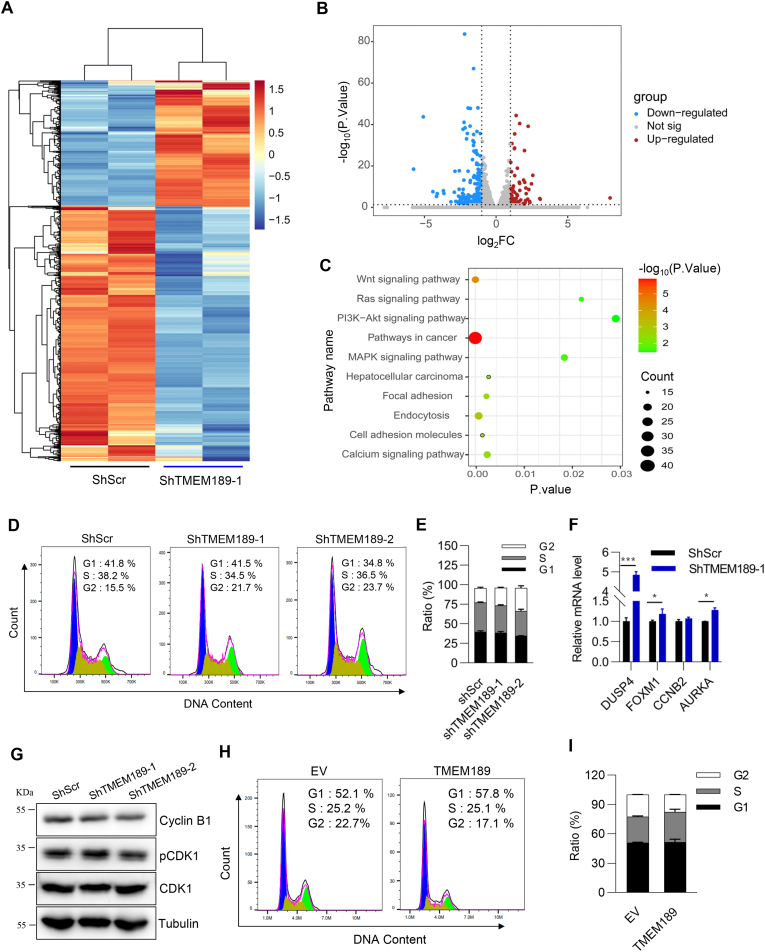
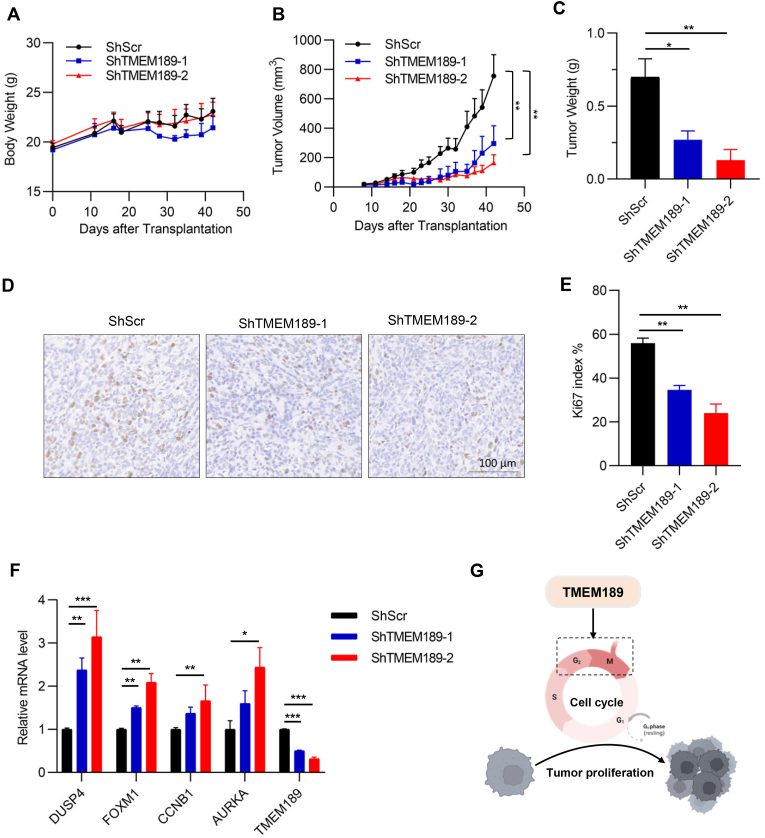
Cancer is the major cause of premature death in humans worldwide, demanding more efficient therapeutics. Aberrant cell proliferation resulting from the loss of cell cycle regulation is the major hallmark of cancer, so targeting cell cycle is a promising strategy to combat cancer. However, the molecular mechanism underlying the dysregulation of cell cycle of cancer cells remains poorly understood. TMEM189, a newly identified protein, plays roles in the biosynthesis of ethanolamine plasmalogen and the regulation of autophagy. Here, we demonstrated that the expression level of TMEM189 was negatively correlated with the survival rate of the cancer patients. TMEM189 deficiency significantly suppresses the cancer cell proliferation and migration, and causes cell cycle G2/M arrest both in vitro and in vivo. Furthermore, TMEM189 depletion suppressed the growth of breast tumors in vivo. Taken together, our work indicated that TMEM189 promotes cancer progression by regulating cell cycle G2/M transition, suggesting that it is a promising target in cancer therapy.


Conflict of interest statement

The authors declare that they have no known competing financial interests or personal relationships that could have appeared to influence the work reported in this paper.

Figures

Fig. 1
Fig. 1
TMEM189 expression level is associated with cancer malignancy (A) TMEM189 mRNA levels of TNBC and non-TNBC patients's tumor tissues from the Metabric datasets. (B) TMEM189 mRNA levels in three tumor stages of TNBC samples from the Metabric dataset. (C) The overall survival probability analysis for 320 TNBC patients from the Metabric dataset by TMEM189 mRNA level. (D–F) Overall survival analysis of The Human Protein Atlas cohorts of patients with breast, renal, and liver cancer. (G) Western blotting analysis for TMEM189 expression in various breast, liver, and pancreatic cancer cell lines. *p < 0.05, **p < 0.01 and ***p < 0.001.
Fig. 2
Fig. 2
TMEM189 promotes cancer cell growth and migration (A) HepG2, MCF7, and Capan1 cells stably expressing either scramble or human TMEM189 shRNA, and 4T1 cells stably expressing either scramble or mouse TMEM189 shRNA were subjected to quantitative real-time PCR to detect knockdown efficiency (n = 3 per group). (B) HepG2 cells stably expressing either scramble or human TMEM189 shRNA, and 4T1 cells stably expressing either scramble or mouse TMEM189 shRNA were subjected to Western blotting. (C) The cells as indicated were subjected to cell viability assay as described in Method (n = 3 per group). (D) The cells as indicated were subjected to cell colony formation assay as described in Method. The whole well of 6- well plate was presented. (E) Representative images of Transwell assay (Magnification, 10×. Scale bar, 100 μm). (F) Quantitation of (E) (n = 5 per group). (G) HepG2 cells stably expressing either empty vector (EV) or human TMEM189 were subjected to Western blotting. (H) Cell viability assay was performed for HepG2 cells stably expressing either empty vector (EV) or human TMEM189. (I) Colony formation assay was performed for HepG2 cells stably expressing either empty vector (EV) or human TMEM189. The whole well of 6- well plate was presented. (J–K) The migration ability of HepG2 cells stably expressing either empty vector (EV) or human TMEM189 was assessed by wound-healing assay. Photographs were taken at 0 and 48 h following the initial scratch. Migration rates were quantified by measuring three different wound areas (n = 3) (Magnification, 10×. Scale bar, 100 μm). Three separate experiments were performed. (***p < 0.001). (L) Transwell assay was performed for HepG2 cells stably expressing either empty vector (EV) or human TMEM189. (Magnification, 10×. Scale bar, 100 μm).Data were shown as the means ± SEM. *p < 0.05, **p < 0.01 and ***p < 0.001.
Fig. 3
Fig. 3
TMEM189 deficiency inhibits cancer cell proliferation by inducing G2/M arrest (A-C) HepG2 cells stably expressing either scramble or TMEM189 shRNA were subjected to transcriptomic analysis. (A) Heatmap and (B) Volcano map presented a total of 1052 genes differentially expressed, including 345 upregulated and 707 downregulated genes. (C) KEGG pathway analysis of differentially expressed genes. Advanced bubble chart shows enrichment of differentially expressed genes in signaling pathways. (D–E) Flow cytometry analysis and quantification were performed to check cell cycle phases of HepG2 cells stably expressing either scramble or TMEM189 shRNA (n = 3). (F) The mRNA levels of G2/M arrest-related markers were detected by quantitative real-time PCR in HepG2 cells stably expressing either scramble or TMEM189 shRNA. (G) The protein levels of G2/M arrest-related markers were detected by Western blot in HepG2 cells stably expressing either scramble or TMEM189 shRNA. (H–I) Flow cytometry analysis and quantification were performed to check cell cycle phases of HepG2 cells stably expressing either empty vector (EV) or TMEM189 (n = 3). Data were shown as the means ± SEM. *p < 0.05, **p < 0.01 and ***p < 0.001.
Fig. 4
Fig. 4
Deletion of TMEM189 inhibits the growth of breast cancer in vivo (A-F) 4T1 cells stably expressing either scramble or mouse TMEM189 shRNA were subcutaneously injected on both sides of the dorsum of the BALB/c mice in a total volume of 100 μL (2 × 104 cells/mouse). (A) The growth rate of xenografted mice. (B) Tumor volumes (tumor volume = width2 × length × 1/2). (C) Tumors were isolated and weighed at the endpoint of experiments. (D) Representative images of tumor sections stained with Ki67 antibody. (E) The percentage of Ki67 positive cells. (F) The mRNA levels of G2/M arrest markers were detected by RT-PCR for tumor samples (n = 8). (G) Schematic model of the role of TMEM189 in tumor proliferation. Data were shown as the means ± SEM. *p < 0.05, **p < 0.01 and ***p < 0.001.

Similar articles

References

    1. Pavlova N.N., Thompson C.B. The emerging hallmarks of cancer metabolism. Cell Metabol. 2016;23:27–47. - PMC - PubMed
    1. Yin L., Duan J.J., Bian X.W., Yu S.C. Triple-negative breast cancer molecular subtyping and treatment progress. Breast Cancer Res. 2020;22 - PMC - PubMed
    1. Hanahan D. Hallmarks of cancer: new dimensions. Cancer Discov. 2022;12:31–46. - PubMed
    1. Yan D., He Q., Pei L., Yang M., Huang L., Kong J., He W., Liu H., Xu S., Qin H., Lin T., Huang J. The APC/C E3 ligase subunit ANAPC11 mediates FOXO3 protein degradation to promote cell proliferation and lymph node metastasis in urothelial bladder cancer. Cell Death Dis. 2023;14:516. - PMC - PubMed
    1. Kulkarni S., Li Q., Singhi A.D., Liu S., Monga S.P., Feranchak A.P. TMEM16A partners with mTOR to influence pathways of cell survival, proliferation, and migration in cholangiocarcinoma. Am. J. Physiol. Gastrointest. Liver Physiol. 2023;325:G122–g134. - PMC - PubMed