

Evaluation of healthcare efficiency in China: a three-stage data envelopment analysis of directional slacks-based measure
- PMID: 38873304
- PMCID: PMC11169848
- DOI: 10.3389/fpubh.2024.1393143
Evaluation of healthcare efficiency in China: a three-stage data envelopment analysis of directional slacks-based measure
Abstract
Background: A consensus on the changing pattern of healthcare efficiency in China is current absent. This study tried to identify temporal fluctuations in healthcare efficiency from 2012 to 2021, and conducted a comparative analysis on the performance of 31 regions in China using region-level balanced panel data.
Methods: Employing three-stage data envelopment analysis (DEA) as the analytical framework, we measured healthcare efficiency and its changes using the directional slacks-based measure and global Malmquist-luenberger (GML) indexes. We also decomposed the sources of healthcare inefficiency and extended our analysis to changes in healthcare efficiency across different primary medical service levels and regional economic development tiers.
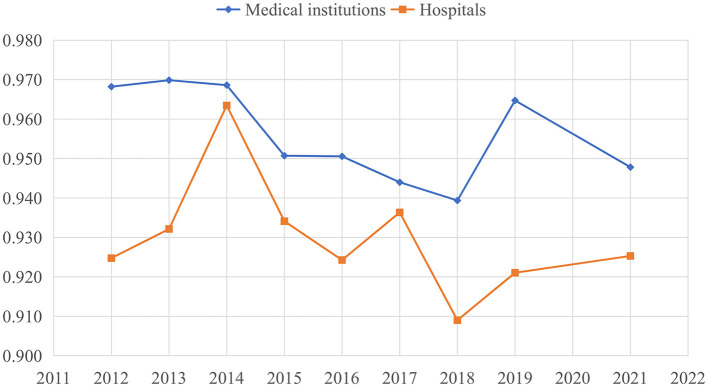
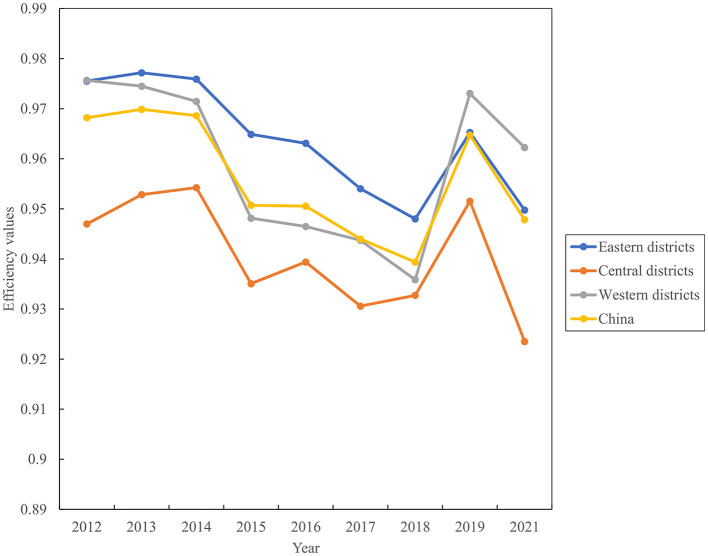
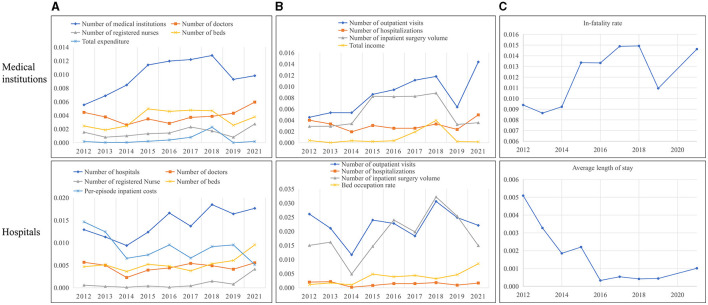
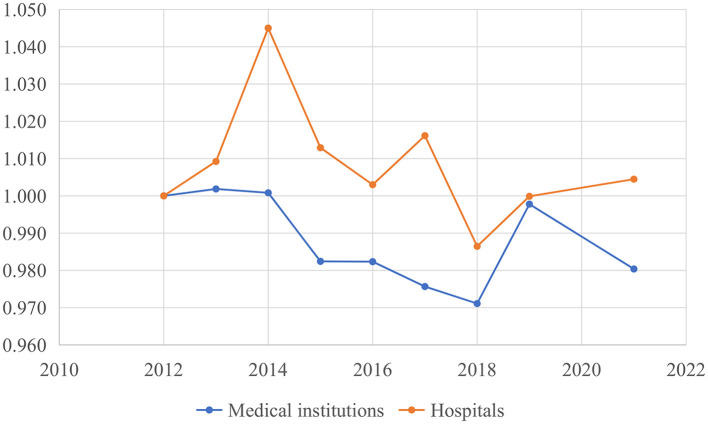
Results: The average efficiency score of medical institutions (0.956) was slightly higher than that of hospitals (0.930). We found that the average GML indexes of medical institutions in China stood at 0.990, while the average technical change (TC) index was 0.995 and the average efficiency change (EC) index was 0.998 from 2012 to 2021. The GML indexes, TC indexes, and EC indexes of hospitals were 1.002, 1.009, and 0.994, respectively. The healthcare inefficiency for both inputs and desirable outputs in medical institutions was primarily attributed to the redundant numbers of institutions, outpatient visits slacks and inpatient surgery volume slacks, accounting for 50.040, 49.644, and 28.877%, respectively. The undesirable output inefficiency values of medical institutions concerning in-hospital mortality stood at 0.012, while the figure for hospital regarding the average length of stay (LOS) was 0.002. Additionally, healthcare efficiency in both medical institutions and hospitals exhibited an upward trend from 2012 to 2021, corresponding to an increase in the volume of primary medical services, primary medical staff, and the total gross domestic product (GDP).
Conclusion: Total factor productivity (TFP) of medical services declined in China from 2012 to 2021. The excessive number of medical institutions and the slack of medical service volumes were the main sources of healthcare inefficiency. Regions prioritizing primary medical services and boasting higher GDP levels exhibited superior healthcare efficiency. These findings are expected to inform policymakers' efforts in building a value-based and efficient health service system in China.
Keywords: China; directional distance function (DDF); healthcare efficiency; input-output slacks; slacks-based measure (SBM); three-stage data envelopment analysis (DEA).
Copyright © 2024 Fang and Li.
Conflict of interest statement
The authors declare that the research was conducted in the absence of any commercial or financial relationships that could be construed as a potential conflict of interest.
Figures
Similar articles
-
Measuring productivity of healthcare services under environmental constraints: evidence from China.BMC Health Serv Res. 2020 Jul 22;20(1):673. doi: 10.1186/s12913-020-05496-9. BMC Health Serv Res. 2020. PMID: 32698810 Free PMC article.
-
The Regional Total Factor Productivity Changes of Healthcare Delivery in China: A Bootstrap Malmquist Data Envelopment Analysis.Inquiry. 2024 Jan-Dec;61:469580241266373. doi: 10.1177/00469580241266373. Inquiry. 2024. PMID: 39066676 Free PMC article.
-
Evaluation of performance and impacts of maternal and child health hospital services using Data Envelopment Analysis in Guangxi Zhuang Autonomous Region, China: a comparison study among poverty and non-poverty county level hospitals.Int J Equity Health. 2016 Aug 23;15(1):131. doi: 10.1186/s12939-016-0420-y. Int J Equity Health. 2016. PMID: 27552805 Free PMC article.
-
Approach in inputs & outputs selection of Data Envelopment Analysis (DEA) efficiency measurement in hospitals: A systematic review.PLoS One. 2024 Aug 14;19(8):e0293694. doi: 10.1371/journal.pone.0293694. eCollection 2024. PLoS One. 2024. PMID: 39141630 Free PMC article.
-
A systematic review on hospital inefficiency in the Eastern Mediterranean Region: sources and solutions.BMC Health Serv Res. 2019 Nov 12;19(1):830. doi: 10.1186/s12913-019-4701-1. BMC Health Serv Res. 2019. PMID: 31718648 Free PMC article.
Cited by
-
Study on the efficiency of health resource allocation in the western region of China-based on three-stage DEA and Tobit regression analysis.BMC Health Serv Res. 2025 Apr 1;25(1):480. doi: 10.1186/s12913-025-12630-y. BMC Health Serv Res. 2025. PMID: 40165157 Free PMC article.
-
Efficiency analysis of primary health care resources: DEA and Tobit regression evidence from village clinics in Jiangsu Province.Front Public Health. 2025 Apr 23;13:1515532. doi: 10.3389/fpubh.2025.1515532. eCollection 2025. Front Public Health. 2025. PMID: 40337730 Free PMC article.
-
Resource allocation efficiency in 68 county-level traditional Chinese medicine hospitals in China: a data envelopment analysis.BMJ Open. 2024 Oct 29;14(10):e088462. doi: 10.1136/bmjopen-2024-088462. BMJ Open. 2024. PMID: 39477274 Free PMC article.
-
Health resource allocation within the close-knit medical consortium after the Luohu healthcare reform in China: efficiency, productivity, and influencing factors.Front Public Health. 2024 Aug 29;12:1395633. doi: 10.3389/fpubh.2024.1395633. eCollection 2024. Front Public Health. 2024. PMID: 39267642 Free PMC article.
References
-
- National Health Commission of the People's Republic of China . China Health Statistical Yearbook. (2011). Available online at: http://www.nhc.gov.cn/mohwsbwstjxxzx/tjtjnj/tjsj_list.shtml (accessed November 17, 2022).
-
- Yu B, Wang T, He C, Zheng, Guo S. Research on the efficiency of China health service system based on three-stage DEA. Manag Rev. (2023) 34:312. 10.14120/j.cnki.cn11-5057/f.20210616.007 - DOI
-
- Wang Q, Wei J. Competition, insurance and efficiency of hospital market: based on the two stage analysis of DEA model. Econ Probl. (2013) 4:17–21. 10.16011/j.cnki.jjwt.2013.04.001 - DOI
MeSH terms
LinkOut - more resources
Full Text Sources