Review
. 2024 May;85(3):531-548.
doi: 10.3348/jksr.2024.0021. Epub 2024 May 23.

[Pediatric Hip Disorders]

[Article in Korean]
Review

[Pediatric Hip Disorders]

[Article in Korean]
Seunghyun Lee et al. J Korean Soc Radiol. 2024 May.

Abstract

Developmental dysplasia of the hip is a condition characterized by hip joint instability due to acetabular dysplasia in infancy, necessitating precise ultrasound examination. Legg-Calvé-Perthes disease is caused by a temporary disruption in blood flow to the femoral head during childhood, progressing through avascular, fragmentation, re-ossification, and residual stages. Slipped capital femoral epiphysis is a condition where the femoral head shifts medially along the epiphyseal line during adolescence due to stress, such as weight-bearing. Differentiating between transient hip synovitis and septic arthritis may require joint fluid aspiration. Osteomyelitis can be associated with soft tissue edema and osteolysis. When multiple lesions are present, it is essential to distinguish between Langerhans cell histiocytosis and metastatic neuroblastoma. This review will introduce imaging techniques and typical findings for these conditions.

발달성 고관절 이형성증은 영아기 비구 형성이상으로 인해 고관절 불안정성이 발생하는 질환으로 정확한 초음파 검사가 이루어져야 한다. 특발성 대퇴골두 무혈성 괴사는 아동기 대퇴골두의 일시적인 혈류 장애로 인해 발생하며 무혈성, 분절화, 재골화, 잔여기 단계를 거치게 된다. 대퇴골두 골단분리증은 청소년기에 체중 부하와 같은 스트레스로 인해 대퇴골두가 골단선을 따라 내측으로 전위되는 질환이다. 일과성 고관절 활액막염과 화농성 관절염은 감별을 위해 관절액 흡인술이 필요할 수 있다. 골수염은 연부 조직 부종과 골 용해를 동반할 수 있다. 하지만, 다발성 병변의 경우 랑게르한스 세포 조직구증, 전이성 신경모세포종 등을 감별해야 한다. 본 종설에서는 이런 질환에 대한 영상 검사 방법 및 대표적인 소견을 소개하고자 한다.


Conflict of interest statement

Conflicts of Interest: The authors have no potential conflicts of interest to disclose.

Figures

Fig. 1
Fig. 1. Plain radiograph illustrating left developmental dysplasia of the hip. Anteroposterior radiography of a 2-month-old girl with left developmental dysplasia of the hip reveals an abnormally elevated left acetabular index (star), defined as the angle between the Hilgenreiner line (H line) and a line connecting the inferomedial and superolateral rims of the acetabular roof. The Perkin line (P line), drawn perpendicular to the Hilgenreiner line (H line), intersects the lateral rim of the acetabulum. The Shenton arc, depicted by dotted white lines, is formed by the medial cortex of the femoral neck and the inferior cortex of the superior pubic ramus. While the normal right hip displays the femoral head within the inferomedial quadrant and a continuous Shenton arc, the abnormal left hip shows the dislocated femoral head in the superolateral quadrant with a disrupted Shenton arc.
Fig. 2
Fig. 2. Hip ultrasonography with coronal and transverse views.
A. The coronal view of the hip joint in the standard plane displays a low-echoic FH within the bony acetabulum. Measurements of alpha/beta angles and the FH coverage index are conducted at the plane where the triradiate cartilage (arrowhead), an echogenic tip of the labrum (arrow), and the horizontal extension of the iliac bony cortex (line) coexist. This view illustrates a horizontal line along the iliac bone, which then outlines the cartilaginous FH to calculate the percent coverage of the FH (d [thin double-headed arrow]/D [thick double headed arrow] × 100%). B. Transverse ultrasonography of the hip, with the hip joint flexed at 90°, reveals a low-echoic FH positioned between the femur shaft and ischium. C. During the Barlow test, hip joint instability is induced by adducting the hip and exerting strong force on the FH toward the floor, pushing it away from the acetabulum (arrow). Hip instability is indicated when the FH moves laterally and posteriorly, losing contact with the ischium and resulting in the widening of the space between the FH and pubis (double-headed arrow). FH = femoral head
Fig. 3
Fig. 3. Normal and developmental dysplasia of the hip joint.
A-H. Radiographic findings of normal (A-D) and developmental dysplasia (E-H) of the hip are presented. (A) The acetabular index (red star) should be less than 30°. (B) Given the iliac cortexs’ slight inclination, the upper edge of the transducer must be rotated slightly towards the rear of the ilium to render the iliac cortex extension horizontal in the ultrasound plane (green line). The alpha angle, defined by the intersection of the acetabular roof (red line) and the iliac cortex extension (green line), contrasts with the beta angle, which is the angle between the iliac cortex extension (green line) and the fibrocartilaginous triangular labrum (yellow line). (C) Rotating the image 90° simulates a view from an actual hip ultrasound, where an alpha angle over 60° and a beta angle under 55° are considered normal. The superior acetabular rim appears sharply defined (arrowhead). (D) The coronal view further indicates FH coverage, where more than 50% coverage of the FH within the acetabulum is normal. (E) In contrast, the abnormal hip joints’ anteroposterior radiograph displays a steeper left acetabular roof and a more rounded left superior acetabular rim compared to (A), with the acetabular index (red star) exceeding 30°. (F, G) Coronal ultrasound of the dysplastic hip shows superior and lateral subluxation of the left FH from the shallow acetabulum, characterized by an alpha angle of less than 60° and a beta angle of more than 55°. The bony acetabulums’ lateral edge exhibits a rounded appearance (arrowhead), indicating bony acetabular dysplasia. (H) Subluxation is defined as 0%–50% coverage of the FH by the acetabulum but in contact, whereas dislocation is characterized by 0% coverage with complete loss of contact of the FH with the acetabulum. FH = femoral head
Fig. 4
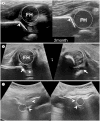
Fig. 4. Post-treatment hip ultrasonography for developmental dysplasia of the hip.
A. Follow-up ultrasonography two months post-application of the Pavlik harness demonstrates the correctly positioned FH (dotted circle) and improved acetabulum lateral edge appearance (arrowheads). B. Despite the use of the Pavlik harness, ultrasonography reveals a dislocated FH with an inverted labrum (arrows) and pulvinar fat hypertrophy (star) in both the coronal (left column) and transverse (right column) views. C. Positioning the transducer over the superior ramus of the pubis in front of the hip (line) and verifying the anatomical placement of the FH (dotted circle), ultrasonography (right column) can depict the FH located within the acetabulum (arrowheads). The ultrasound image in the left column indicates a posterior dislocation of the left FH. FH = femoral head
Fig. 5
Fig. 5. MR imaging for developmental dysplasia of the hip.
A. A medial joint space distance (dotted line) of 3 mm or less, measured between the triradiate cartilage (arrowheads) and the femoral capital epiphysis, indicates a concentric reduction state. B. Post-contrast T1-weighted imaging with fat suppression in a two-month-old boy, following the closed reduction of the left hip, reveals punctate enhancement of the posteriorly displaced left femoral head (dotted circle) and elongated thickening of the ligament teres (arrows). C. An axial T1-weighted image in a 12-month-old girl also displays a widening of the medial joint space (arrow) with a shallow acetabulum and the femoral head (dotted circle) in an eccentric reduction state. D. A contrast-enhanced axial T1-weighted image in a 15-month-old girl after closed reduction of the left hip demonstrates globally decreased enhancement of the left femoral head (arrow).
Fig. 6
Fig. 6. Initial plain radiography in Legg-Calvé-Perthes disease.
A. Initial radiograph of a 6-year-old boy with a left limping gait reveals asymmetrical size and increased density of the femoral head epiphysis (arrowheads) and medial joint space widening (double-headed arrows). B. Follow-up radiograph displays irregular sclerotic and lytic lesions (arrows) in the left femoral head. C. Additional initial radiograph of an 11-year-old boy with a right limping gait shows subtle asymmetry and increased density of the femoral head epiphysis (arrowhead). D. A frog-leg radiograph demonstrates crescentic subchondral radiolucency in the right femoral epiphysis (arrow).
Fig. 7
Fig. 7. Changes in plain radiography in Legg-Calvé-Perthes disease.
A. Initial radiograph of a 5-year-old boy with a limping gait dipicts asymmetrical size and increased density of the femoral head epiphysis (arrowhead). B, C. After one and five months of traction and the application of a Petrie cast, the radiographs show progressive fragmentation and collapse of the right femoral head, along with a radiolucent area around the physis (arrows). D. Lateral pillar support (arrow) becomes visible in the re-ossification stage after 12 months. E. Eighteen months later, bony remodeling is evident, characterized by coxa plana and magna and widening of the femur neck.
Fig. 8
Fig. 8. MR imaging in the avascular stage of Legg-Calvé-Perthes disease.
A. An initial radiograph reveals the asymmetrical size and increased density of the left femoral head epiphysis (lateral pillar B). B. A coronal T2-weighted MR image displays heterogeneous signal intensity in the left proximal femoral epiphysis and diffuse increased signal intensity in the left proximal femoral metaphysis, indicative of bone marrow edema. Additionally, the left proximal femoral growth plate presents a saw-tooth appearance without focal obliteration. C. The ADC map shows an elevated metaphyseal ADC ratio. D. Contrast-enhanced T1-weighted imaging depicts near-total avascular necrosis of the epiphysis (> 80% of the epiphyseal area) with a nodular enhancing portion in the peripheral area of the epiphysis (arrow). ADC = apparent diffusion coefficient
Fig. 9
Fig. 9. MR imaging in the avascular and fragmentation stage of Legg-Calvé-Perthes disease.
A. An initial anteroposterior radiograph reveals the asymmetrical size and increased density of the right femoral head epiphysis (lateral pillar B), with a metaphyseal cyst (arrows) more apparent in the frog-leg radiograph. B. The coronal T2-weighted MR image (left column) displays heterogeneous signal intensity of the right femoral epiphysis and diffuse increased signal intensity in the metaphysis and metaphyseal cyst (arrow). A subtraction contrast-enhanced T1-weighted image (right column) shows near-total avascular necrosis of the epiphysis (> 80% of the epiphyseal area). C. After five months of traction, the plain radiograph demonstrates progressed fragmentation and collapse of the right femoral head. D. Coronal T2-weighted (left column) and contrast-enhanced T1-weighted subtraction images (right column) reveal partially avascular epiphysis (50%–60% of the epiphyseal area) with a nodular enhancing portion (arrow) in the peripheral area of the epiphysis.
Fig. 10
Fig. 10. Plain radiography in slipped capital femoral epiphysis disease.
A. A 12-year-old baseball player with acute-onset left hip pain and a high body mass index of 25.7 kg/m2. Anteroposterior and frog-leg radiographs reveal an abnormally widened proximal femoral physis (arrowhead) and diminished height of the epiphysis (double-headed arrow) compared to the unaffected contralateral right femoral head. The Klein line, drawn along the lateral border of the femoral neck (dotted line), fails to intersect the femoral head, unlike the unaffected right femoral head, where a small portion lies lateral to the Klein line. The frog-leg radiograph also shows a loss of concavity at the anterior femoral head-neck junction (arrows). B. Anteroposterior and frog-leg radiographs of another 12-year-old boy with several months of right hip pain following a fall display similar abnormalities in the femoral epiphysis as seen in (A): widened proximal femoral physis (arrowhead), diminished height of the epiphysis (double-headed arrows), the Klein line (dotted line) not intersecting the femoral head, and a loss of concavity at the anterior femoral head-neck junction (arrows), along with ill-defined sclerosis in the right proximal metaphysis (dotted circle).
Fig. 11
Fig. 11. Imaging findings in SCFE disease.
A. A 12-year-old baseball player with acute-onset right hip pain and a high BMI of 23.7 kg/m2. Plain radiographs reveal an abnormally widened proximal femoral physis (arrowhead) and posterior displacement of the femoral head (arrow). Coronal T2-weighted image shows asymmetric widening of the right proximal femur physis, mild metaphyseal and epiphyseal bone marrow edema, and joint effusion. B. Plain radiographs of a 12-year-old girl with left hip pain following intense exercise and a BMI of 23.3 kg/m2 show display SCFE characteristics, such as mild physeal widening (arrowhead) and posterior slipping of the epiphysis (arrow). Coronal T2-weighted image clearly shows the asymmetric widening of the left proximal femoral growth plate. C. A 14-year-old boy with right hip pain after a fall was seen in the emergency room. Plain radiography reveals subtle asymmetric physeal widening on the right side (arrowhead), ultrasound imaging indicates a subtle anterior physeal slip (arrow) and joint effusion (arrowhead), and MRI shows physeal widening and joint effusion, suggestive of SCFE. BMI = body mass index, SCFE = slipped capital femoral epiphysis
Fig. 12
Fig. 12. Bilateral slipped capital femoral epiphysis.
A. Anteroposterior and frog-leg radiographs of a 10-year-old boy with acute-onset right hip pain and a high body mass index of 28.0 kg/m2 reveal bilateral widened proximal femoral physis (arrowheads), but only the right femoral head shows posterior slipping (arrow) on the frog-leg radiography. Coronal T2-weighted image demonstrates asymmetric widening of the right proximal femoral physis along with mild metaphyseal and epiphyseal bone marrow edema. B. Seven months post-screw insertion on the right side, the patient develops left-side hip pain. Follow-up plain radiographs show further physis widening (arrowhead) on the anteroposterior view and no slipping (arrow) on frog-leg and CT examinations.
Fig. 13
Fig. 13. Ultrasound-guided effusion aspiration.
A. A longitudinal view of the hip ultrasound displays a widened anechoic joint space (star) with a convex anterior margin and synovial thickening (arrowheads) along the femoral neck. B. In cases of suspected septic arthritis, the needle (arrows) is accurately targeted to the effusion for aspiration under ultrasound guidance.
Fig. 14
Fig. 14. Osteomyelitis and conditions that can mimic it.
A. A plain radiograph of an 11-year-old boy with fever and left hip pain reveals a subtle radiolucent area at the left acetabulum (arrows). Coronal T2-weighted and contrast-enhanced T1-weighted images show bone marrow edema with microabscess formation (arrowhead) and synovial thickening and enhancement in the left hip joint, with Staphylococcus aureus confirmed by fluid analysis. B. MR images of a 4-year-old girl with fever, bilateral hip pain, and elevated C-reactive protein depict multifocal bone marrow signal abnormalities with heterogeneous enhancement (arrows). CT examination to investigate the cause of bone marrow abnormality reveals a retroperitoneal mass with internal calcification, confirmed as neuroblastoma (arrowheads). C. A plain radiograph of a 9-year-old boy with right hip pain shows a radiolucent area in the ischium (arrows). MRI reveals expansile T1 hypointense areas and enhancement involving both ilia and the right ischium (arrows), confirmed as Langerhans cell histiocytosis.

References

    1. Barrera CA, Cohen SA, Sankar WN, Ho-Fung VM, Sze RW, Nguyen JC. Imaging of developmental dysplasia of the hip: ultrasound, radiography and magnetic resonance imaging. Pediatr Radiol. 2019;49:1652–1668. - PubMed
    1. Dezateux C, Rosendahl K. Developmental dysplasia of the hip. Lancet. 2007;369:1541–1552. - PubMed
    1. Bache CE, Clegg J, Herron M. Risk factors for developmental dysplasia of the hip: ultrasonographic findings in the neonatal period. J Pediatr Orthop B. 2002;11:212–218. - PubMed
    1. Nguyen JC, Dorfman SR, Rigsby CK, Iyer RS, Alazraki AL, Anupindi SA, et al. ACR appropriateness criteria® developmental dysplasia of the hip-child. J Am Coll Radiol. 2019;16(5S):S94–S103. - PubMed
    1. Shipman SA, Helfand M, Moyer VA, Yawn BP. Screening for developmental dysplasia of the hip: a systematic literature review for the US preventive services task force. Pediatrics. 2006;117:e557–e576. - PubMed