

Oropharyngeal microbial ecosystem perturbations influence the risk for acute respiratory infections in common variable immunodeficiency
- PMID: 38873612
- PMCID: PMC11169596
- DOI: 10.3389/fimmu.2024.1371118
Oropharyngeal microbial ecosystem perturbations influence the risk for acute respiratory infections in common variable immunodeficiency
Abstract
Background: The respiratory tract microbiome is essential for human health and well-being and is determined by genetic, lifestyle, and environmental factors. Patients with Common Variable Immunodeficiency (CVID) suffer from respiratory and intestinal tract infections, leading to chronic diseases and increased mortality rates. While CVID patients' gut microbiota have been analyzed, data on the respiratory microbiome ecosystem are limited.
Objective: This study aims to analyze the bacterial composition of the oropharynx of adults with CVID and its link with clinical and immunological features and risk for respiratory acute infections.
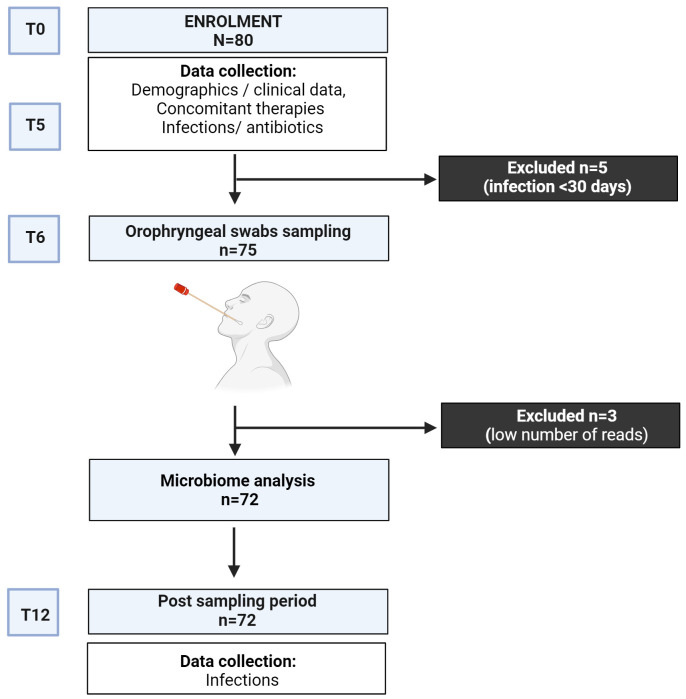
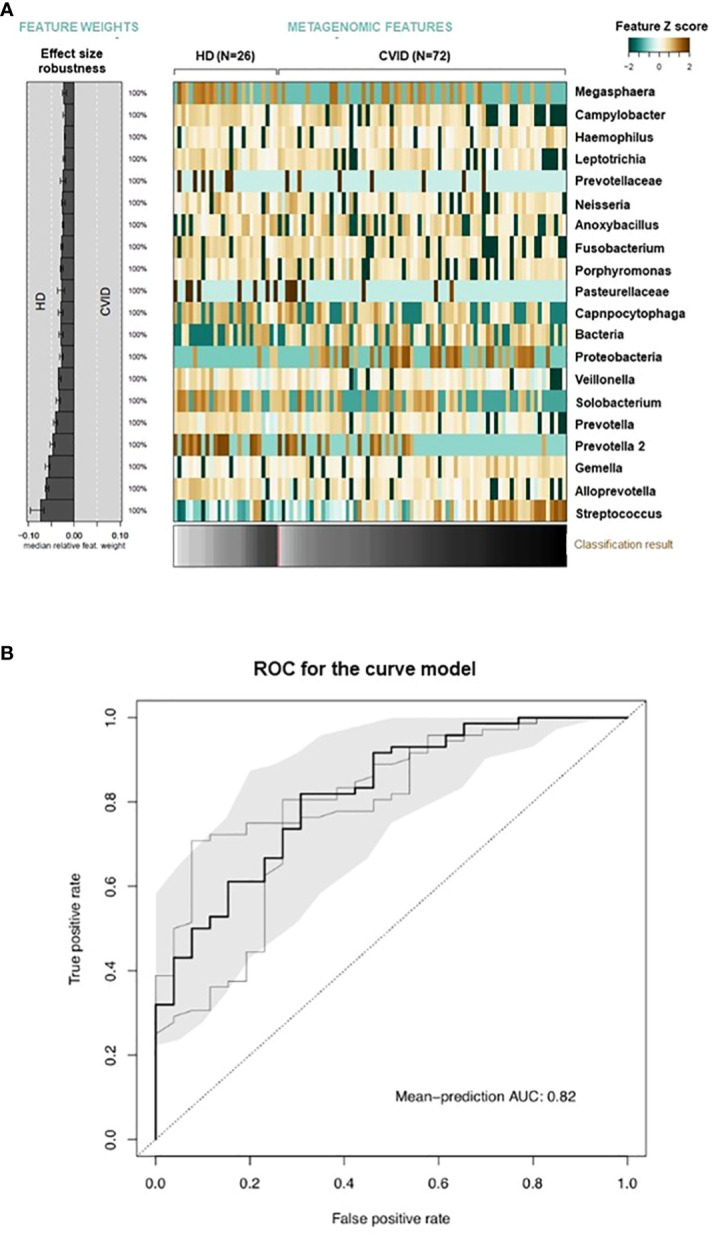
Methods: Oropharyngeal samples from 72 CVID adults and 26 controls were collected in a 12-month prospective study. The samples were analyzed by metagenomic bacterial 16S ribosomal RNA sequencing and processed using the Quantitative Insights Into Microbial Ecology (QIME) pipeline. Differentially abundant species were identified and used to build a dysbiosis index. A machine learning model trained on microbial abundance data was used to test the power of microbiome alterations to distinguish between healthy individuals and CVID patients.
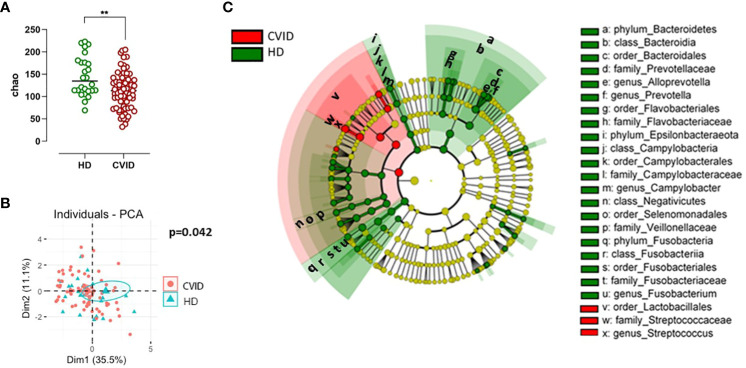
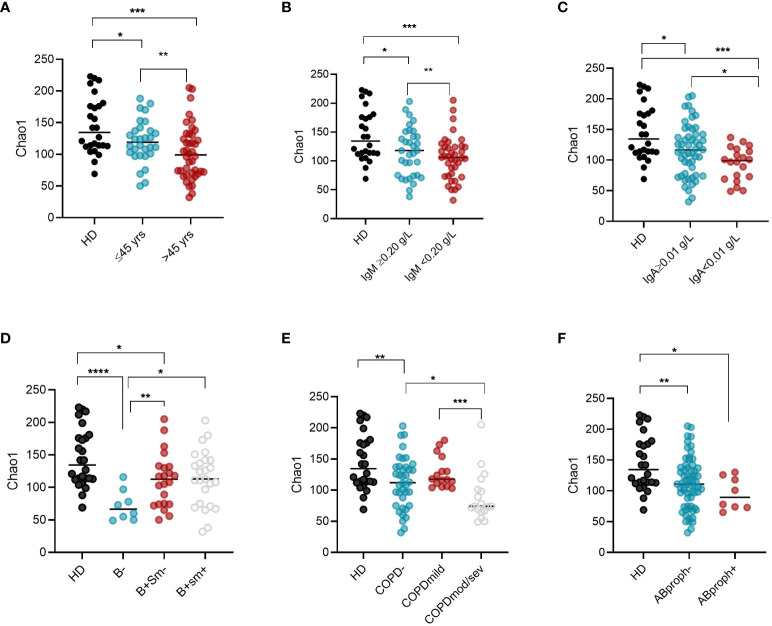
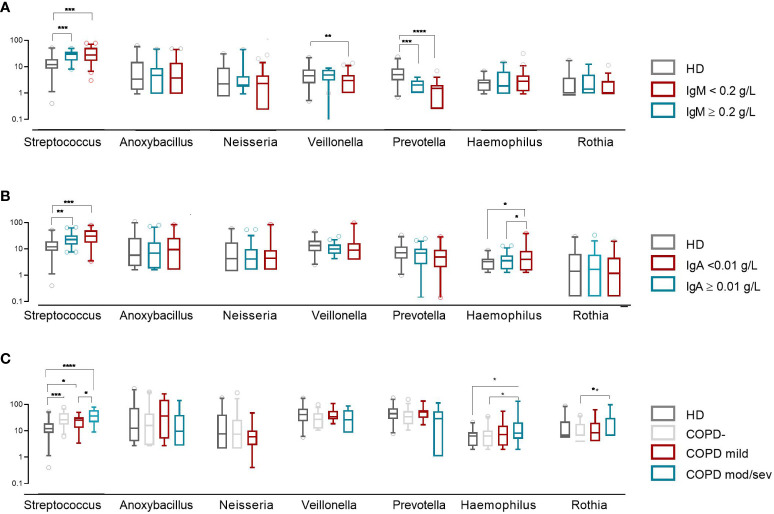
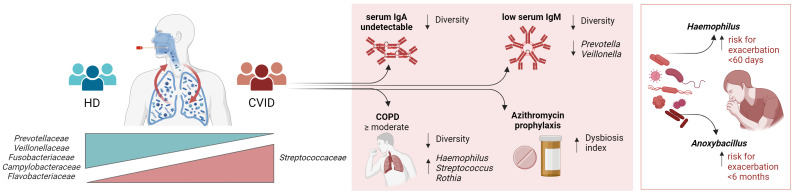
Results: Compared to controls, the oropharyngeal microbiome of CVID patients showed lower alpha- and beta-diversity, with a relatively increased abundance of the order Lactobacillales, including the family Streptococcaceae. Intra-CVID analysis identified age >45 years, COPD, lack of IgA, and low residual IgM as associated with a reduced alpha diversity. Expansion of Haemophilus and Streptococcus genera was observed in patients with undetectable IgA and COPD, independent from recent antibiotic use. Patients receiving azithromycin as antibiotic prophylaxis had a higher dysbiosis score. Expansion of Haemophilus and Anoxybacillus was associated with acute respiratory infections within six months.
Conclusions: CVID patients showed a perturbed oropharynx microbiota enriched with potentially pathogenic bacteria and decreased protective species. Low residual levels of IgA/IgM, chronic lung damage, anti antibiotic prophylaxis contributed to respiratory dysbiosis.
Keywords: Haemophilus; IgA; IgM; Pneumococcus; chronic obstructive pulmonary disease; common variable immunodeficiency; microbiome and dysbiosis; oropharyngeal microbiome.
Copyright © 2024 Pulvirenti, Giufrè, Pentimalli, Camilli, Milito, Villa, Sculco, Cerquetti, Pantosti and Quinti.
Conflict of interest statement
The authors declare that the research was conducted in the absence of any commercial or financial relationships that could be construed as a potential conflict of interest.
Figures
Similar articles
-
Bacterial but Not Fungal Gut Microbiota Alterations Are Associated With Common Variable Immunodeficiency (CVID) Phenotype.Front Immunol. 2019 Aug 13;10:1914. doi: 10.3389/fimmu.2019.01914. eCollection 2019. Front Immunol. 2019. PMID: 31456808 Free PMC article.
-
Upper Respiratory Dysbiosis with a Facultative-dominated Ecotype in Advanced Lung Disease and Dynamic Change after Lung Transplant.Ann Am Thorac Soc. 2019 Nov;16(11):1383-1391. doi: 10.1513/AnnalsATS.201904-299OC. Ann Am Thorac Soc. 2019. PMID: 31415219 Free PMC article.
-
Fecal Immunoglobulin Levels as a Modifier of the Gut Microbiome in Patients with Common Variable Immunodeficiency.J Clin Immunol. 2023 Aug;43(6):1208-1220. doi: 10.1007/s10875-023-01469-9. Epub 2023 Mar 24. J Clin Immunol. 2023. PMID: 36961604 Free PMC article.
-
Gut Microbiome and Common Variable Immunodeficiency: Few Certainties and Many Outstanding Questions.Front Immunol. 2021 Aug 2;12:712915. doi: 10.3389/fimmu.2021.712915. eCollection 2021. Front Immunol. 2021. PMID: 34408753 Free PMC article. Review.
-
Links between oropharyngeal microbiota and IgA nephropathy: A paradigm shift from isolated microbe to microbiome.Microbiol Res. 2025 Mar;292:128005. doi: 10.1016/j.micres.2024.128005. Epub 2024 Dec 8. Microbiol Res. 2025. PMID: 39675141 Review.
Cited by
-
Linking Microbiota Profiles to Disease Characterization in Common Variable Immunodeficiency: The Case of Granulomatous-Lymphocytic Interstitial Lung Disease.Biomedicines. 2024 Oct 1;12(10):2239. doi: 10.3390/biomedicines12102239. Biomedicines. 2024. PMID: 39457552 Free PMC article.
-
Exploring Monogenic, Polygenic, and Epigenetic Models of Common Variable Immunodeficiency.Hum Mutat. 2025 Apr 15;2025:1725906. doi: 10.1155/humu/1725906. eCollection 2025. Hum Mutat. 2025. PMID: 40265101 Free PMC article. Review.
-
Oropharyngeal detection of specific gut-derived Enterobacterales is associated with increased respiratory infection risk in older adults.Front Aging. 2025 May 30;6:1566034. doi: 10.3389/fragi.2025.1566034. eCollection 2025. Front Aging. 2025. PMID: 40519668 Free PMC article.
-
Oropharyngeal Staphylococcus aureus is linked to higher mortality in long-term aged care residents.Age Ageing. 2025 Mar 3;54(3):afaf042. doi: 10.1093/ageing/afaf042. Age Ageing. 2025. PMID: 40037564 Free PMC article.
References
MeSH terms
Substances
LinkOut - more resources
Full Text Sources
Miscellaneous