. 2024 May 30:15:1388496.
doi: 10.3389/fimmu.2024.1388496. eCollection 2024.

LTβR-RelB signaling in intestinal epithelial cells protects from chemotherapy-induced mucosal damage

Affiliations

LTβR-RelB signaling in intestinal epithelial cells protects from chemotherapy-induced mucosal damage

Qiangxing Chen et al. Front Immunol. .

Abstract

The intricate immune mechanisms governing mucosal healing following intestinal damage induced by cytotoxic drugs remain poorly understood. The goal of this study was to investigate the role of lymphotoxin beta receptor (LTβR) signaling in chemotherapy-induced intestinal damage. LTβR deficient mice exhibited heightened body weight loss, exacerbated intestinal pathology, increased proinflammatory cytokine expression, reduced IL-22 expression, and proliferation of intestinal epithelial cells following methotrexate (MTX) treatment. Furthermore, LTβR-/-IL-22-/- mice succumbed to MTX treatment, suggesting that LTβR- and IL-22- dependent pathways jointly promote mucosal repair. Although both LTβR ligands LIGHT and LTβ were upregulated in the intestine early after MTX treatment, LIGHT-/- mice, but not LTβ-/- mice, displayed exacerbated disease. Further, we revealed the critical role of T cells in mucosal repair as T cell-deficient mice failed to upregulate intestinal LIGHT expression and exhibited increased body weight loss and intestinal pathology. Analysis of mice with conditional inactivation of LTβR revealed that LTβR signaling in intestinal epithelial cells, but not in Lgr5+ intestinal stem cells, macrophages or dendritic cells was critical for mucosal repair. Furthermore, inactivation of the non-canonical NF-kB pathway member RelB in intestinal epithelial cells promoted MTX-induced disease. Based on these results, we propose a model wherein LIGHT produced by T cells activates LTβR-RelB signaling in intestinal epithelial cells to facilitate mucosal repair following chemotherapy treatment.

Keywords: IL-22; LIGHT; LTβR; RelB; intestinal damage; lymphotoxin; methotrexate.


Conflict of interest statement

The authors declare that the research was conducted in the absence of any commercial or financial relationships that could be construed as a potential conflict of interest. The author(s) declared that they were an editorial board member of Frontiers, at the time of submission. This had no impact on the peer review process and the final decision

Figures

Figure 1
Figure 1
LTβR signaling protects against MTX-induced intestinal damage. (A) Schematic of the experiment. WT and LTβR-/- mice were injected i.p. with MTX on day 0 (120 mg/kg) and day 1 (60 mg/kg), and small intestine (SI) collected at day 5. (B) Body weight change. Black arrows: days of MTX treatment. n=25–28 mice per group. (C) Representative photographs of SI. (D) Measurements of SI. (E) Representative H&E images and histopathology scores. Scale bars, 100μm. I, Ileum; J, Jejunum; D, Duodenum. (F) Ki-67 mRNA expression in ileum at indicated time points. n=4–7 mice per group. (G) Representative images of BrdU+ cells/crypt in the ileum. Scale bars, 100μm. (H–K) Expression of cytokines (H), chemokines (I), Muc2 (J), and IL-22 and antimicrobial proteins (K) in the ileum and quantification of BrdU+ cells measured by real-time PCR. n=7–8 mice per group. (L, M) Survival analysis (n=18 mice per group, L) and long-term body weight analysis (n=5 mice per group, dotted lines represent median starting body weight in each group, M). (C–E) Data represents 1 out of 6 independent experiments with similar results. (B, F–L) Data is combined from 2–6 independent experiments with similar results. Data shown as mean ± SEM. Statistics were determined using two-way ANOVA with Geisser-Greenhouse correction (B, M), unpaired t test (D–K), and Log-rank (Mantel-Cox) test (L). ns, not significant; *p<0.05, **p<0.01, ***p<0.001.
Figure 2
Figure 2
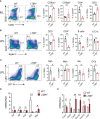
LTβR signaling controls accumulation of B cells, neutrophils and CD4+ T cells in the small intestine early after MTX treatment. WT and LTβR-/- mice were treated as in Figure 1A . Small intestines were collected on day 2 for analysis. (A) Representative flow cytometry plots and frequency of T cell populations in SI IEL. Frequency is calculated in live CD45+ gate. (B, C) Representative flow cytometry plots and frequency of cell populations in LP. B cells (CD45+B220+); CD4+ T cells; CD3+ T cells; ILC1s (CD45+Ly6G-B220-SiglecF-TCRβ-CD64-NK1.1+); Neutrophils (Nph, Ly6G+ CD11b+); Macrophages (Mph, CD11c-Ly6G-SiglecF-CD11b+MHCII+CD64+); Monocytes (Mo, CD45+Ly6G-B220-SiglecF-TCRβ-CD64+MHCII-CD11b+CCR2+); Dendritic cells (DCs, CD45+Ly6G-B220-SiglecF-TCRβ-CD64-MHCII+CD11c+). (D) Cytokine and (E) chemokine expression in the ileum on day 2 measured by real-time PCR. Data is representative from one of two independent experiments with similar results (n=3–6 per group). Data shown as mean ± SEM. ns, not significant, *p<0.05, **p<0.01. Statistics were determined using t test (A, B) or ANOVA with Sidak’s multiple comparison test (D, E). Gating strategy is shown in Supplementary Figure S2 .
Figure 3
Figure 3
LIGHT and T cells protect against MTX-induced intestinal injury. (A, B) Kinetics of LIGHT and LTβ expression after MTX treatment in (A) ileum, jejunum and duodenum, and (B) LP and IEL from small intestine of WT mice. n=3–4 per group. (C–F) WT, LTβ-/- and LIGHT-/- mice were treated with MTX as in Figure 1A . (C) Body weight loss. Black arrows: days of MTX treatment. n=15–25 mice per group. (D) Representative H&E images (scale bars, 100μm) and histopathology scores; (E) Ki-67 and (F) cytokine expression in the ileum of WT, LTβ-/- and LIGHT-/- mice on day 5 after MTX treatment. n=6–8 mice per group. (G) Survival of LIGHT-/- mice after MTX treatment. n=8–13 mice per group. (H–J) WT and RORγt-LTβ-/- mice were treated with MTX as in Figure 1A . (H) Body weight loss; n=13–15 mice per group. (I) Representative H&E images (Scale bars, 100μm) and histopathology scores; and (J) IL-22 expression in the ileum on day 5 after MTX treatment. n=5 mice per group. (K–M) WT, RORγt-/- and TCRβδ-/- mice were treated with MTX as in Figure 1A . (K) Body weight loss; n=8–14 per group. (L) Representative H&E images (Scale bars, 100μm) and histopathology scores and (M) cytokine expression in the ileum on day 5 after MTX treatment. n= 7 mice per group. (N) LIGHT expression in the ileum of WT and TCRβδ-/- mice at indicated time points after MTX treatment analyzed by real-time PCR. n=4–7 mice per group. H&E images and histopathology scores are representative from 3–4 independent experiments with similar results. Data shown as mean ± SEM. Statistics were determined using two-way ANOVA with Geisser-Greenhouse correction (A, C, K), Mann-Whitney test (B, J), Kruskal-Wallis test (D–F, L, M) or Brown-Forsythe and Welch ANOVA tests (N). ns, not significant, *p<0.05, **p<0.01, ***p<0.001, ****p<0.0001.
Figure 4
Figure 4
LTβR signaling cooperates with IL-22 for mucosal protection. LTβR-/- mice were intercrossed with IL-22-/- mice. Mice were treated with MTX as in Figure 1A . (A) Kinetics of body weight loss. n=8–18 mice per group. (B) Body weight loss at day 4 after MTX treatment. (C) Survival, n=6–18 mice per group. (D) Representative H&E images (scale bars, 100μm) and histopathology scores. (E) Expression of proinflammatory cytokines in the ileum on day 5. n=6–8 mice per group. Data was combined from 4–7 experiments with similar results. Statistics were determined using two-way ANOVA with Geisser-Greenhouse correction (A), unpaired t test (B), log-rank (Mantel-Cox) test (C), ordinary one-way ANOVA (D), Kruskal-Wallis test (E). ns, not significant, *p<0.05, **p<0.01, ***p<0.001, ****p<0.0001.
Figure 5
Figure 5
LTβR signaling in intestinal epithelial cells is required for protection against MTX-induced intestinal damage. (A–F) WT and Vil-LTβR-/- mice were treated with MTX, as in Figure 1A . (A) Body weight loss; n=19–22 mice per group. (B) Representative H&E images (scale bars, 100μm) and histopathology scores; Expression of (C) Ki-67, (D) cytokines and (E) chemokines in the ileum on day 5 after MTX treatment. n= 6–8 mice per group. (F) Survival; n=7–12 mice per group. (G, H) LTβR expression by Lgr5+ cells is dispensable for protection. WT and Lgr5-LTβR-/- mice were treated with MTX, as in Figure 1A , Lgr5-Cre expression was induced by tamoxifen administration. Mice were euthanized on day 5 for analysis. (G) Body weight change, n=11–14 mice per group (H) representative H&E images (scale bars, 100μm) and histopathology scores. Data combined from 2–5 independent experiments with similar results. Data shown as mean ± SEM. Statistics were determined using multiple unpaired t test (A), Mann-Whitney test (B), unpaired t test (C–E, H) or Log-rank (Mantel-Cox) test (F). ns, not significant; *p<0.05, **p<0.01, ***p<0.001.
Figure 6
Figure 6
Non-canonical NF-κB signaling in intestinal epithelial cells protects from MTX-induced intestinal damage. (A) CMT-93 epithelial cells were treated with MTX (5 μmol/L) or agonistic αLTβR antibody (ACH6, 0.5μg/ml) for 24 hours. Nfκb2 expression was measured by real-time PCR. (B) Nfκb2 expression in the ileum of WT mice treated with MTX was measured by real-time PCR. n= 4–7 mice per group. (C–F) WT and Vil-RelB-/- mice were treated with MTX as on Figure 1A . (C) Body weight loss; n=14–30 per group. (D) representative H&E images (scale bars, 100μm) and histopathology scores; Expression of (E) Ki-67, and (F) proinflammatory cytokines in the ileum on day 5 after treatment. n= 5 mice per group. Data is combined from 3–4 independent experiments with similar results. Data shown as mean ± SEM. Statistics were determined using unpaired t test (A, D), Mann-Whitney test (A, B), two-way ANOVA with Geisser-Greenhouse correction (C), or Kruskal-Wallis test (E, F). ns, not significant; *p<0.05; **p<0.01.
Figure 7
Figure 7
Model. LTβR signaling promotes mucosal healing following MTX-induced injury by controlling IL-22 dependent and IL-22 independent pathways. Mucosal damage promotes expression of LIGHT and LTβ in the intestine. In the IL-22 independent pathway, the interaction of LIGHT expressing T cells with LTβR in intestinal epithelial cells activates non-canonical RelB/p52 NF-kB signaling to promote proliferation of epithelial cells after injury. In the IL-22 dependent pathway, interaction of LIGHT/LT expressing ILC3s with CD11c+ LTβR-expressing cells promotes secretion of IL-22 which interacts with IL-22R to support the maintenance of Lgr5+ intestinal stem cells. LTβR expression in Lgr5+ stem cells is dispensable for protection.

Similar articles

References

    1. Dahlgren D, Sjoblom M, Hellstrom PM, Lennernas H. Chemotherapeutics-induced intestinal mucositis: pathophysiology and potential treatment strategies. Front Pharmacol. (2021) 12:681417. doi: 10.3389/fphar.2021.681417 - DOI - PMC - PubMed
    1. Sougiannis AT, VanderVeen BN, Davis JM, Fan D, Murphy EA. Understanding chemotherapy-induced intestinal mucositis and strategies to improve gut resilience. Am J Physiol Gastrointest Liver Physiol. (2021) 320:G712–G9. doi: 10.1152/ajpgi.00380.2020 - DOI - PMC - PubMed
    1. Basile D, Di Nardo P, Corvaja C, Garattini SK, Pelizzari G, Lisanti C, et al. . Mucosal injury during anti-cancer treatment: from pathobiology to bedside. Cancers (Basel). (2019) 11. doi: 10.3390/cancers11060857 - DOI - PMC - PubMed
    1. Villa A, Sonis ST. Mucositis: pathobiology and management. Curr Opin Oncol. (2015) 27:159–64. doi: 10.1097/CCO.0000000000000180 - DOI - PubMed
    1. Sonis ST. The pathobiology of mucositis. Nat Rev Cancer. (2004) 4:277–84. doi: 10.1038/nrc1318 - DOI - PubMed

LinkOut - more resources