. 2024 Aug;11(29):e2305593.
doi: 10.1002/advs.202305593. Epub 2024 Jun 14.

Target Identification and Mechanistic Characterization of Indole Terpenoid Mimics: Proper Spindle Microtubule Assembly Is Essential for Cdh1-Mediated Proteolysis of CENP-A

Affiliations

Target Identification and Mechanistic Characterization of Indole Terpenoid Mimics: Proper Spindle Microtubule Assembly Is Essential for Cdh1-Mediated Proteolysis of CENP-A

Yan Peng et al. Adv Sci (Weinh). 2024 Aug.

Abstract

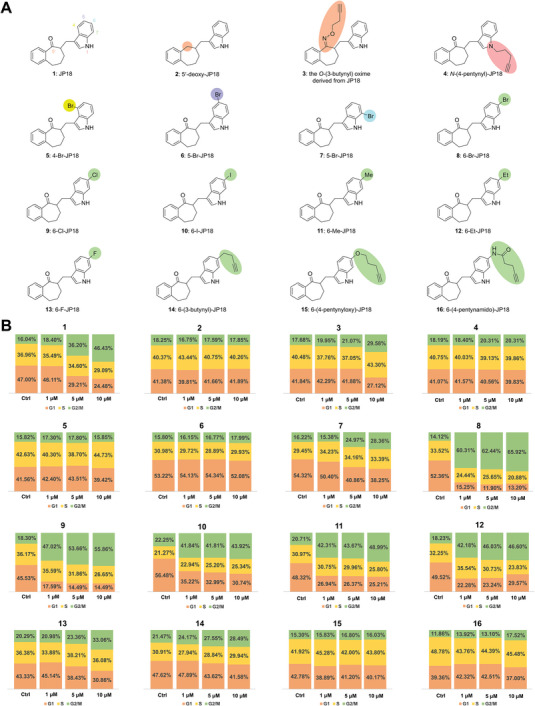
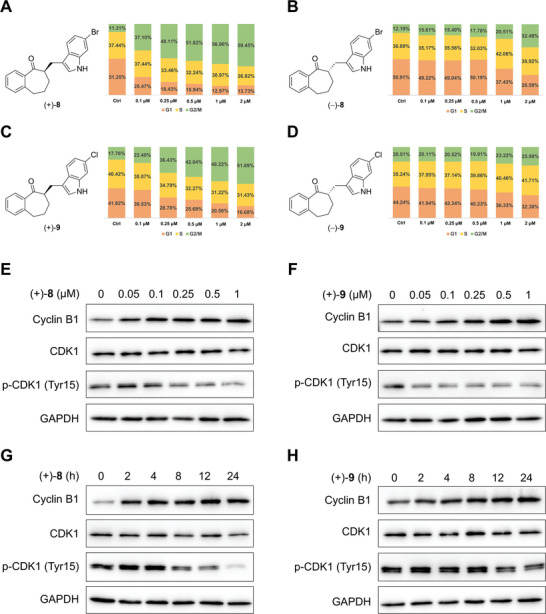
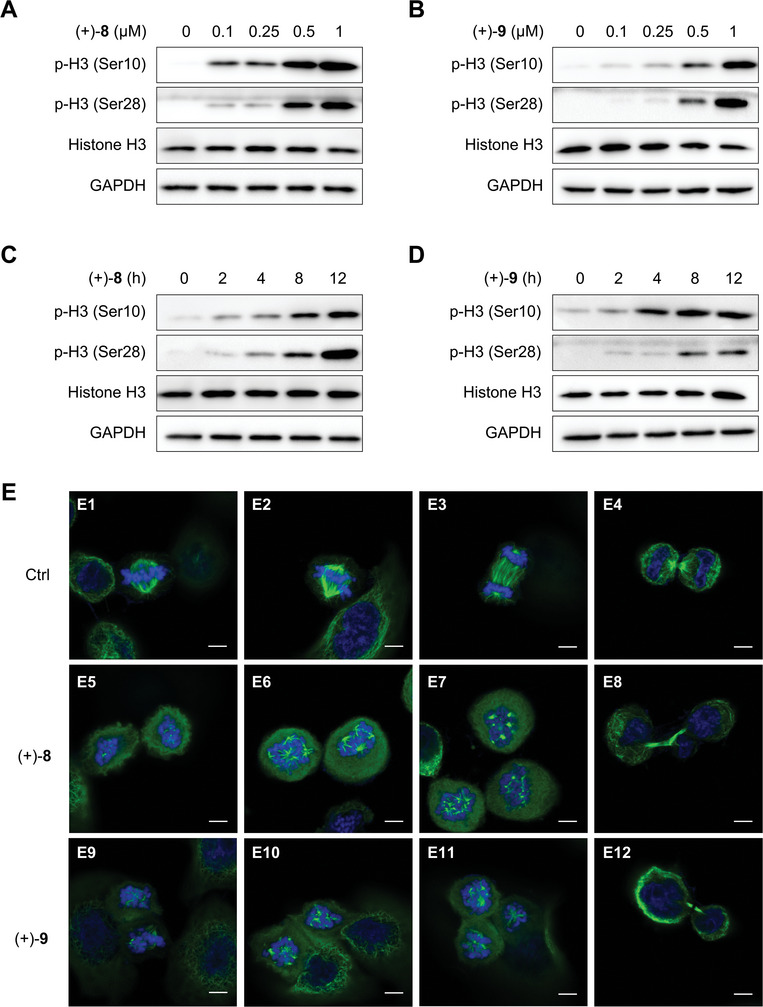
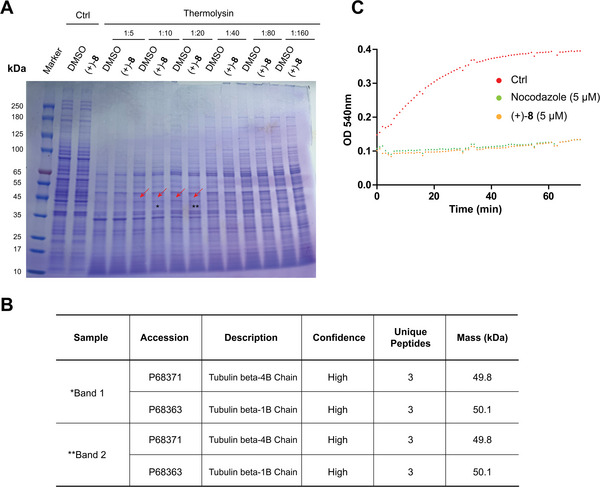
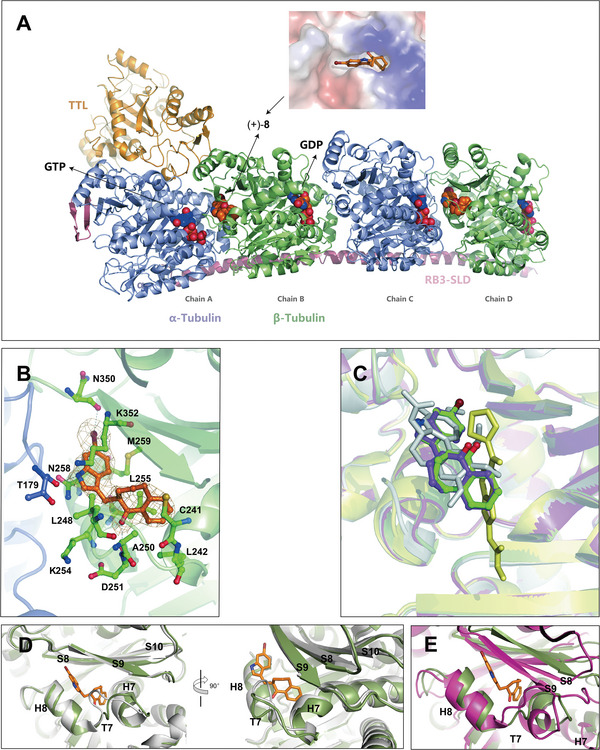
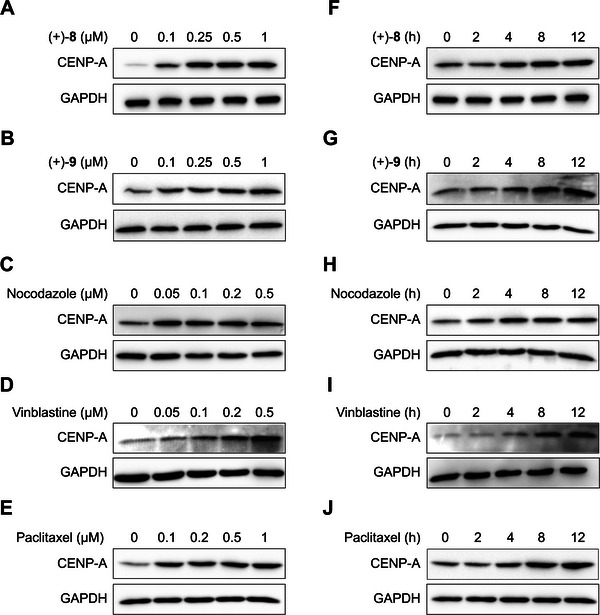
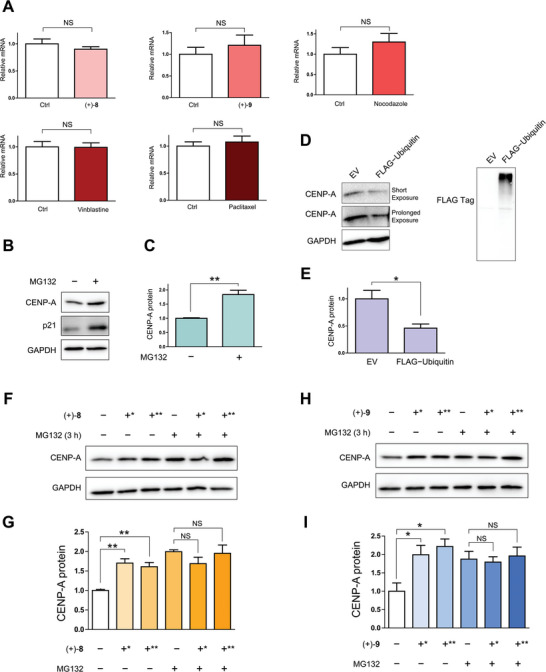
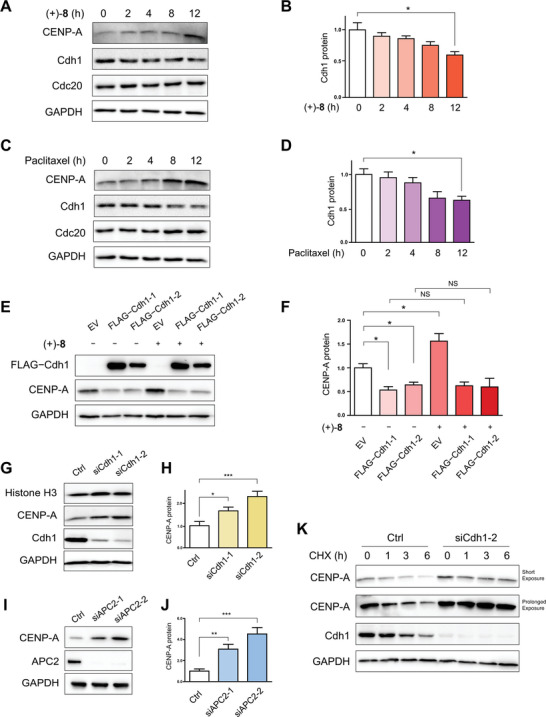
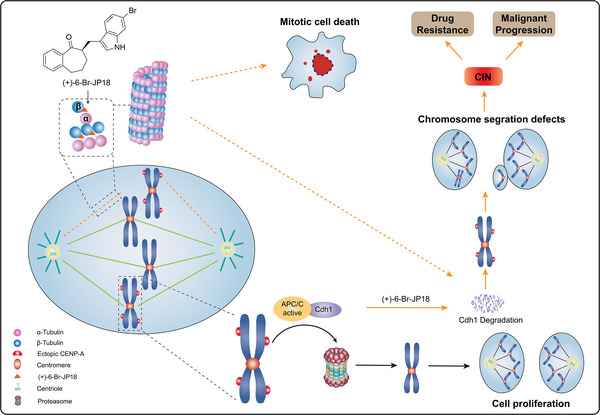
Centromere protein A (CENP-A), a centromere-specific histone H3 variant, is crucial for kinetochore positioning and chromosome segregation. However, its regulatory mechanism in human cells remains incompletely understood. A structure-activity relationship (SAR) study of the cell-cycle-arresting indole terpenoid mimic JP18 leads to the discovery of two more potent analogs, (+)-6-Br-JP18 and (+)-6-Cl-JP18. Tubulin is identified as a potential cellular target of these halogenated analogs by using the drug affinity responsive target stability (DARTS) based method. X-ray crystallography analysis reveals that both molecules bind to the colchicine-binding site of β-tubulin. Treatment of human cells with microtubule-targeting agents (MTAs), including these two compounds, results in CENP-A accumulation by destabilizing Cdh1, a co-activator of the anaphase-promoting complex/cyclosome (APC/C) E3 ubiquitin ligase. This study establishes a link between microtubule dynamics and CENP-A accumulation using small-molecule tools and highlights the role of Cdh1 in CENP-A proteolysis.

Keywords: CENP‐A regulation; Cdh1; colchicine‐binding site inhibitor; indole terpenoid; target identification.


Conflict of interest statement

The authors declare no conflict of interest.

Figures

Figure 1
Figure 1
Cell‐cycle‐arresting activity of JP18 and its analogs. A) Structures of JP18 (1) and its fifteen representative analogs (216). B) Flow cytometry‐based cell cycle analysis. HeLa cells were treated with indicated compounds at specified concentrations for 8 h and then stained with propidium iodide (PI). DMSO was used as a vehicle control for the compounds. Bar graphs depict the percentages of cells in the G2/M phase (green), S phase (yellow), and G1 phase (orange).
Figure 2
Figure 2
Determination of the enantiomeric forms of 6‐Br‐JP18 (8) and 6‐Cl‐JP18 (9) responsible for their cell‐cycle‐arresting activity. A,B) The cell‐cycle‐arresting effect of the two enantiomers of 6‐Br‐JP18 (8). HeLa cells were treated with (+)‐8 and (−)‐8, respectively, at indicated concentrations for 8 h. C,D) The cell‐cycle‐arresting effect of the two enantiomers of 6‐Cl‐JP18 (9). HeLa cells were treated with (+)‐9 and (−)‐9, respectively, at indicated concentrations for 8 h. Bar graphs depict the percentages of cells in the G2/M phase (green), S phase (yellow), and G1 phase (orange). E,F) Immunoblot analysis of G2/M phase markers in HeLa cells treated with (+)‐8 and (+)‐9, respectively, at indicated concentrations for 24 h. G,H) Immunoblot analysis of G2/M phase markers in HeLa cells treated with (+)‐8 (0.5 µM) and (+)‐9 (0.5 µM), respectively, for indicated durations. DMSO was used as a vehicle control for the compounds, and GAPDH was used as a loading control in immunoblotting.
Figure 3
Figure 3
Effect of compounds (+)‐8 and (+)‐9 on M phase markers. A,B) Immunoblot analysis of M phase markers in HeLa cells treated with (+)‐8 and (+)‐9, respectively, at indicated concentrations for 12 h. C,D) Immunoblot analysis of M phase markers in HeLa cells treated with (+)‐8 (0.5 µM) and (+)‐9 (0.5 µM), respectively, for indicated durations. GAPDH was used as a loading control in immunoblotting. E) Immunofluorescence analysis of spindle microtubules and chromosomes in HeLa cells treated with (+)‐8 (0.1 µM) and (+)‐9 (0.1 µM), respectively, for 8 h. Cells were stained with the α‐tubulin antibody (green) and DAPI (blue). Scale bars indicate 5 µm. DMSO was used as a vehicle control for the compounds.
Figure 4
Figure 4
Identification of α‐ and β‐tubulins as potential cellular targets of compound (+)‐8. A) A representative SDS–PAGE gel image showing the differential bands (ca. 45 kDa; marked with red arrows) in the DARTS assay used to identify the potential target(s) of (+)‐8. HeLa cell lysates were treated with (+)‐8 (10 µM) for 1 h and then digested by thermolysin for 30 min. The asterisks indicate the bands subjected to mass spectrometry analysis. *Band 1. **Band 2. B) Information on the potential protein targets of (+)‐8 identified by mass spectrometry. C) Inhibition of in vitro tubulin polymerization by (+)‐8. The curves for (+)‐8 (5 µM), nocodazole (5 µM), and the vehicle control (DMSO) are shown in yellow, green, and red, respectively.
Figure 5
Figure 5
X‐ray crystal structure of the T2R−TTL−(+)‐8 complex. A) Overall structure of the T2R−TTL−(+)‐8 complex. α‐Tubulin (light slate blue), β‐tubulin (green), RB3‐SLD (plum), and TTL (gold) are shown in cartoon representation, while compound (+)‐8, GDP, and GTP are shown in sphere representation. B) Close‐up view of the interaction between (+)‐8 and the colchicine‐binding site. α‐Tubulin and β‐tubulin are shown in light slate blue and green, respectively. The Fo−Fc simulated annealing omit map (contoured at 1.0 σ) is shown in mesh representation. The residues involved in the interaction between (+)‐8 and β‐tubulin are shown in stick representation. The hydrogen and halogen bonds are shown as dashed lines. C) Comparison of the positions of (+)‐8 and (+)‐9 with those of colchicine and nocodazole in the colchicine‐binding pocket. The four T2R−TTL−CBSI structures are superimposed, with (+)‐8 (green), (+)‐9 (medium purple), colchicine (gray), and nocodazole (yellow) shown in stick representation. D) Superimposition of the structure of (+)‐8‐bound β‐tubulin (green) and that of unbound β‐tubulin (gray) in the T2R−TTL complex. E) Superimposition of the structure of (+)‐8‐bound β‐tubulin (green) and that of unbound β‐tubulin (violet‐red) in the tubulin sheets.
Figure 6
Figure 6
MTAs increase CENP‐A levels. A–E) Immunoblot analysis of CENP‐A in HeLa cells treated with compounds (+)‐8 and (+)‐9, nocodazole, vinblastine, and paclitaxel, respectively, at indicated concentrations for 8 h. F–J) Immunoblot analysis of CENP‐A in HeLa cells treated with (+)‐8 (0.5 µM), (+)‐9 (0.5 µM), nocodazole (0.1 µM), vinblastine (0.05 µM), and paclitaxel (0.1 µM), respectively, for indicated durations. DMSO was used as a vehicle control for the compounds, and GAPDH was used as a loading control in immunoblotting.
Figure 7
Figure 7
Compounds (+)‐8 and (+)‐9 suppress UPS‐mediated degradation of CENP‐A. A) qRT‐PCR analysis of CENP‐A mRNA levels in HeLa cells treated with (+)‐8 (0.5 µM), (+)‐9 (0.5 µM), nocodazole (0.1 µM), vinblastine (0.05 µM), and paclitaxel (0.1 µM), respectively, for 6 h. The β‐actin mRNA level was used as an internal reference for normalization. Data are presented as mean ± standard error of the mean (s.e.m.). NS = not significant (significance level: α = 0.05; n = 3, two‐tailed Student's t‐test). B) Immunoblot analysis of CENP‐A in HeLa cells treated with MG132 (50 µM) for 3 h. p21 was used as a positive control for proteasome inhibition. C) Quantitative analysis of the immunoblotting data of CENP‐A from the above experiment. Data are presented as mean ± s.e.m. ** P < 0.01 (n = 3, two‐tailed Student's t‐test). D) Immunoblot analysis of CENP‐A in HeLa cells transfected with FLAG−ubiquitin. EV = empty vector. E) Quantitative analysis of the immunoblotting data of CENP‐A from the above experiment. Data are presented as mean ± s.e.m. *P < 0.05 (n = 3, two‐tailed Student's t‐test). F) Comparison of CENP‐A levels in HeLa cells treated with (+)‐8 (0.5 µM) and co‐treated with (+)‐8 (0.5 µM) and MG132 (50 µM) for indicated durations. *4 h. **6 h. G) Quantitative analysis of the immunoblotting data of CENP‐A from the above experiment. Data are presented as mean ± s.e.m. **P < 0.01, NS = not significant (n = 3, two‐tailed Student's t‐test). H) Comparison of CENP‐A levels in HeLa cells treated with (+)‐9 (0.5 µM) and co‐treated with (+)‐9 (0.5 µM) and MG132 (50 µM) for indicated durations. *4 h. **6 h. I) Quantitative analysis of the immunoblotting data of CENP‐A from the above experiment. Data are presented as mean ± s.e.m. *P < 0.05, NS = not significant (n = 3, two‐tailed Student's t‐test). DMSO was used as a vehicle control for the compounds, and GAPDH was used as a loading control in immunoblotting.
Figure 8
Figure 8
Compound (+)‐8 destabilizes Cdh1 to upregulate CENP‐A. A) Immunoblot analysis of CENP‐A, Cdh1, and Cdc20 in HeLa cells treated with (+)‐8 (0.5 µM) for indicated durations. B) Quantitative analysis of the immunoblotting data of Cdh1 from the above experiment. Data are presented as mean ± s.e.m. *P < 0.05 [significance level: α = 0.05; n = 3, one‐way analysis of variance (ANOVA) followed by Tukey's multiple comparison test]. C) Immunoblot analysis of CENP‐A, Cdh1, and Cdc20 in HeLa cells treated with paclitaxel (0.2 µM) for indicated durations. D) Quantitative analysis of the immunoblotting data of Cdh1 from the above experiment. Data are presented as mean ± s.e.m. *P < 0.05 (n = 3, one‐way ANOVA followed by Tukey's multiple comparison test). E) Immunoblot analysis of CENP‐A in HeLa cells transfected with FLAG−Cdh1 and then treated with (+)‐8 (0.5 µM) for 12 h. Cdh1‐1 and Cdh1‐2 represent human Cdh1 isoform 1 (Q9UM11‐2) and isoform 2 (Q9UM11‐1), respectively. F) Quantitative analysis of the immunoblotting data of CENP‐A from the above experiment. Data are presented as mean ± s.e.m. * P < 0.05, NS = not significant (n = 3, two‐tailed Student's t‐test). G) Immunoblot analysis of CENP‐A in HeLa cells transfected with siRNA targeting Cdh1 mRNA. H) Quantitative analysis of the immunoblotting data of CENP‐A from the above experiment. Data are presented as mean ± s.e.m. * P < 0.05, *** P < 0.001 (n = 6, two‐tailed Student's t‐test). I) Immunoblot analysis of CENP‐A in HeLa cells transfected with siRNA targeting APC2 mRNA. Two different siRNA oligos were used independently in each knockdown experiment. J) Quantitative analysis of the immunoblotting data of CENP‐A from the above experiment. Data are presented as mean ± s.e.m. ** P < 0.01, *** P < 0.001 (n = 6, two‐tailed Student's t‐test). K) Immunoblot analysis of CENP‐A in HeLa cells transfected with siRNA targeting Cdh1 mRNA and then treated with CHX (355 µM) for indicated durations. DMSO was used as a vehicle control for the compounds; siRNA targeting a non‐relevant mRNA was used as a negative control for knockdown; GAPDH was used as a loading control in immunoblotting.
Figure 9
Figure 9
Schematic illustrating the mechanism of action of (+)‐6‐Br‐JP18 on spindle microtubule assembly and Cdh1‐mediated CENP‐A proteolysis. (+)‐6‐Br‐JP18 disrupts microtubule assembly by targeting the colchicine‐binding site of β‐tubulin, which leads to downregulation of Cdh1, a co‐activator of the APC/C E3 ubiquitin ligase, and accumulation of its substrate CENP‐A. This accumulation impairs faithful chromosome segregation during mitosis and may result in CIN.

Similar articles

Cited by

References

    1. Mitchison T. J., Salmon E. D., Nat. Cell Biol. 2001, 3, E17. - PubMed
    1. McIntosh J. R., Cold Spring Harb. Perspect. Biol. 2016, 8, a023218. - PMC - PubMed
    1. Compton D. A., Annu. Rev. Biochem. 2000, 69, 95. - PubMed
    1. Gudimchuk N. B., McIntosh J. R., Nat. Rev. Mol. Cell Biol. 2021, 22, 777. - PubMed
    1. Jordan M. A., Wilson L., Nat. Rev. Cancer 2004, 4, 253. - PubMed

LinkOut - more resources