Review
. 2024 Sep;61(9):e14604.
doi: 10.1111/psyp.14604. Epub 2024 Jun 14.

Publication guidelines for human heart rate and heart rate variability studies in psychophysiology-Part 1: Physiological underpinnings and foundations of measurement

Affiliations
Review

Publication guidelines for human heart rate and heart rate variability studies in psychophysiology-Part 1: Physiological underpinnings and foundations of measurement

Karen S Quigley et al. Psychophysiology. 2024 Sep.

Abstract

This Committee Report provides methodological, interpretive, and reporting guidance for researchers who use measures of heart rate (HR) and heart rate variability (HRV) in psychophysiological research. We provide brief summaries of best practices in measuring HR and HRV via electrocardiographic and photoplethysmographic signals in laboratory, field (ambulatory), and brain-imaging contexts to address research questions incorporating measures of HR and HRV. The Report emphasizes evidence for the strengths and weaknesses of different recording and derivation methods for measures of HR and HRV. Along with this guidance, the Report reviews what is known about the origin of the heartbeat and its neural control, including factors that produce and influence HRV metrics. The Report concludes with checklists to guide authors in study design and analysis considerations, as well as guidance on the reporting of key methodological details and characteristics of the samples under study. It is expected that rigorous and transparent recording and reporting of HR and HRV measures will strengthen inferences across the many applications of these metrics in psychophysiology. The prior Committee Reports on HR and HRV are several decades old. Since their appearance, technologies for human cardiac and vascular monitoring in laboratory and daily life (i.e., ambulatory) contexts have greatly expanded. This Committee Report was prepared for the Society for Psychophysiological Research to provide updated methodological and interpretive guidance, as well as to summarize best practices for reporting HR and HRV studies in humans.

Keywords: guidelines; heart rate; heart rate variability; methodology; respiratory sinus arrhythmia; statistics; study design.


Conflict of interest statement

CONFLICT OF INTEREST STATEMENT

The authors declare no conflicts of interest with respect to their authorship or the publication of this article.

Figures

FIGURE 1
FIGURE 1
Electrocardiogram (ECG) and Einthoven’s triangle. The left panel shows the electrocardiogram (ECG) with waves P, Q, R, S, and T. The right diagram places the heart within Einthoven’s triangle with light gray shading in the atria and dark gray shading in the ventricles. The heart is depicted, by convention, as if one is looking into the chest from outside the body, hence the left heart is on the right side of the picture. Here, for clarity we show only the predominant electrical vector for the P, Q, and R waves.
FIGURE 3
FIGURE 3
Patterns of reciprocal and coactivational change in sympathetic nervous system (SNS) and parasympathetic nervous system (PNS) activity within the Autonomic Space. Panel (a) shows the conceptual model of Autonomic Space, illustrating reciprocal and coactivational modes of change. Panel (b) shows mean responses (changes scores from the 0, 0 center point) for n = 10 different individuals to three stimuli (reaction time task, math task and speech task) within this space, in milliseconds of change in heart period (HP) (data from Figure 4 in Berntson, Cacioppo, Binkley, Uchino, et al., 1994).
FIGURE 4
FIGURE 4
Lead II (top left) and modified Lead II (top right) electrocardiogram (ECG) placements. The top left figure illustrates the electrode placements for ground (G) as well as negative (−) and positive (+) electrodes corresponding to Einthoven’s scheme. The top right figure illustrates a commonly used modified Lead II placement in which the ground (G or reference) is placed on the lower right thorax, rather than on the arm to minimize movement artifact. These lead configurations are applicable to both females and males. The bottom panels illustrate the ECG and the heart within Einthoven’s triangle.
FIGURE 5
FIGURE 5
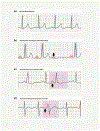
Normal sinus rhythm and sample cardiac arrhythmias. (a) Normal sinus rhythm. Note the small positive-going P wave just before the large QRS complex. (b) Wenckebach second-degree heart block. Note the presence of a P wave (arrow) not followed by a QRS complex (conduction failure). (c) Premature atrial contraction (PAC), with an often atypical (but not always) P wave, followed by a QRS complex. (d) Premature ventricular contraction (PVC). Note the generally widened and abnormally shaped QRS that is not preceded by a P wave (see arrow).
FIGURE 6
FIGURE 6
Extrinsic regulation of pacemaker cell activity by parasympathetic nervous system (PNS) and sympathetic nervous system (SNS) activity. Signaling pathways that translate SNS and PNS activity to effects on the depolarization of the sinoatrial pacemaker cells (upper part) translating into lengthening (PNS) and shortening (SNS) of the heart period (lower part). Upper part of the figure redrawn from Supplementary Figure 9 by Nolte et al. (2017) under the Creative Commons Attribution International License.
FIGURE 7
FIGURE 7
Slow and rapid depolarization, and repolarization phases of the pacemaker potential.
FIGURE 8
FIGURE 8
Two prominent frequency peaks in a frequency decomposition of heart rate variability (HRV). Squared variation in ms at a particular frequency (power) is shown for all frequencies of variation in heart period (HP) from 0 to 0.4 Hz. Very slow and ultra-slow frequencies, for example, diurnal variation, are shown on the left (below 0.05 Hz) and are rarely assessed except in chronobiological research (see Section 4.4).
FIGURE 9
FIGURE 9
Origins of respiratory sinus arrhythmia (RSA). (Redrawn from Berntson, Cacioppo, & Quigley, 1994). Most cardiorespiratory coupling leading to RSA occurs by inhibiting and enhancing effects of the respiratory generator on the activity of parasympathetic and sympathetic motor neurons. This modulates the tonic input from their generating circuits to yield a respiratory rhythm in the output of these visceromotor neurons to the sinoatrial (SA) node. These effects are mirrored for parasympathetic and sympathetic activity. Parasympathetic activity is enhanced during expiration, whereas sympathetic activity is enhanced during inspiration. Superimposed on the respiratory rhythm are rhythms caused by input from the baroreceptors, chemoreceptors, and pulmonary stretch receptors. Prolonged or exaggerated lung inflation induces the Hering–Breuer reflex through stretch receptors, which terminates inspiration and prevents over-inflation of the lungs. The latter can directly influence brainstem processing to induce respiratory patterns in autonomic activity linked to heart rate variability (HRV). During normal respiration, however, the Hering–Breuer reflex plays little role, and changes in the functioning of these stretch receptors by disease or artificial stimulation also does not substantially impact respiratory-linked HRV (e.g., only around 10 percent of the amplitude of HRV could be attributed to such reflex effects; Koh et al., 1994). The induced rhythms in the sympathetic and parasympathetic nerves to the SA node do not translate to similar periodic patterns in HP due to differential filter characteristics of the SA node for norepinephrine- versus acetylcholine-mediated neurotransmission, indicated in green and blue, respectively. See text for discussion.
FIGURE 10
FIGURE 10
Transfer function (a) and how it differs for parasympathetic (b—blue line) and sympathetic (b—green line) nerve traffic. Panel (a) illustrates relevant transfer function terminology and describes how stimulation frequency is transferred largely undiminished (indexed as 1.0) up to a corner frequency where transfer begins to decrease (Rolloff) and then a point (lower corner frequency) where transfer effectively ceases. In Panel (b), these features can be seen as transfer function graphs for the parasympathetic (blue) and sympathetic (green) inputs to the heart.
FIGURE 11
FIGURE 11
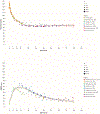
Age effects on resting levels of heart rate (HR) (upper panel) and root mean square of the successive beat differences (RMSSD) (lower panel) from childhood to adulthood. The figure displays data from large (>3500) population-based studies (Fleming et al., 2011; Harteveld et al., 2021; Tegegne et al., 2020; van den Berg, et al., 2018) or studies spanning a large (>70 years) age range (Almeida-Santos et al., 2016; Antelmi et al., 2004; Koenig et al., 2021; Silvetti et al., 2001; Voss et al., 2015; Zulfiqar et al., 2010) measuring resting levels of HR and RMSSD in narrow age bins at different ages. They suggest a complex pattern of maturation in childhood and adolescence for both HR and HRV measures that, for HRV, gives way to a gradual but asymptotic decline in adulthood.
FIGURE 12
FIGURE 12
Main and interactive effects of parasympathetic nervous system (PNS) and sympathetic nervous system (SNS) neurons on SA nodal cell activity. Transmitters and receptors diagrammed to show action of these for PNS and SNS effects on sinoatrial (SA) nodal (SAN) activity. We show both positive effects (+) or shortening heart period (HP) and negative effects (−) or lengthening HP. Note there are presynaptic interactions in both parasympathetic and sympathetic neurons, as well as a multiplicity of influences postsynaptically. Figure redrawn from Figure 5 by Fedele & Brand (2020) under the Creative Commons Attribution License.
FIGURE 2
FIGURE 2
Illustration of how to compute weighted heart period (HP) and heart rate (HR). The upper part of the figure illustrates four interbeat intervals (IBIs) (750, 730, 745, and 775 ms, respectively). Clock units are shown under the cardiac units (with 3 s shown). Below that, arrows depict samples obtained every 100 ms (i.e., 10 samples/s) beginning at Time 0. For simplicity of this example, sampling began at the same time as the start of beat 1. Example calculations are given in Box 1 for a 1-second and 3-second weighted HP and for a 1-second weighted HR. By using each sample associated with each IBI, we can cumulate and appropriately weight the proportion of time associated with each IBI. Redrawn from the example in Stern et al. (2001).

Similar articles

Cited by

References

    1. Acharya UR, Joseph KP, Kannathal N, Lim CM, & Suri JS (2006). Heart rate variability: A review. Medical & Biological Engineering & Computing, 44(12), 1031–1051. 10.1007/s11517-006-0119-0 - DOI - PubMed
    1. Ahmed MW, Kadish AH, Parker MA, & Goldberger JJ (1994). Effect of physiologic and pharmacologic adrenergic stimulation on heart rate variability. Journal of the American College of Cardiology, 24(4), 1082–1090. - PubMed
    1. Akselrod S, Gordon D, Madwed JB, Snidman NC, Shannon DC, & Cohen RJ (1985). Hemodynamic regulation: Investigation by spectral analysis. American Journal of Physiology. Heart and Circulatory Physiology, 249(4), H867–H875. - PubMed
    1. Akselrod S, Gordon D, Ubel FA, Shannon DC, Berger AC, & Cohen RJ (1981). Power spectrum analysis of heart rate fluctuation: A quantitative probe of beat-to-beat cardiovascular control. Science, 213(4504), 220–222. http://www.ncbi.nlm.nih.gov/pubmed/6166045 - PubMed
    1. Alcantara JMA, Plaza-Florido A, Amaro-Gahete FJ, Acosta FM, Migueles JH, Molina-Garcia P, Sacha J, Sanchez-Delgado G, & Martinez-Tellez B (2020). Impact of using different levels of threshold-based artefact correction on the quantification of heart rate variability in three independent human cohorts. Journal of Clinical Medicine, 9(2), 325. 10.3390/jcm9020325 - DOI - PMC - PubMed

LinkOut - more resources