. 2024 Jul;52(1):97.
doi: 10.3892/or.2024.8756. Epub 2024 Jun 14.

2‑D08 mediates notable anticancer effects through multiple cellular pathways in uterine leiomyosarcoma cells

Affiliations

2‑D08 mediates notable anticancer effects through multiple cellular pathways in uterine leiomyosarcoma cells

Hosouk Joung et al. Oncol Rep. 2024 Jul.

Abstract

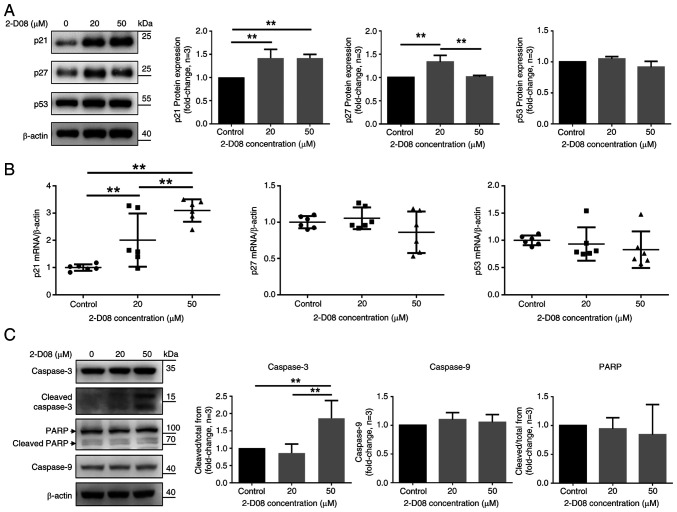
2',3',4'‑trihydroxyflavone (2‑D08), a SUMO E2 inhibitor, has several biological functions, including anticancer activity, but its effects on uterine leiomyosarcoma (Ut‑LMS) are unknown. The anticancer activity of 2‑D08 was explored in an in vitro model using SK‑LMS‑1 and SK‑UT‑1B cells (human Ut‑LMS cells). Treatment with 2‑D08 inhibited cell viability in a dose‑ and time‑dependent manner and significantly inhibited the colony‑forming ability of Ut‑LMS cells. In SK‑UT‑1B cells treated with 2‑D08, flow cytometric analysis revealed a slight increase in apoptotic rates, while cell cycle progression remained unaffected. Western blotting revealed elevated levels of RIP1, indicating induction of necrosis, but LC3B levels remained unchanged, suggesting no effect on autophagy. A lactate dehydrogenase (LDH) assay confirmed increased LDH release, further supporting the induction of apoptosis and necrosis by 2‑D08 in SK‑UT‑1B cells. 2‑D08‑induced production of reactive oxygen species and apoptosis progression were observed in SK‑LMS‑1 cells. Using Ki67 staining and bromodeoxyuridine assays, it was found that 2‑D08 suppressed proliferation in SK‑LMS‑1 cells, while treatment for 48 h led to cell‑cycle arrest. 2‑D08 upregulated p21 protein expression in SK‑LMS‑1 cells and promoted apoptosis through caspase‑3. Evaluation of α‑SM‑actin, calponin 1 and TAGLN expression indicated that 2‑D08 did not directly initiate smooth muscle phenotypic switching in SK‑LMS‑1 cells. Transcriptome analysis on 2‑D08‑treated SK‑LMS‑1 cells identified significant differences in gene expression and suggested that 2‑D08 modulates cell‑cycle‑ and apoptosis‑related pathways. The analysis identified several differentially expressed genes and significant enrichment for biological processes related to DNA replication and molecular functions associated with the apoptotic process. It was concluded that 2‑D08 exerts antitumor effects in Ut‑LMS cells by modulating multiple signaling pathways and that 2‑D08 may be a promising candidate for the treatment of human Ut‑LMS. The present study expanded and developed knowledge regarding Ut‑LMS management and indicated that 2‑D08 represents a notable finding in the exploration of fresh treatment options for such cancerous tumors.

Keywords: 2‑D08; SK‑LMS‑1; SK‑UT‑1B; apoptosis; leiomyosarcoma; proliferation; uterine.


Conflict of interest statement

The authors declare that they have no competing interests.

Figures

Figure 1.
Figure 1.
2-D08 decreases viability and colony formation ability in the Ut-LMS cells. (A) Chemical structure of 2-D08. (B-D) Ut-LMS cells and Ut-SMCs were treated with various concentrations (0–100 µM) of 2-D08 for 24 or 48 h. After the end of incubation, cell viability was measured using MTT assays. Graphs of viability versus 2-D08 concentrations were used to calculate IC50 values based on the trendline equation for Ut-LMS cells. (E) Ut-LMS cells were treated with 2-D08 at the indicated concentration (0–100 µM) for 7 days. Representative microscopic images of the colonies stained using crystal violet (white scale bar, 1,000 µm; black scale bar, 400 µm). (F and G) After 7 days, dose-survival curves derived from a clonogenic survival assay and comparisons of plating efficiency were performed. Surviving fractions were calculated based on colony counts and plating efficiency. The data are reported as the mean ± SEM. All experiments were repeated thrice. **P<0.01 compared with the control group. 2-D08, 2′,3′,4′-trihydroxyflavone; Ut-LMS, uterine leiomyosarcoma; Ut-SMCs, uterine smooth muscle cells; SEM, standard error of the mean.
Figure 2.
Figure 2.
2-D08-induced apoptotic and necrotic cell death is dependent on RIP1. (A and B) After treatment with 2-D08 at the indicated concentrations, SK-UT-1B cells were stained with Annexin V and propidium iodide to analyze the apoptotic rates and cell cycle distribution, respectively, using flow cytometry. The quantitative data are shown in the right panel. (C) Representative western blots of the necrosis marker RIP1 and autophagy maker LC3B. SK-UT-1B cells were treated with 2-D08 at 20 and 50 µM and the indicated proteins were analyzed 48 h after treatment. (D) In vitro LDH assay of SK-UT-1B cells. The cells were treated for 24 or 48 h with 2-D08 at indicated concentrations (10, 20, 50, or 100 µM) and the supernatants were analyzed for LDH content, as described in the materials and methods. Cell lysis solution served as a positive control for 100% cell lysis and LDH release. Three experiments were performed that showed similar results. The data are presented as the mean ± SEM. **P<0.01. 2-D08, 2′,3′,4′-trihydroxyflavone; LDH, lactate dehydrogenase; SEM, standard error of the mean.
Figure 3.
Figure 3.
2-D08 induces ROS production and apoptosis in SK-LMS-1 cells. (A) SK-LMS-1 cells were exposed to 2-D08 (0, 20, 50, or 100 µM) for 24 and 48 h. Intracellular ROS fluorescence signals were detected using the Muse Oxidative Stress kit, and typical ROS profile plots are shown. A similar pattern was observed in three independent experiments. The percentage of ROS-positive cells is revealed in the histogram graph (right). (B) SK-LMS-1 cells were treated with 0, 20, 50, or 100 µM of 2-D08 for 24 and 48 h. Apoptosis was decided using Annexin V staining and flow cytometry. Representative results are demonstrated in the left panel, and the statistical analysis is represented in the right panel. (C) Apoptosis was measured in SK-LMS-1 cells treated with 2-D08 (100 µM) in the presence or absence NAC (5 mM) and CAT (50 units/ml) for 24 h. NAC and CAT, acting as ROS scavengers, partly rescued the 2-D08-induced apoptosis in SK-LMS-1 cells. The data are expressed as the mean ± SEM; n=3. **P<0.01. 2-D08, 2′,3′,4′-trihydroxyflavone; ROS, reactive oxygen species; NAC, N-acetyl-L-cysteine; CAT, catalase; SEM, standard error of the mean.
Figure 4.
Figure 4.
Inhibition of SK-LMS-1 cell proliferation and cell cycle by 2-D08. (A) SK-LMS-1 cells were treated with 20 and 50 µM of 2-D08 for 48 h, and immunofluorescence assays were used to analyze the expression of the cell proliferation marker Ki67 in the treated cells. Red, Ki67; blue, nuclear DNA. Scale bar, 200 µm. (B) The percentage of Ki67-positive cells at the indicated concentrations at 48 h. The Muse Ki67 Proliferation kit allowed for the quantification of the percentages of proliferating and non-proliferating cells based on Ki67 expression. (C) A BrdU assay was performed after 48 h of treatment of SK-LMS-1 cells with 2-D08 (20 or 50 µM). Absorbance was measured at 450 nm using a microplate reader. (D) SK-LMS-1 cells were treated with 2-D08 (0, 20, or 50 µM) for 24 and 48 h and then subjected to a DNA content analysis using flow cytometry. The left panel shows a representative histogram of the cell cycle distribution, while the right panel quantifies the cell cycle distributions. The data are presented as the mean ± SEM of three independent experiments. **P<0.01 compared with each group. 2-D08, 2′,3′,4′-trihydroxyflavone; SEM, standard error of the mean.
Figure 5.
Figure 5.
The effects of 2-D08 on the expression of cell proliferation- and apoptosis-associated genes in SK-LMS-1 cells. (A) Expression of p21, p27 and p53 proteins in SK-LMS-1 cells exposed to 2-D08. The bar graph shows the density ratios of the p21, p27 and p53 protein bands relative to β-actin bands. (B) The mRNA levels of p21, p27 and p53 were assessed using reverse transcription-quantitative PCR analysis. The results are presented as the mean ± SEM (n=6). (C) Western blot analysis of the effect of 2-D08 on the activation and proteolytic cleavage by Caspase-3, Caspase-9 and PARP in the SK-LMS-1 cells. The bands in the left panel were quantified using an image analyzer. The data are presented as the mean ± SEM of three independent experiments. **P<0.01 compared with each group. 2-D08, 2′,3′,4′-trihydroxyflavone; SEM, standard error of the mean.
Figure 6.
Figure 6.
Expression of contractile SMC-specific proteins analyzed using western blot analysis and RT-qPCR in SK-LMS-1 cells treated with 2-D08. (A) The expression of α-SM-actin, TAGLN, and Calponin 1 were assessed using western blot analysis. The bands in the left panel were quantified using an image analyzer. The results are represented as the mean ± SEM (n=3). (B) The mRNA levels of α-SM-actin, TAGLN and Calponin 1 were assessed using RT-qPCR. The results are presented as the mean ± SEM (n=6). **P<0.01. 2-D08, 2′,3′,4′-trihydroxyflavone; RT-qPCR, reverse transcription-quantitative PCR; SEM, standard error of the mean.
Figure 7.
Figure 7.
Transcriptome analysis of RNA-sequencing data for 2-D08-treated SK-LMS-1 cells. (A) Principal component analysis plot displaying two groups along PC1 and PC2, which describe 93 and 6% of the variance, respectively. (B) Differential gene expression is shown in the heatmap. Each line with two biological replicates. DEGs were defined by absolute log2 fold change (FC) >2 and P-value <1.3. Blue and yellow indicate low and high gene expression levels, respectively. (C) Volcano plot showing DEGs in control vs. 2-D08-treated cells. Differences in expression are considered significant for |log2FC|>1 and P-value <0.05. Genes with downregulated and upregulated expression are indicated in red and violet, respectively. Dark grey dots indicate non-significant differential gene expression. (D and E) GO analysis revealed the major biological processes and gene set enrichment analysis of the regulated pathways in the control vs. 2-D08-treated cells. (F) GO analysis revealed the molecular functions enriched in the control vs. 2-D08-treated cells. 2-D08, 2′,3′,4′-trihydroxyflavone; DEGs, differentially expressed genes; GO, Gene Ontology.
Figure 8.
Figure 8.
2-D08 modulates multiple cellular pathways to exert its antitumor effect in uterine leiomyosarcoma cells. 2-D08, 2′,3′,4′-trihydroxyflavone.

Similar articles

Cited by

References

    1. Echt G, Jepson J, Steel J, Langholz B, Luxton G, Hernandez W, Astrahan M, Petrovich Z. Treatment of uterine sarcomas. Cancer. 1990;66:35–39. doi: 10.1002/1097-0142(19900701)66:1<35::AID-CNCR2820660108>3.0.CO;2-V. - DOI - PubMed
    1. Kim WY, Chang SJ, Chang KH, Yoon JH, Kim JH, Kim BG, Bae DS, Ryu HS. Uterine leiomyosarcoma: 14-year two-center experience of 31 cases. Cancer Res Treat. 2009;41:24–28. doi: 10.4143/crt.2009.41.1.24. - DOI - PMC - PubMed
    1. Tirumani SH, Deaver P, Shinagare AB, Tirumani H, Hornick JL, George S, Ramaiya NH. Metastatic pattern of uterine leiomyosarcoma: Retrospective analysis of the predictors and outcome in 113 patients. J Gynecol Oncol. 2014;25:306–312. doi: 10.3802/jgo.2014.25.4.306. - DOI - PMC - PubMed
    1. Chern JY, Boyd LR, Blank SV. Uterine sarcomas: The latest approaches for these rare but potentially deadly tumors. Oncology (Williston Park) 2017;31:229–236. - PubMed
    1. Murakami M, Ichimura T, Kasai M, Matsuda M, Kawamura N, Fukuda T, Sumi T. Examination of the use of needle biopsy to perform laparoscopic surgery safely on uterine smooth muscle tumors. Oncol Lett. 2018;15:8647–8651. - PMC - PubMed

MeSH terms