

Janus and Amphiphilic MoS2 2D Sheets for Surface-Directed Orientational Assemblies toward Ex Vivo Dual Substrate Release
- PMID: 38874104
- PMCID: PMC11671850
- DOI: 10.1002/smtd.202400533
Janus and Amphiphilic MoS2 2D Sheets for Surface-Directed Orientational Assemblies toward Ex Vivo Dual Substrate Release
Abstract
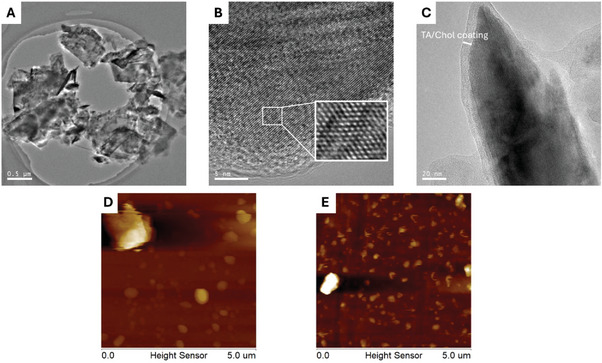
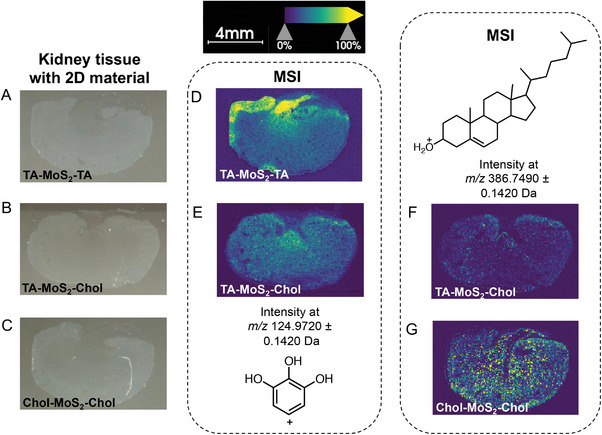
The two-dimensional (2-D) Janus and amphiphilic molybdenum disulfide (MoS2) nanosheet with opposite optical activities on each side (amphichiral) is synthesized by modifying sandwich-like bulk MoS2 with tannic acid and cholesterol through biphasic emulsion method. This new type of amphichiral Janus MoS2 nanosheet consists of a hydrophilic and positive optical activity tannic acid side as well as a hydrophobic and negative optical activity cholesterol side thereby characterized by circular dichroism. Surface-directed orientational differentiation assemblies are performed for the as-synthesized 2D material and are characterized by contact angle, infrared spectroscopy, X-ray photoelectron, and circular dichroism spectroscopies. The amphiphilic nature of the materials is demonstrated by the pre-organization of the nanosheets on either hydrophobic or hydrophilic surfaces, providing unprecedented properties of circular dichroism signal enhancement and wettability. Selective detachment of the surface organic groups (cholesterol and tannic acid fragments) is realized by matrix-assisted laser desorption/ionisation - time-of-flight (MALDI-TOF) mass spectrometry, and the dual substrate release in tissue is detected by ex vivo mass spectrometry imaging.
Keywords: 2‐D materials; janus materials; mass spectrometry imaging; molybdenum disulfide; surface‐directed orientational self‐assembly.
© 2024 The Author(s). Small Methods published by Wiley‐VCH GmbH.
Conflict of interest statement
The authors declare no conflict of interest.
Figures


Similar articles
-
Design and Preparation of Carbon Nitride-Based Amphiphilic Janus N-Doped Carbon/MoS2 Nanosheets for Interfacial Enzyme Nanoreactor.ACS Appl Mater Interfaces. 2020 Mar 11;12(10):12227-12237. doi: 10.1021/acsami.9b18735. Epub 2020 Feb 27. ACS Appl Mater Interfaces. 2020. PMID: 32053348
-
MoS2/Ag nanohybrid: A novel matrix with synergistic effect for small molecule drugs analysis by negative-ion matrix-assisted laser desorption/ionization time-of-flight mass spectrometry.Anal Chim Acta. 2016 Sep 21;937:87-95. doi: 10.1016/j.aca.2016.06.026. Epub 2016 Jul 7. Anal Chim Acta. 2016. PMID: 27590549
-
Toxicity evaluation of bulk and nanosheet MoS2 catalysts using battery bioassays.Chemosphere. 2021 Apr;268:128822. doi: 10.1016/j.chemosphere.2020.128822. Epub 2020 Oct 29. Chemosphere. 2021. PMID: 33162164
-
Functionalization of 2D MoS2 Nanosheets with Various Metal and Metal Oxide Nanostructures: Their Properties and Application in Electrochemical Sensors.Biosensors (Basel). 2022 Jun 2;12(6):386. doi: 10.3390/bios12060386. Biosensors (Basel). 2022. PMID: 35735534 Free PMC article. Review.
-
An insight into the dual role of MoS2-based nanocarriers in anticancer drug delivery and therapy.Acta Biomater. 2024 Apr 15;179:36-60. doi: 10.1016/j.actbio.2024.03.019. Epub 2024 Mar 27. Acta Biomater. 2024. PMID: 38552760 Review.
References
-
- Zhang X., Lai Z., Tan C., Zhang H., Angew. Chem. Int. Ed. 2016, 55, 8816. - PubMed
-
- Khan K., Tareen A. K., Aslam M., Wang R., Zhang Y., Mahmood A., Ouyang Z., Zhang H., Guo Z., J. Mater. Chem. C 2020, 8, 387.
-
- Jiao Y., Hafez A. M., Cao D., Mukhopadhyay A., Ma Y., Zhu H., Small 2018, 14, 1800640. - PubMed
-
- Liu C., Bai Y., Zhao Y., Yao H., Pang H., Energy Storage Mater. 2020, 33, 470.
-
- Liu T., Liu Z., Adv. Healthcare Mater. 2018, 7, 1701158.
Grants and funding
LinkOut - more resources
Full Text Sources
