. 2024 Aug;11(31):e2309940.
doi: 10.1002/advs.202309940. Epub 2024 Jun 14.

Smart Microneedle Arrays Integrating Cell-Free Therapy and Nanocatalysis to Treat Liver Fibrosis

Affiliations

Smart Microneedle Arrays Integrating Cell-Free Therapy and Nanocatalysis to Treat Liver Fibrosis

Yanteng Xu et al. Adv Sci (Weinh). 2024 Aug.

Abstract

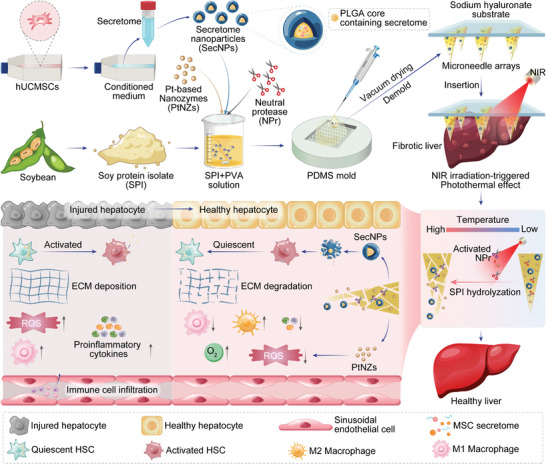
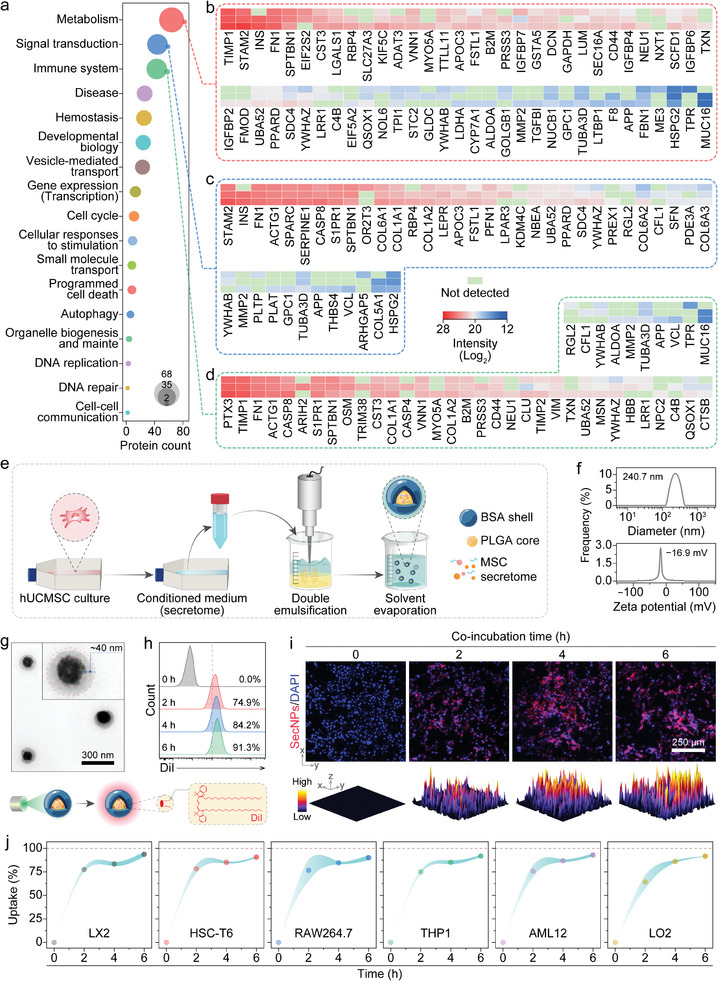
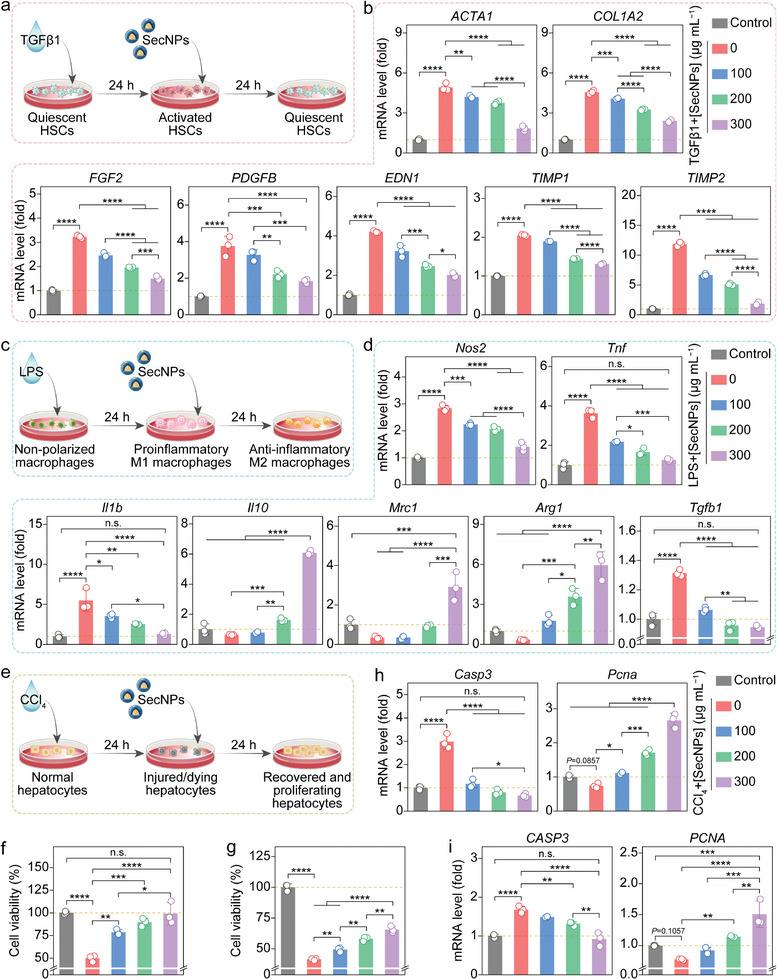
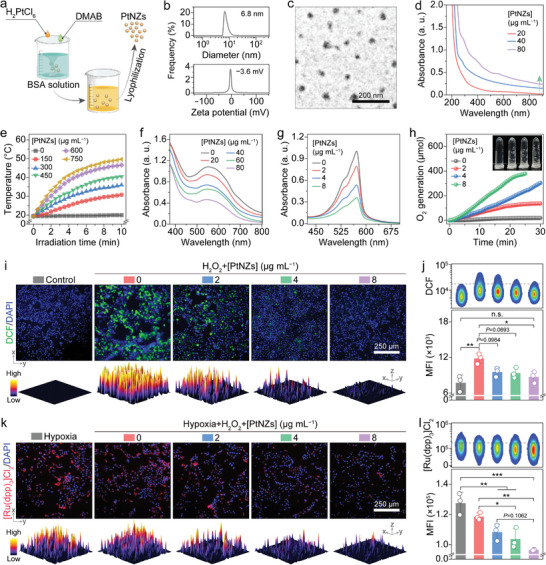
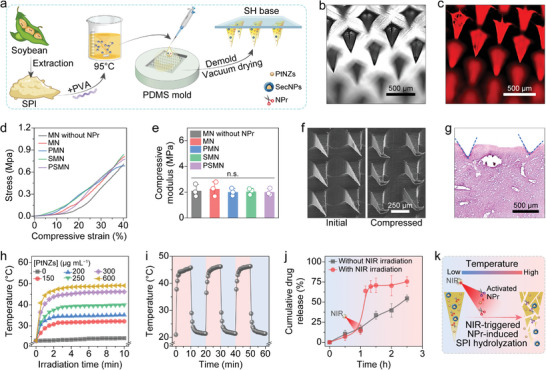
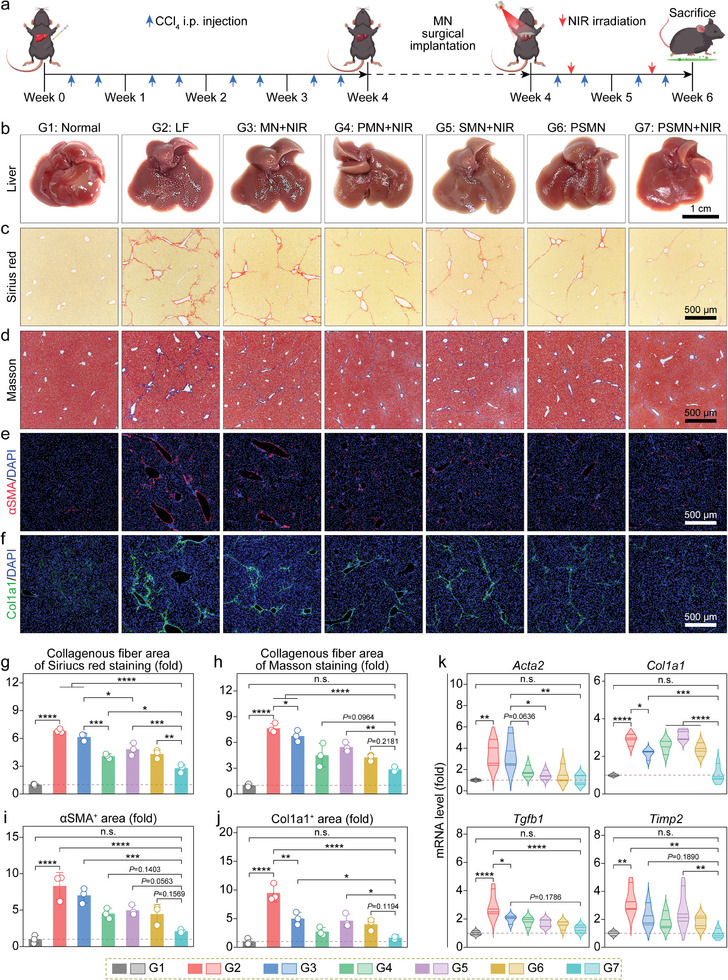
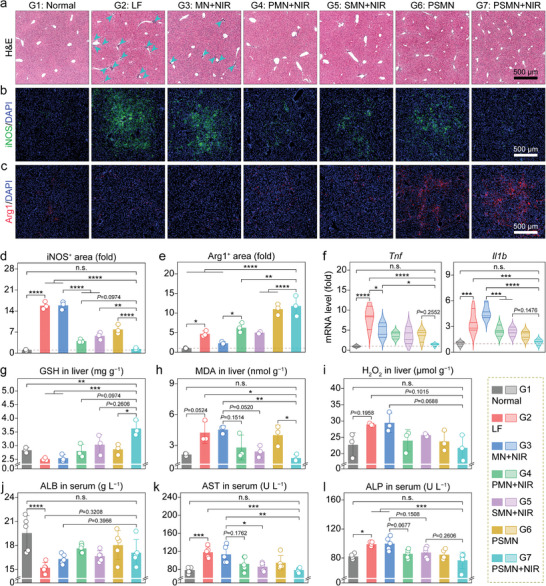
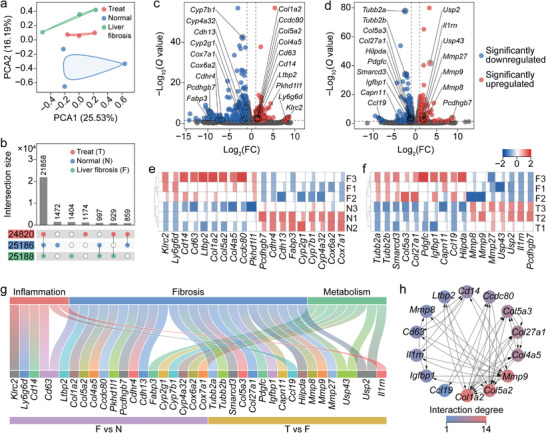
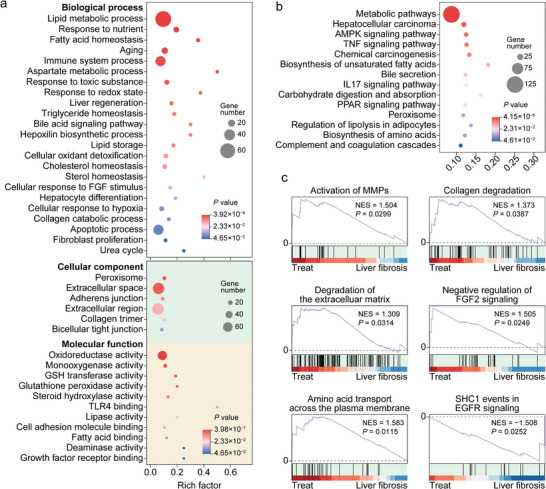
Liver fibrosis is a chronic pathological condition lacking specific clinical treatments. Stem cells, with notable potential in regenerative medicine, offer promise in treating liver fibrosis. However, stem cell therapy is hindered by potential immunological rejection, carcinogenesis risk, efficacy variation, and high cost. Stem cell secretome-based cell-free therapy offers potential solutions to address these challenges, but it is limited by low delivery efficiency and rapid clearance. Herein, an innovative approach for in situ implantation of smart microneedle (MN) arrays enabling precisely controlled delivery of multiple therapeutic agents directly into fibrotic liver tissues is developed. By integrating cell-free and platinum-based nanocatalytic combination therapy, the MN arrays can deactivate hepatic stellate cells. Moreover, they promote excessive extracellular matrix degradation by more than 75%, approaching normal levels. Additionally, the smart MN arrays can provide hepatocyte protection while reducing inflammation levels by ≈70-90%. They can also exhibit remarkable capability in scavenging almost 100% of reactive oxygen species and alleviating hypoxia. Ultimately, this treatment strategy can effectively restrain fibrosis progression. The comprehensive in vitro and in vivo experiments, supplemented by proteome and transcriptome analyses, substantiate the effectiveness of the approach in treating liver fibrosis, holding immense promise for clinical applications.

Keywords: controlled release; liver fibrosis; microneedle array; nanozyme; stem cell secretome.


Conflict of interest statement

The authors declare no conflict of interest.

Figures

Scheme 1
Scheme 1
Schematic illustration of fabricating and implanting NIR‐responsive MN arrays containing hUCMSC‐derived secretome‐encapsulated core–shell nanoparticles and versatile nanozymes to alleviate liver fibrosis. The conditioned medium of hUCMSCs, devoid of serum, was collected and subjected to purification to obtain the secretome, which was then encapsulated in the PLGA core of SecNPs using a double emulsification technique. The SecNPs and PtNZs were integrated into smart MN arrays consisting of SPI, PVA, and NPr. The MN patches were implanted into the fibrotic liver and underwent responsive degradation through the hydrolysis of NPr, which was activated by the photothermal effect of PtNZs upon NIR irradiation. The released SecNPs could repair injured hepatocytes, promote hepatocyte proliferation, suppress M1 polarization while enhancing M2 polarization, attenuate the secretion or infiltration of proinflammatory cytokines, inhibit HSC activation, induce the quiescence of activated HSCs, prevent excessive ECM deposition, and facilitate ECM degradation. The released PtNZs could transform or deplete ROS and generate O2.
Figure 1
Figure 1
Fabrication, characterization, and property of SecNPs. a) Reactome enrichment based on label‐free proteome analysis of secretome derived from hUCMSCs. b–d) Heatmap displaying the proteins and their abundances in hUCMSC secretome involved in metabolism (b), signal transduction (c), and immune system (d). e) Schematic illustration of fabricating SecNPs. f) Hydrodynamic diameter distribution and zeta potential of SecNPs. g) Representative TEM image indicating remarkable core–shell microstructure of SecNPs. h) Representative flow cytometry histograms depicting time‐dependent uptake of SecNPs by LX2 cells. i) Representative fluorescence images and corresponding quantified 3D surface plots indicating the internalization of DiI‐labeled SecNPs by HSC‐T6 cells over various co‐incubation periods. j) Summarized time‐dependent uptake curves of SecNPs by various cells. Data are presented as mean ± standard deviation (SD), n = 3.
Figure 2
Figure 2
In vitro inhibition of liver fibrosis‐related pathological process by SecNPs. a) Schematic illustration of employing SecNPs to treat TGFβ1‐activated hepatic stellate cells (HSCs). b) Relative intracellular levels of mRNA implicated in ECM deposition (ACTA1 and COL1A1), HSC activation (FGF2, PDGFB, and END1), and ECM degradation (TIMP1 and TIMP2) evaluated using LX2 cells. c) Schematic representation of using SecNPs to treat LPS‐activated M1 macrophages. d) Relative intracellular mRNA levels of proinflammatory markers (Nos2, Tnf, and Il1b), anti‐inflammatory markers (Il10, Mrc1, and Arg1), or profibrotic marker (Tgfb1) assessed using RAW264.7 cells following the indicated treatments. e) Schematic diagram of using SecNPs to treat CCl4‐induced injured hepatocytes. f,g) Cell viabilities of AML12 (f) and LO2 (g) cells undergoing the sequential co‐incubations with CCl4 and SecNPs. h, i) Relative intracellular levels of mRNA associated with apoptosis (h, Casp3; i, CASP3) or proliferation (h, Pcna; i, PCNA) determined employing AML12 (h) and LO2 (i) cells subjected to the indicated treatments. Data are presented as mean ± SD (n = 3). Statistical significances were assessed using one‐way analysis of variance (ANOVA) followed by Tukey's multiple comparisons post hoc test. * p < 0.05; ** p < 0.01; *** p < 0.001; **** p < 0.0001; and n.s., not significant.
Figure 3
Figure 3
Synthesis, characterization, property, and in vitro hepatoprotective effect of PtNZs. a) Schematic illustration of the PtNZ synthetic process. b) Hydrodynamic diameter distribution and zeta potential of PtNZs. c) Representative TEM image of PtNZs. d) UV–vis absorption spectrum of PtNZs. e) Photothermal effect of PtNZs at various concentrations under NIR irradition. f) SOD‐mimicking activity of PtNZs manifested by the depletion of •O2 . g,h) CAT‐like activity of PtNZs evidenced by H2O2 conversion (g) and O2 generation (h). i,j) Intracellular ROS‐scavenging activity of PtNZs evaluated using representative DCF+ fluorescence images (i) accompanied by quantified 3D surface plots and representative DCF+ flow cytometry pseudo‐color plots with corresponding quantifications (j) in AML12 cells following the indicated treatments. k,l) Intracellular capability of PtNZs for catalyzing H2O2 into O2 estimated by representative [Ru(dpp)3]Cl2 + (reflecting the hypoxia level) fluorescence images (k) with quantified 3D surface plots and representative [Ru(dpp)3]Cl2 + flow cytometry pseudo‐color plots with corresponding quantifications (l) in LX2 cells undergoing the indicated treatments. Data are shown as mean ± SD (n = 3). Statistical significances were assessed by one‐way ANOVA with Tukey's multiple comparisons post hoc test. * p < 0.05; ** p < 0.01; *** p < 0.001; and n.s., not significant.
Figure 4
Figure 4
Fabrication and characterization of MN arrays. a) Schematic diagram of fabricating MN arrays with SH substrates and SPI‐PVA needle tips loaded with SecNPs, PtNZs, or NPr. b,c) Representative images of MNs in bright (b) and fluorescent (c) fields. d,e) Mechanical strength of various MNs evaluated by compressive stress‐strain curves (d) and corresponding quantified compressive moduli (e). f) Representative SEM images of MNs prior to and following the compression test. g) Representative histopathological image of H&E‐stained liver tissue post MN insertion. h) Photothermal effect of PMN arrays containing different concentrations of PtNZs under NIR irradition. i) Temperature variations of PMN arrays over three NIR irradiation on/off cycles. j) Cumulative release profiles of PSMN arrays with or without the irradiation of NIR. k) Schematic illustration of NIR‐triggered NPr activation and SPI hydrolyzation by the activated NPr. Data are presented as mean ± SD (n = 3). Statistical significances were assessed by one‐way ANOVA with Tukey's multiple comparisons post hoc test. n.s., not significant.
Figure 5
Figure 5
Rejuvenating effects of MN arrays in the liver‐fibrotic murine model. a) Schematic diagram illustrating the animal experimental procedures, including liver fibrosis murine model constructed by CCl4 intraperitoneal (i.p.) injection, treatment via in situ MN implantation followed by NIR irradiation, and sacrifice for sample harvest. b–f) Representative images for appearance (b), Sirius red staining (c), Masson's trichrome staining (d), αSMA immunofluorescence (e), and Col1a1 immunofluorescence (f) of liver tissue sections from mice undergoing the indicated treatments. g–j) Relative quantifications of Sirius red indicated fiber area (g), Masson's trichrome‐indicated fiber area (h), αSMA+ area (i), and Col1a1+ area (j) were performed based on the corresponding micrographs. k) Relative intrahepatic levels of mRNA implicated in liver fibrosis (Acta2, Col1a1, Tgfb1, and Timp2). Data are shown as mean ± SD (n = 3, panels g–j; n = 4, panel k). Statistical significances were evaluated with one‐way ANOVA followed by Tukey's multiple comparisons post hoc test. * p < 0.05; * p < 0.01; *** p < 0.001; **** p < 0.0001; and n.s., not significant.
Figure 6
Figure 6
Anti‐inflammatory and hepatoprotective effects of MN arrays in the liver‐fibrotic murine model. a–c) Representative images for H&E staining (arrows indicate immune cell infiltration) (a), iNOS immunofluorescence (b), and Arg1 immunofluorescence (c) of liver tissue sections from mice following the indicated treatments. d,e) Relative quantifications of iNOS+ area (d), and Arg1+ area (e) conducted based on the corresponding micrographs. f) Relative intrahepatic mRNA levels of proinflammatory factors (Tnf and Il1b). g–i) Intrahepatic levels of factors involved in redox homeostasis and oxidative stress, encompass GSH (g), MDA (h), and H2O2 (i). j–l) Serum levels of factors associated with liver function and dysfunction, including ALB (j), AST (k), and ALP (l). Data are presented as mean ± SD (n = 3, panels d, e, and g–i; n = 4, panel f; n = 5, panels j–l). Statistical significances were estimated employing one‐way ANOVA with Tukey's multiple comparisons post hoc test. * p < 0.05; ** p < 0.01; *** p < 0.001; **** p < 0.0001; and n.s., not significant.
Figure 7
Figure 7
Transcriptome analysis based on RNA sequencing of liver tissues from LF, normal, and PSMN+NIR groups. a,b) Similarities, dissimilarities, and gene count among all tested liver samples depicted by PCA scatter plot (a) and upset plot (b). c,d) Volcano plots illustrating significantly upregulated (Q < 0.05 and |log2FC| > 1) and significantly downregulated (Q < 0.05 and |log2FC| < 1) genes and the GOIs in DEGs between LF (F) and normal (N) groups (c), and between PSMN+NIR (treatment, T) and F groups (d). Q value = adjusted P value. e,f) Heatmaps displaying expression variations of GOIs between F group and N group (e), and between F group and T group (f). g) Sankey diagram with pathway enrichments of all GOIs among F, N, and T groups. h) PPI network of GOIs among F, N, and T groups.
Figure 8
Figure 8
Transcriptome enrichment analysis revealing mechanisms of the liver fibrosis treatment with PSMN+NIR. a,b) Enrichments of DEGs in liver samples from PSMN+NIR group and LF group in various GO terms (a) and KEGG pathways (b). c) GSEA based on Reactome enrichments indicating upregulated (p < 0.05 and NES > 1) and downregulated (p < 0.05 and NES < –1) pathways involved in ECM deposition and degradation, as well as HSC activation and quiescence.

Similar articles

Cited by

References

    1. a) Xu M., Xu H.‐H., Lin Y., Sun X., Wang L.‐J., Fang Z.‐P., Su X.‐H., Liang X.‐J., Hu Y., Liu Z.‐M., Cheng Y., Wei Y., Li J., Li L., Liu H.‐J., Cheng Z., Tang N., Peng C., Li T., Liu T., Qiao L., Wu D., Ding Y.‐Q., Zhou W.‐J., Cell 2019, 178, 1478; - PubMed
    2. b) Kisseleva T., Brenner D., Nat. Rev. Gastroenterol. Hepatol. 2021, 18, 151; - PubMed
    3. c) Zhao M., Wang L., Wang M., Zhou S., Lu Y., Cui H., Racanelli A. C., Zhang L., Ye T., Ding B., Zhang B., Yang J., Yao Y., Signal Transduct. Target. Ther. 2022, 7, 206. - PMC - PubMed
    1. a) Magdaleno F., Arriazu E., Ruiz de Galarreta M., Chen Y., Ge X., Conde de la Rosa L., Nieto N., J. Hepatol. 2016, 65, 963; - PMC - PubMed
    2. b) Zhang C., Teng Y., Li F., Ho W., Bai X., Xu X., Zhang X.‐Q., ACS Nano 2023, 17, 14852. - PubMed
    1. Nath B., Szabo G., Hepatology 2012, 55, 622. - PMC - PubMed
    1. a) Jianhua R., Hao W., Ming N., Zeng W., Ziyi W., Song W., Mu L., Peng W., Jiannan Q., Lei Z., Chen W., Hongbing S., Xuehao W., Feng C., Ling L., Gut 2022, 71, 2539; - PubMed
    2. b) Hammerich L., Tacke F., Nat. Rev. Gastroenterol. Hepatol. 2023, 20, 633. - PubMed
    1. a) Kim E. R., Park J. S., Kim J. H., Oh J. Y., Oh I. J., Choi D. H., Lee Y., Park I. S., Kim S., Lee D. H., Cheon J. H., Bae J. W., Lee M., Cho J. W., An I. B., Nam E. J., Yang S. I., Lee M. S., Bae S. H., Lee Y. h., Hepatology 2022, 75, 1523; - PubMed
    2. b) Sharma S., Guillou D. L., Chen J. Y., Nat. Rev. Gastroenterol. Hepatol. 2023, 20, 662. - PubMed

LinkOut - more resources