Review
. 2025 Jul 8;31(4):285-294.
doi: 10.4274/dir.2024.242826. Epub 2024 Jun 14.

Tumor-like conditions that mimic liver tumors

Affiliations
Review

Tumor-like conditions that mimic liver tumors

Nir Stanietzky et al. Diagn Interv Radiol. .

Abstract

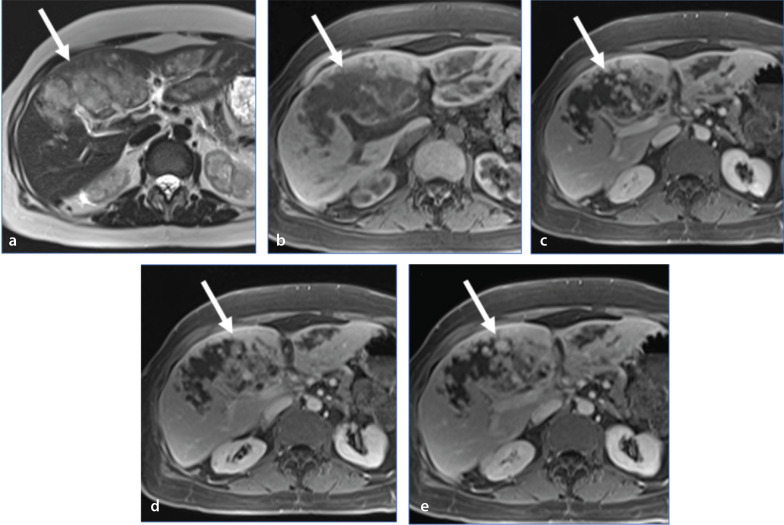
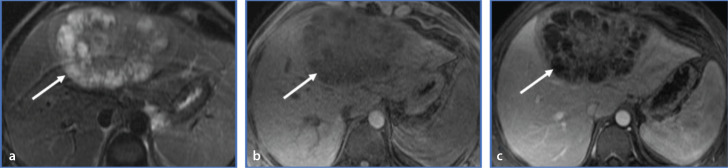
Non-neoplastic tumor-like conditions of the liver can appear similar to hepatic neoplasms. In many cases, a biopsy is required to confirm the pathology. However, several tumor-like conditions can be correctly diagnosed or suggested prospectively, thus saving patients from unnecessary anxiety and expense. In this image-focused review, we present the ultrasound, computed tomography, magnetic resonance imaging, and positron emission tomography scan features of eight such entities. Clues that indicate the correct pathology are discussed, and the usual clinical setting is described. Many of these lesions are treated differently from true neoplasms, and the current treatment plan is discussed in many of the cases presented. After reviewing this article, the reader will have a better understanding of these lesions and the situations in which they should be included in the differential diagnosis.

Keywords: Benign hepatic lesion; hepatic amyloidosis; hepatic extramedullary hematopoiesis; hepatic pseudotumor; hepatic sarcoidosis; hepatic tumor mimics; hepatic tumor-like conditions; hepatobiliary tuberculomas; liver imaging; mesenchymal hamartoma; myofibroblastoma; peliosis hepatis.


Conflict of interest statement

The authors declared no conflicts of interest.

Figures

Figure 1
Figure 1
Grayscale ultrasound scan (a) showing a complex cystic mass with a solid component (white arrow). Non-enhanced computed tomography images (b, c) showing a mass in the right hepatic lobe (white arrows). The mass was predominantly cystic and had a central solid component. A mesenchymal hamartoma was identified through pathology.
Figure 10
Figure 10
Axial T2-weighted images (a) and dynamic post-gadolinium T1-weighted images with fat suppression (b-e) showing a large hepatic mass (long arrows) spanning both lobes of the liver and demonstrating high T2 signal intensity, low T1 signal intensity, and progressive centripetal enhancement following contrast administration. The lesion represents a biopsy-verified peliosis hepatis that was not present 3 years earlier. Despite its large size, no appreciable mass effect was identified. Vessels are observed coursing through the lesion without significant attenuation.
Figure 11
Figure 11
Contrast-enhanced computed tomography (CECT) images from a patient with a long history of pulmonary sarcoidosis. (a) Initial CECT image showing multiple subtle hypodense hepatic (red arrows) and splenic (green arrows) lesions. CECT image from the same patient obtained 5 years after the initial scan (b) showing extensive periportal and bridging non-enhancing fibrous septa throughout the liver (black arrows) with periportal predominance. Note the interval increase in the multiple hypoattenuating splenic lesions (green arrow).
Figure 12
Figure 12
Axial T2-weighted image with fat suppression (a), axial T1-weighted opposed-phase image (b), axial T1-weighted late-arterial-phase image with fat suppression (c), and axial T1-weighted portal-venous-phase image with fat suppression (d) in a patient with sarcoidosis showing periportal masses (white arrows), demonstrating slightly increased signal intensity and poor enhancement during the late arterial phase. The areas of abnormal signaling were not identified during the portal venous phase. There is also evidence of splenic involvement with splenomegaly and multiple small granulomas.
Figure 13
Figure 13
Transabdominal ultrasound scan (a) showing an echogenic mass-like structure (white arrows) with posterior shadowing caused by calcifications. Contrast-enhanced computed tomography scan (b) showing a mass-like structure (white arrows) within the right hepatic lobe related to extensive calcifications. The patient was diagnosed with hepatic amyloidosis.
Figure 2
Figure 2
Grayscale ultrasound scan (a) showing a mixed solid and cystic mesenchymal hamartoma (white arrow) arising from the inferior aspect of the liver (L). Coronal (b) and axial (c) T2-weighted images showing a complex cystic mass with internal septations (white arrows).
Figure 3
Figure 3
Axial contrast-enhanced computed tomography scans of a myofibroblastoma taken during the arterial (a), portal venous (b), and delayed (c) phases with a mass in the left hepatic lobe (white arrows), demonstrating poor enhancement during the arterial and portal phases and heterogeneous internal delayed enhancement during the delayed phase. Color Doppler ultrasound images (d) showing a multilobulated mass with an echogenic center, hypoechoic periphery, and minimal internal blood flow.
Figure 4
Figure 4
Additional case of a biopsy-verified myofibroblastoma. Axial T2-weighted image (a), pre-contrast T1-weighted image (b), and post-gadolinium T1-weighted image with fat suppression (c) revealing a multiloculated solid and cystic mass (white arrows) with numerous small T2-bright peripheral components and a more solid central portion that is mildly hyperintense on the T2-weighted image and mildly hypointense on the T1-weighted images. With contrast administration, septal enhancement and progressive delayed enhancement of the central component of the mass were identified.
Figure 5
Figure 5
Contrast-enhanced computed tomography (CECT) images revealing extramedullary hematopoiesis in a 61-year-old woman with myelodysplastic syndrome. Axial CECT image (a) at the level of the lower chest showing paravertebral masses (red arrows). Axial CECT image (b) through the upper abdomen showing hepatic (green arrow) and splenic (white arrow) rounded hypoattenuating masses and periportal poorly enhancing tissue (red arrows).
Figure 6
Figure 6
Axial T1-weighted image (a), axial T2-weighted image with fat suppression (b), coronal T2-weighted image (c), and axial T1-weighted image with fat suppression in the late arterial phase (d) in a 56-year-old woman with extramedullary hematopoiesis and myelofibrosis showing periportal masses (white arrows), demonstrating low signal intensity on the T1-weighted images, high signal intensity in the T2-weighted images, and progressive enhancement after contrast administration.
Figure 7
Figure 7
Images from a 26-year-old woman with stage IVb monomorphic posttransplant lymphoproliferative disorder involving the bones and lymph nodes. The patient presented with a slowly growing liver mass identified as an Epstein–Barr virus-associated smooth muscle tumor. Axial T2-weighted images (a) and three dynamic gadolinium-enhanced T1-weighted images with fat suppression (b) showing a small T2-hyperintense lesion in the left hepatic lobe (arrows). The lesion exhibits early peripheral enhancement and some delayed fill-in of contrast material with persistent peripheral enhancement. Axial (c) and coronal (d) contrast-enhanced computed tomography images obtained 15 months later showing a mild increase in lesion size (arrows). Peripheral enhancement was observed, and the center of the lesion had an attenuation of approximately 15 HU. An axial positron emission tomography/computed tomography scan (e) showing the lesion’s increased metabolic activity (standardized uptake value: 3.87). HU, Hounsfield units
Figure 8
Figure 8
Transabdominal ultrasound scan (a) showing a heterogeneously echogenic lesion (arrow) with a peripheral rim of increased echogenicity. Axial unenhanced computed tomography images (b, c) showing multiple calcified lesions (arrows). Some of the lesions have a target-like appearance, with central and peripheral calcifications separated by a zone of soft-tissue attenuation. This was a biopsy-verified tuberculoma.
Figure 9
Figure 9
Biopsy-verified tuberculoma with a history of AIDS and disseminated tuberculosis. Axial unenhanced (a) and contrast-enhanced (b) computed tomography images demonstrating a lesion in the right hepatic lobe (arrows). The unenhanced image shows central high attenuation, a peripheral rim of low attenuation, and an incomplete ring of calcification. No enhancement was identified after contrast administration.

References

    1. Stringer MD, Alizai NK. Mesenchymal hamartoma of the liver: a systematic review. J Pediatr Surg. 2005;40(11):1681–1690. doi: 10.1016/j.jpedsurg.2005.07.052. - DOI - PubMed
    1. Assarzadegan N, Montgomery E. Uncommon benign neoplasms and pseudotumors of the liver. Arch Pathol Lab Med. 2023;147(4):390–402. doi: 10.5858/arpa.2021-0539-RA. - DOI - PMC - PubMed
    1. Kim SH, Kim WS, Cheon JE, et al. Radiological spectrum of hepatic mesenchymal hamartoma in children. Korean J Radiol. 2007;8(6):498–505. doi: 10.3348/kjr.2007.8.6.498. - DOI - PMC - PubMed
    1. Papke DJ Jr. Mesenchymal neoplasms of the liver. Surg Pathol Clin. 2023;16(3):609–634. doi: 10.1016/j.path.2023.04.013. - DOI - PubMed
    1. Wang D, Misdraji J. Inflammatory pseudotumor of the liver. Surg Pathol Clin. 2023;16(3):565–580. doi: 10.1016/j.path.2023.04.010. - DOI - PubMed

LinkOut - more resources