. 2024 Aug;11(30):e2402477.
doi: 10.1002/advs.202402477. Epub 2024 Jun 14.

Zwitterion-Lubricated Hydrogel Microspheres Encapsulated with Metformin Ameliorate Age-Associated Osteoarthritis

Affiliations

Zwitterion-Lubricated Hydrogel Microspheres Encapsulated with Metformin Ameliorate Age-Associated Osteoarthritis

Jiahui Hou et al. Adv Sci (Weinh). 2024 Aug.

Abstract

Chondrocyte senescence and reduced lubrication play pivotal roles in the pathogenesis of age-related osteoarthritis (OA). In the present study, highly lubricated and drug-loaded hydrogel microspheres are designed and fabricated through the radical polymerization of sulfobetaine (SB)-modified hyaluronic acid methacrylate using microfluidic technology. The copolymer contains a large number of SB and carboxyl groups that can provide a high degree of lubrication through hydration and form electrostatic loading interactions with metformin (Met@SBHA), producing a high drug load for anti-chondrocyte senescence. Mechanical, tribological, and drug release analyses demonstrated enhanced lubricative properties and prolonged drug dissemination of the Met@SBHA microspheres. RNA sequencing (RNA-seq) analysis, network pharmacology, and in vitro assays revealed the extraordinary capacity of Met@SBHA to combat chondrocyte senescence. Additionally, inducible nitric oxide synthase (iNOS) has been identified as a promising protein modulated by Met in senescent chondrocytes, thereby exerting a significant influence on the iNOS/ONOO-/P53 pathway. Notably, the intra-articular administration of Met@SBHA in aged mice ameliorated cartilage senescence and OA pathogenesis. Based on the findings of this study, Met@SBHA emerges as an innovative and promising strategy in tackling age-related OA serving the dual function of enhancing joint lubrication and mitigating cartilage senescence.

Keywords: age‐related osteoarthritis; cellular senescence; iNOS; lubrication; metformin.


Conflict of interest statement

The authors declare no conflict of interest.

Figures
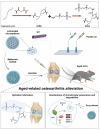
Figure 1
Figure 1
The principle and fabrication of Met@SBHA. A) Synthesis process of SBHA. B) Preparation of Met@SBHA by microfluidic device and photopolymerization process and intra‐articular injection. C) Mechanistic map of the mechanism of alleviating chondrocyte senescence and increasing hydrated lubrication to ameliorate age‐related osteoarthritis. The schematic illustration was created by BioRender.com.
Figure 2
Figure 2
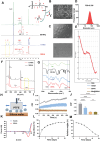
Preparation and characterization of Met@SBHA hydrogel microspheres. A) 1H NMR spectrum of hydrogel microspheres composition. B) Electron microscopy of hydrogel microspheres. Scale bars: 500 nm. C) Bright‐field plots of dispersed (Scale bars: 500 µm) and individual hydrogel microspheres (Scale bars: 25 µm) under optical microscope. D) Particle size distributions of hydrogel microspheres. E) Phase analysis light scattering pattern for the analysis of zeta potential. F) X‐ray photoelectron spectroscopy (XPS) of HAMA and SBHA. G) Fourier Transform Infrared Spectroscopy (FTIR) spectroscopy of HA, SB‐NH2, HAMA SBHA. H) Friction test diagram. I) COF‐time curves. J) COF histograms for PBS, HAMA, SBHA and Met@SBHA. K) Force‐displacement curves for HAMA and SBHA. L) Drug release profile of Met@SBHA. M) Degradation curve of Met@SBHA. Number of repetitions of all experiments n ≥ 3. Data are presented as the mean ± SD. (*P < 0.05; **P < 0.01; ***P < 0.001 and ****P < 0.0001).
Figure 3
Figure 3
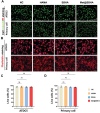
In vitro assessment of the cytotoxicity and cytocompatibility of Met@SBHA. A) The live/dead staining of ATDC5 cell line and primary chondrocytes after 24 h co‐culture with different hydrogel microspheres (HAMA, SBHA and Met@SBHA). Scale bars: 500 µm. B) Cytoskeleton staining images of cells co‐cultured with different hydrogel microspheres. Scale bars: 500 µm. C, D) Quantitative analysis of the live/dead staining. Number of repetitions of all experiments n ≥ 3. Data are presented as the mean ± SD. (*P < 0.05; **P < 0.01; ***P < 0.001 and ****P <0.0001).
Figure 4
Figure 4
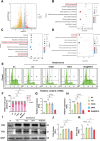
Met@SBHA alleviates chondrocyte senescence in vitro. A) Volcano plot of the distribution of differentially expressed genes (DEGs). B) Reactome enrichment analysis of DEGs. C) GO enrichment analysis of DEGs. D) KEGG enrichment analysis of DEGs. E) Distribution plot of the DNA content of the cell cycle analyzed by flow cytometry (FCM). F) Statistical plots of the quantitative analysis of the cell cycle analyzed by flow cytometry (FCM). G,H) RT‐PCR results showing the relative mRNA expression levels of P53 and P21. I–K) Representative immunoblot analysis and quantification of P53 and P21 protein expression in treated chondrocytes. The subgroups are as follows: NC group = normal cells; Ctrl group = senescent cells without any treatment; HAMA group = senescence cells treated with hyaluronic acid methacrylate microspheres; SBHA group = senescence cells treated with sulfobetaine (SB)‐lubricated HAMA microspheres; Met@SBHA group = senescence cells treated with metformin‐encapsulated SBHA microspheres. Number of repetitions of all experiments n ≥ 3. Data are presented as the mean ± SD. (*P < 0.05; **P < 0.01; ***P < 0.001 and ****P <0.0001).
Figure 5
Figure 5
Met@SBHA alleviates chondrocyte senescence in vitro. A) SA‐β galactosidase staining of ATDC5 cell line (Scale bars: 100 µm) and primary chondrocytes (Scale bars: 500 µm). B,C) Immunofluorescence staining of P21 and P53 in ATDC5 cell line and primary chondrocytes. Scale bars: 500 µm. D) Edu staining of ATDC5 cell line and primary chondrocytes. Scale bars: 500 µm. E–L) Statistical quantification of the SA‐β‐gal‐positive chondrocytes, P21 and P53 positive expression cells, and EdU positive cells in ATDC5 chondrocyte cell line and primary chondrocytes separately. Number of repetitions of all experiments n ≥ 3. Data are presented as the mean ± SD. (*P < 0.05; **P < 0.01; ***P < 0.001 and ****P <0.0001).
Figure 6
Figure 6
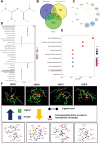
Network pharmacological analyses and molecular docking reveal NOS2 (iNOS) as target gene for the regulatory effects of Met over senescence. A) 2D molecular structure of Met. B) Venn diagram of the intersection of osteoarthritis, senescence, and Met‐associated genes. C) Protein‐Protein Interaction (PPI) networks reveals 12 core gene targets. D) GO analysis of core gene targets. E) KEGG analysis of core gene targets. F) The binding site and site‐preceding interactions of Met and pre‐4 hub proteins (NOS2, NOS1, NOS3, and EGFR).
Figure 7
Figure 7
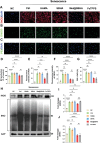
Met@SBHA attenuates chondrocyte senescence by affecting the iNOS/ONOO‐/P53 pathway. A) Immunofluorescent staining of iNOS in primary chondrocytes (Scale bars: 500 µm). B) Expression of fluorescent probe‐labelled peroxynitrite (ONOO‐) in chondrocytes. (Scale bars: 500 µm). C) Immunofluorescent staining of P53 in primary chondrocytes (Scale bars: 500 µm). D) Quantitative analysis of NO production in the supernatants of each cell group. E) Quantitative analysis of iNOS fluorescence intensity. F) Quantitative analysis of the fluorescence intensity of ONOO‐. G) Quantitative analysis of the percentage of P53 positive expression cells. H–J) Representative immunoblot analysis and quantification of iNOS and S‐nitrosylated proteins expression. NC = normal cells; Ctrl = senescent cells without any treatment; HAMA = senescence cells treated with HAMA; SBHA = senescence cells treated with SBHA; Met@SBHA = senescence cells treated with Met@SBHA; FeTPPS = senescence cells treated with FeTPPS. Number of repetitions of all experiments n ≥ 3. Data are presented as the mean ± SD. (*P < 0.05; **P < 0.01; ***P < 0.001 and ****P <0.0001).
Figure 8
Figure 8
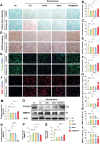
Met@SBHA coordinates the metabolic homeostasis of chondrocytes in vitro. A–C) Alcian blue staining and its quantitative analysis of ATDC5 cell line and primary chondrocytes (Scale bars: 500 µm). D–F) Safranin O‐Fast Green staining and its quantitative analysis of ATDC5 cell line and primary chondrocytes (Scale bars: 500 µm). G–I) Immunofluorescence staining and its quantitative analysis of COL2A1 in ATDC5 cell line and primary chondrocytes (Scale bars: 500 µm). J–L) Immunofluorescence staining and its quantitative analysis of MMP13 in ATDC5 cell line and primary chondrocytes (Scale bars: 500 µm). M,N) Relative mRNA expression levels of COL2A1 and MMP13. P,Q) Representative immunoblot analysis and quantification of COL2A1 and MMP13 protein expression in NC group, Ctrl group, HAMA‐treated chondrocytes group, SBHA‐treated chondrocytes group, and Met@SBHA‐treated chondrocytes group. Number of repetitions of all experiments n ≥ 3. Data are presented as the mean ± SD. (*P < 0.05; **P < 0.01; ***P < 0.001 and ****P <0.0001).
Figure 9
Figure 9
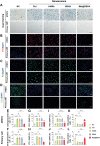
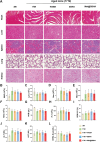
In vivo biocompatibility and biosafety of Met@SBHA. A) Staining of HE sections of mouse heart, liver, kidney and lung in mice at the age of 3 months (3 M group), mice at the age of 17 months (17 M group), 17‐month mice treated with HAMA (HAMA group), 17‐month mice treated with SBHA (SBHA group), 17‐month mice treated with Met@SBHA (Met@SBHA group). Scale bar 100 µm. B–L) Serum levels of biomarkers reflecting liver and kidney function and hematological parameters in mice. Number of repetitions of all experiments n = 6. Data are presented as the mean ± SD. (*P < 0.05; **P < 0.01; ***P < 0.001 and ****P <0.0001).
Figure 10
Figure 10
Met@SBHA attenuates the aging process of cartilage in aged mice. A) SA‐β galactosidase staining of the cartilage layer in 3 M group, 17 M group, 17M+HAMA group, 17M+SBHA group, and 17M+Met@SBHA group. Scale bar 100 µm. B) Immunofluorescence staining to detect the expression of P21 in the cartilage layer in 3 M, 17 M, HAMA group, SBHA group, and Met@SBHA group. Scale bar 100 µm. C) Immunofluorescence staining of P53 in cartilage layers. Scale bar 100 µm. D–F) Quantitative analysis of the percentage of SA‐β‐gal‐positive chondrocytes, P21‐positive expressing cells and P53‐positive expressing cells in cartilage layer. Number of repetitions of all experiments n ≥ 3. Data are presented as the mean ± SD. (*P < 0.05; **P < 0.01; ***P < 0.001 and ****P <0.0001).
Figure 11
Figure 11
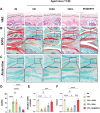
Met@SBHA alleviates effectively cartilage degeneration in age‐related osteoarthritis A) Representative images of HE staining in 3 M group, 17 M group, 17M+HAMA group, 17M+SBHA group, and 17M+Met@SBHA group. Scale bar: 100 µm. B) Safranin O‐fast green staining (upper panel) with enlarged area in the upper box of the subchondral bone area (middle panel). Scale bar: top 100 µm; bottom 50 µm. C) Alcian blue staining in each group. Scale bar: top 100 µm; bottom 50 µm. D) OARSI score of each group; n = 6 E) Quantitative analysis of relative glycosaminoglycan (GAG) content. F) The ratio of hyaline cartilage (HC) and calcified cartilage (CC) of articular cartilage. Number of repetitions of all experiments n ≥ 3. Data are presented as the mean ± SD. (*P < 0.05; **P < 0.01; ***P < 0.001 and ****P <0.0001).
Figure 12
Figure 12
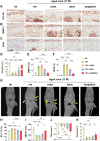
Met@SBHA attenuates the pathogenesis of age‐associated OA. A, B) Immunohistochemical staining for MMP13 and COL2A1 for assessing the metabolic balance of cartilage. Scale bar 100 µm. C) Immunohistochemical staining of the screened target protein iNOS. Scale bar 100 µm. D, F) Quantitative analysis of immunohistochemical staining of MMP13, COL2A1, and iNOS. G) Micro‐CT images of medial subchondral bone. Scale bar: 500 µm. H–K) Quantitative analysis of BV/TV (bone tissue relative to the total tissue volume), SBP.th (Subchondral Bone Plate thickness), Tb.pf (trabecular pattern factor) and Tb.Th (trabecular thickness) in the subchondral bone of 3 M group, 17 M group, 17M+HAMA group, 17M+SBHA group, and 17M+Met@SBHA group. Number of repetitions of all experiments n ≥ 3. Data are presented as the mean ± SD. (*P < 0.05; **P < 0.01; ***P < 0.001 and ****P <0.0001).

Similar articles

Cited by

References

    1. Coryell P. R., Diekman B. O., Loeser R. F., Nat. Rev. Rheumatol. 2021, 17, 47. - PMC - PubMed
    1. Sharma L., N. Engl. J. Med. 2021, 384, 51. - PubMed
    1. Kloppenburg M., Berenbaum F., Osteoarthr. Cartil. 2020, 28, 242. - PubMed
    1. Wang Y., Zhao X., Liu‐Bryan R., Osteoarthr. Cartil. 2020, 28, 669. - PMC - PubMed
    1. Chen X., Gong W., Shao X., Shi T., Zhang L., Dong J., Shi Y., Shen S., Qin J., Jiang Q., Guo B., Ann. Rheum. Dis. 2022, 81, 87. - PubMed

LinkOut - more resources