

Four-hour-delayed 3D-FLAIR MRIs in patients with acute unilateral peripheral vestibulopathy
- PMID: 38874375
- PMCID: PMC11330212
- DOI: 10.1002/acn3.52123
Four-hour-delayed 3D-FLAIR MRIs in patients with acute unilateral peripheral vestibulopathy
Abstract
Objective: Conventionally, MRI aids in differentiating acute unilateral peripheral vestibulopathy/vestibular neuritis (AUPV/VN) from mimickers. Meanwhile, the diagnostic utility of MRIs dedicated to the inner ear remains to be elucidated for diagnosing AUPV/VN.
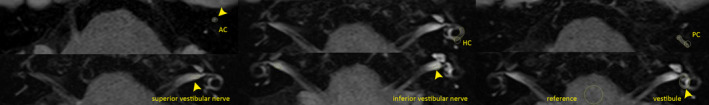
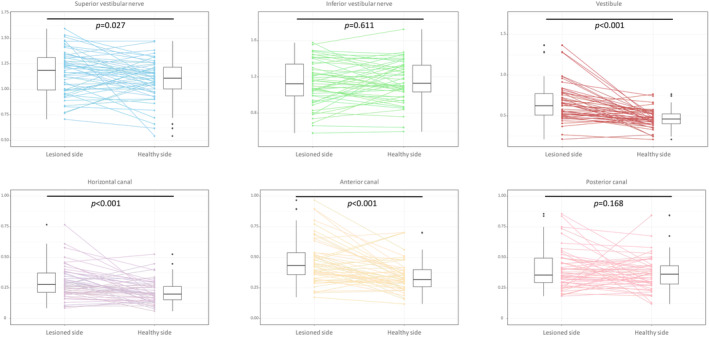
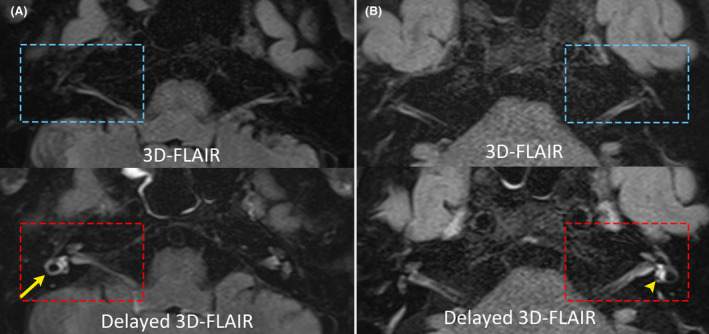
Methods: We prospectively recruited 53 patients with AUPV/VN (mean age ± SD = 60 ± 15 years, 29 men). Initial MRIs were performed with a standard protocol, and an additional axial 3D-fluid-attenuated inversion recovery (3D-FLAIR) sequence was obtained 4 h after intravenous injection of gadoterate meglumine. Abnormal enhancement was defined as a signal intensity that exceeded the mean + 2SD value on the healthy side. The findings of neurotologic evaluation and MRIs were compared.
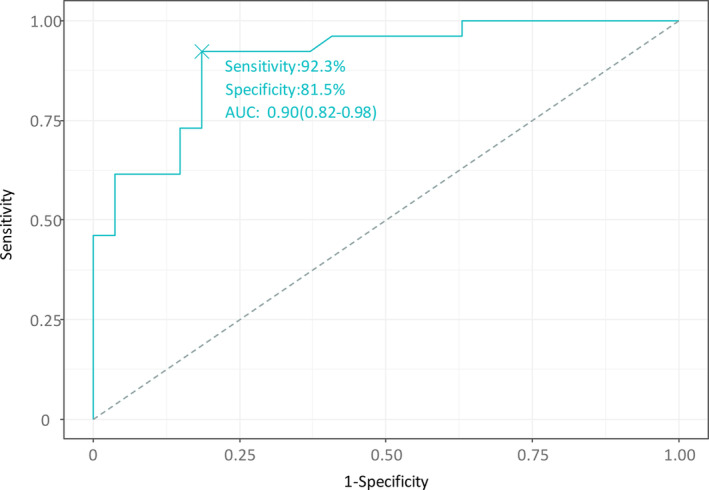
Results: Overall, the inter-rater agreement for gadolinium enhancement was 0.886 (Cohen's kappa coefficient). Enhancement was observed in 26 patients (49%), most frequently in the vestibule (n = 20), followed by the anterior (n = 12), horizontal (HC, n = 8), posterior canal (n = 5), and superior (n = 3) and inferior (n = 1) vestibular nerves. In multivariable logistic regression analysis, the enhancement was associated with decreased HC gain in video head-impulse tests (p = 0.036), increased interaural difference in ocular vestibular-evoked myogenic potentials (p = 0.001), and a longer onset-to-MRI time span (p = 0.024). The sensitivity and specificity were 92.3% and 81.5%, respectively, with an area under the curve of 0.90 for predicting gadolinium enhancement.
Interpretation: Robust gadolinium enhancement was observed on 4-hour-delayed 3D-FLAIR images in nearly half of the patients with AUPV/VN, with a good correlation with the results of neurotologic evaluation. The positivity may be determined by the extent of vestibular deficit, timing of imaging acquisition, and possibly by the underlying etiology causing AUPV/VN. MRIs may aid in delineating the involved structures in AUPV/VN.
© 2024 The Author(s). Annals of Clinical and Translational Neurology published by Wiley Periodicals LLC on behalf of American Neurological Association.
Conflict of interest statement
Drs. K.T. Kim, S. Park, E. Park, and Byungjun Kim report no disclosures. Byung‐Jo Kim serves as an Editor‐in‐Chief of the
Figures
References
-
- Baloh RW. Vestibular neuritis. New Eng J Med. 2003;348:1027‐1032. - PubMed
-
- Strupp M, Jäger L, Müller‐Lisse U, Arbusow V, Reiser M, Brandt T. High resolution Gd‐DTPA MR imaging of the inner ear in 60 patients with idiopathic vestibular neuritis: no evidence for contrast enhancement of the labyrinth or vestibular nerve. J Vestib Res. 1998;8:427‐433. - PubMed
-
- Nakashima T, Naganawa S, Sugiura M, et al. Visualization of endolymphatic hydrops in patients with Meniere's disease. Laryngoscope. 2007;117:415‐420. - PubMed
-
- Karlberg M, Annertz M, Magnusson M. Acute vestibular neuritis visualized by 3‐T magnetic resonance imaging with high‐dose gadolinium. Arch Otolaryngol Head Neck Surg. 2004;130:229‐232. - PubMed
MeSH terms
Substances
Grants and funding
LinkOut - more resources
Full Text Sources
Medical