. 2024 Aug;11(30):e2402557.
doi: 10.1002/advs.202402557. Epub 2024 Jun 14.

Controlling Pericellular Oxygen Tension in Cell Culture Reveals Distinct Breast Cancer Responses to Low Oxygen Tensions

Affiliations

Controlling Pericellular Oxygen Tension in Cell Culture Reveals Distinct Breast Cancer Responses to Low Oxygen Tensions

Zachary J Rogers et al. Adv Sci (Weinh). 2024 Aug.

Abstract

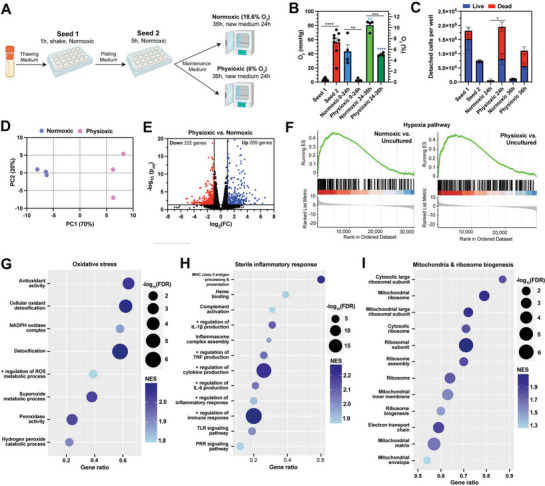
In oxygen (O2)-controlled cell culture, an indispensable tool in biological research, it is presumed that the incubator setpoint equals the O2 tension experienced by cells (i.e., pericellular O2). However, it is discovered that physioxic (5% O2) and hypoxic (1% O2) setpoints regularly induce anoxic (0% O2) pericellular tensions in both adherent and suspension cell cultures. Electron transport chain inhibition ablates this effect, indicating that cellular O2 consumption is the driving factor. RNA-seq analysis revealed that primary human hepatocytes cultured in physioxia experience ischemia-reperfusion injury due to cellular O2 consumption. A reaction-diffusion model is developed to predict pericellular O2 tension a priori, demonstrating that the effect of cellular O2 consumption has the greatest impact in smaller volume culture vessels. By controlling pericellular O2 tension in cell culture, it is found that hypoxia vs. anoxia induce distinct breast cancer transcriptomic and translational responses, including modulation of the hypoxia-inducible factor (HIF) pathway and metabolic reprogramming. Collectively, these findings indicate that breast cancer cells respond non-monotonically to low O2, suggesting that anoxic cell culture is not suitable for modeling hypoxia. Furthermore, it is shown that controlling atmospheric O2 tension in cell culture incubators is insufficient to regulate O2 in cell culture, thus introducing the concept of pericellular O2-controlled cell culture.

Keywords: anoxia; breast cancer; cancer metabolism; cell culture; hypoxia; hypoxia‐inducible factors; oxygen; physioxia.


Conflict of interest statement

The authors declare no conflict of interest.

Figures

Figure 1
Figure 1
Cell culture parameters influence HIF stabilization kinetics in hypoxic (1% O2) culture. A) O2 kinetics (left) and time to 1% O2 (right) of normoxic media (EMEM + 10% FBS + 1% P/S) placed in a 1% O2 incubator. B) O2 kinetics (left) and time to 10% O2 (right) of 1% O2 media placed into different culture vessels under normoxia. C) O2 kinetics of MCF7 cultures with varying cell densities (left), medium volumes (middle), and culture vessel type (right) placed in a 1% O2 incubator. D) Time to 1% O2 from (C). E) Average fluorescence (Image‐iTTM Hypoxia) per cell (left) and representative confocal images at 4 h (right) for MCF7 cultures (60mm dish) with 5 or 15 mL of media placed in a 1% O2 chamber. Red = Image‐iTTM Hypoxia as an indicator of cellular hypoxia. F) Percentage of GFP+ cells (left) and representative confocal images at 3 days (right) from MCF7 HIF reporter cells cultured at 7,000 or 29,000 cells cm−2 for 4 days in a 1% O2 incubator. Blue = nuclei stained with DAPI, Green = GFP+ (HIF+) cells. G) Percentage of GFP+ cells (left), GFP mean fluorescence intensity (MFI) (middle), and representative contour plots with outliers (right) for MDA‐MB‐231 HIF reporter cells cultured in a 24‐well plate or T25 flask for up to 5 days in a 1% O2 incubator. Data were analyzed with ANOVA and Geisser‐Greenhouse (E) or Bonferroni (F‐G) corrections. N = 3–4 biological replicates per condition.
Figure 2
Figure 2
Cellular O2 consumption regularly induces anoxia (0% O2) in both physioxic (5% O2) and hypoxic (1% O2) culture. A,B) O2 profiles (left) and average O2 tension values (right) of media, human mammary epithelial, MCF7, or MDA‐MB‐231 cultures seeded onto a 24‐well plate in a 5% O2 (A) or 1% O2 (B) incubator for 72 h. C) O2 profiles (left) and average O2 tension values (right) of human dendritic cell (DC) 96‐well cultures in a 5% or 1% O2 incubator for 72 h. D) O2 kinetics of media (green) or MDA‐MBA‐231 cultures (blue) of the top (dark) or bottom (light) of the well in a 1% O2 incubator. E) O2 profiles of MDA‐MB‐231 cultures were measured at the bottom of the well (spot) or 1mm above the bottom of the well (needle) in a 1% O2 incubator. F) Effect of sodium azide (NaN3) on MCF7 pericellular O2 tension and cytotoxicity. O2 profiles (left) and average O2 tension values (middle) of MCF7 cultures spiked with either 5 mM NaN3 or PBS in a 1% O2 incubator. MCF7 cell viability after ± incubation with 5 mm NaN3 for 6 h in a 1% O2 incubator (right). G) Average O2 tension values of media and MCF7 cultures with different cell densities and culture vessel types in a 5% O2 (left) or 1% O2 incubator (right) for 72 h. H) Live, attached (left), and detached (right) cell counts for MCF7 cultures in an 18.6%, 5%, or 1% O2 incubator for 6 days. Data were analyzed with two‐tailed t‐test (F) or ANOVA and Dunnett's (A‐B) or Tukey's (C, F, G, H) corrections. N = 3–4 biological replicates per condition. Colored * indicates comparison to the control.
Figure 3
Figure 3
Setting the incubator to physiological O2 conditions mimics ischemia‐reperfusion injury in human hepatocyte culture. A) Schematic of the primary human hepatocyte culture. RNA‐seq was performed on uncultured hepatocytes and cells cultured in normoxic (18.6% O2) or physioxic (6% O2) incubator after 36 h. The physioxic setpoint was chosen based on the O2 tension found in the human liver parenchyma.[ 17 ] B,C) Average O2 tension values (B) and detached cells per well (C) during each step of the culturing process. D) Principal component analysis (PCA) of the RNA‐seq results for normoxic and physioxic cultured hepatocytes. E) Volcano plot indicating upregulated (blue) and downregulated (red) genes for physioxic vs. normoxic cultured hepatocytes (padj < 0.05 and |log2FC| ≥ 1). F) Hypoxia gene set enrichment analysis (GSEA) from the Hallmark database for normoxic vs. uncultured (left) and physioxic vs. uncultured (right). G–I) Enriched pathways from the Gene Ontology (GO) database for physioxic vs. normoxic samples associated with oxidative stress (G), sterile inflammatory response (H), and mitochondrial and ribosomal biogenesis (I). Data were analyzed with ANOVA and Tukey's correction (B,C). N = 3 biological samples per condition for RNA seq analysis.
Figure 4
Figure 4
Developing a reaction‐diffusion model to predict pericellular O2 tension in cell cultures. A) Numerical (num) (dashed) and experimental (exp) (solid) O2 kinetics of normoxic media (EMEM + 10% FBS + 1% P/S) in different culture vessels placed in a 1% O2 incubator. B) Diffusion model predictions for different volumes of normoxic media in a 6‐well plate (left) or a 24‐well plate (right) placed in a 1% O2 incubator. C) Numerical and experimental O2 kinetics of MDA‐MB‐231 cultures seeded in a 24‐well plate placed in a 1%, 4%, 6%, or 8% O2 incubator for 48 h. These setpoints were selected to test and validate the reaction‐diffusion model. D) Reaction‐diffusion model predictions of the gradient within MDA‐MB‐231 cultures seeded in a 24‐well plate in a 5% O2 (left) or 1% O2 (right) incubator. E) Reaction‐diffusion model predictions of MDA‐MB‐231 cells cultured at different cell densities and culture vessel types in a 5% O2 incubator. N = 4 biological replicates per condition for experimental data.
Figure 5
Figure 5
Pericellular anoxia induces stronger metabolic reprogramming and distinct transcriptional HIFA and HRE‐controlled gene responses compared to pericellular hypoxia in MCF7 cells. A) Average pericellular O2 tensions in MCF7 cultures placed in 18.6%, 4.5%, and 1% O2 incubators for 72 h. B–E) Extracellular concentrations of glucose B), glutamine C), lactate D), and glutamate E) in different O2 tensions for 72 h. Normalized metabolite concentrations over time (left) and metabolite consumption or production rates for 72 h (right). F–I) Gene expression levels of genes associated with the hypoxic response F), metabolic reprogramming (G), autophagy H), and immunosuppression I) in different O2 tensions for 72 h. Data were analyzed using ANOVA with Tukey's correction. N = 4 biological samples per condition. Color code for asterisk (*): Red colored * indicates a comparison to control (normoxia), and blue colored * indicates a comparison between hypoxia and anoxia.
Figure 6
Figure 6
Proteomic characterization of pericellular hypoxic and anoxic metabolic reprogramming in 4T1 cells. A) Protein set enrichment analysis (PSEA) using the Hallmark database of mRNA processing and protein translation pathways for Hypoxia (H) vs. Normoxia (N), Anoxia (A) vs. Normoxia, and Hypoxia vs. Anoxia. B) PSEA using the Hallmark database of hypoxic response pathways (left). Heat maps of selected proteins in Hallmark hypoxia, epithelial to mesenchymal transition (EMT), and reactive O2 species (ROS) pathways (right) (Hypoxia vs. Anoxia). C) Heat map of glycolytic and hypoxic response proteins. D) PSEA using Reactome database for fatty acid (FA) metabolism pathways for Hypoxia vs. Anoxia (top). Heat maps of selected proteins in fatty acid β‐oxidation and synthesis Reactome pathways (bottom). E) Heat maps of selected proteins from Tricarboxylic acid (TCA) cycle and electron transport chain (ETC) processes for Hypoxia vs. Normoxia and Anoxia vs. Normoxia. PSEA using the Reactome database of TCA and ETC pathways for Hypoxia vs. Normoxia, Anoxia vs. Normoxia (left), and Hypoxia vs. Anoxia (right). F) Illustration of findings between normoxic, hypoxic, and anoxic 4T1 responses. NES = normalized enrichment score.

Update of

Similar articles

Cited by

  • Breaking barriers: Smart vaccine platforms for cancer immunomodulation.
    Gomari MM, Ghantabpour T, Pourgholam N, Rostami N, Hatfield SM, Namazifar F, Abkhiz S, Eslami SS, Ramezanpour M, Darestanifarahani M, Astsaturov I, Bencherif SA. Gomari MM, et al. Cancer Commun (Lond). 2025 May;45(5):529-571. doi: 10.1002/cac2.70002. Epub 2025 Feb 3. Cancer Commun (Lond). 2025. PMID: 39901621 Free PMC article. Review.
  • Limited oxygen in standard cell culture alters metabolism and function of differentiated cells.
    Tan J, Virtue S, Norris DM, Conway OJ, Yang M, Bidault G, Gribben C, Lugtu F, Kamzolas I, Krycer JR, Mills RJ, Liang L, Pereira C, Dale M, Shun-Shion AS, Baird HJ, Horscroft JA, Sowton AP, Ma M, Carobbio S, Petsalaki E, Murray AJ, Gershlick DC, Nathan JA, Hudson JE, Vallier L, Fisher-Wellman KH, Frezza C, Vidal-Puig A, Fazakerley DJ. Tan J, et al. EMBO J. 2024 Jun;43(11):2127-2165. doi: 10.1038/s44318-024-00084-7. Epub 2024 Apr 5. EMBO J. 2024. PMID: 38580776 Free PMC article.

References

    1. Breslin S., O'Driscoll L., Drug Discov. Today 2013, 18, 240. - PubMed
    1. Langhans S. A., Front. in Pharmacol. 2018, 9, 6. - PMC - PubMed
    1. Wang X., Rivière I., Cancer Gene Ther. 2015, 22, 85. - PMC - PubMed
    1. Hunsberger J. G., Shupe T., Atala A., Stem Cells Transl. Med. 2018, 7, 564. - PMC - PubMed
    1. Lou J., Mooney D. J., Nat. Rev. Chem. 2022, 6, 726. - PubMed

LinkOut - more resources