. 2024 Jul 3;41(7):msae118.
doi: 10.1093/molbev/msae118.

Biases in ARG-Based Inference of Historical Population Size in Populations Experiencing Selection

Affiliations

Biases in ARG-Based Inference of Historical Population Size in Populations Experiencing Selection

Jacob I Marsh et al. Mol Biol Evol. .

Abstract

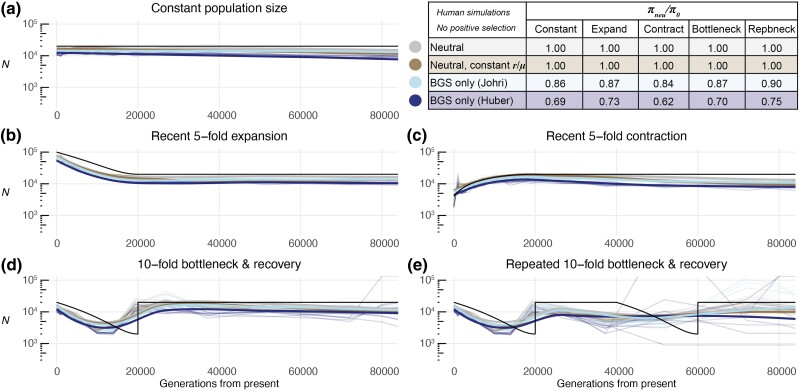
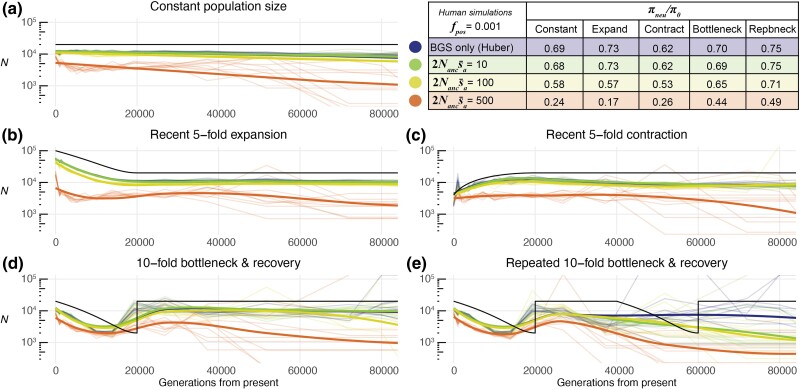
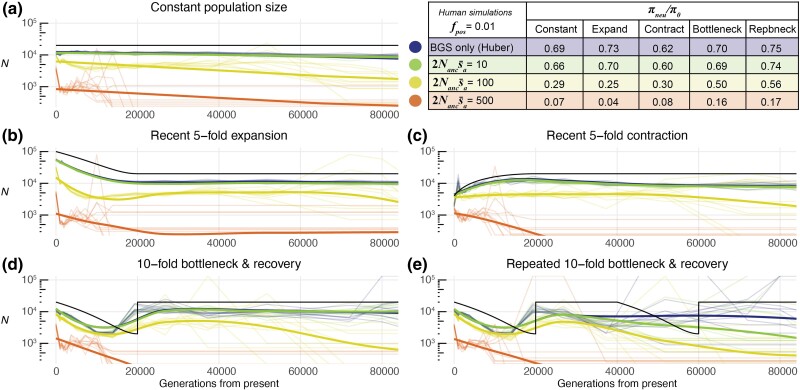
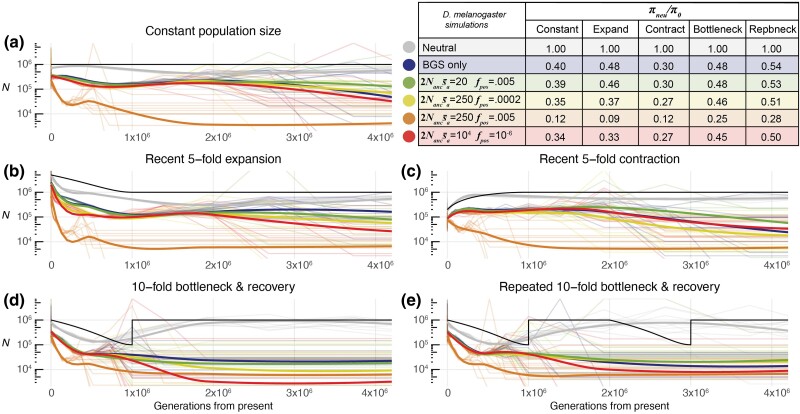
Inferring the demographic history of populations provides fundamental insights into species dynamics and is essential for developing a null model to accurately study selective processes. However, background selection and selective sweeps can produce genomic signatures at linked sites that mimic or mask signals associated with historical population size change. While the theoretical biases introduced by the linked effects of selection have been well established, it is unclear whether ancestral recombination graph (ARG)-based approaches to demographic inference in typical empirical analyses are susceptible to misinference due to these effects. To address this, we developed highly realistic forward simulations of human and Drosophila melanogaster populations, including empirically estimated variability of gene density, mutation rates, recombination rates, purifying, and positive selection, across different historical demographic scenarios, to broadly assess the impact of selection on demographic inference using a genealogy-based approach. Our results indicate that the linked effects of selection minimally impact demographic inference for human populations, although it could cause misinference in populations with similar genome architecture and population parameters experiencing more frequent recurrent sweeps. We found that accurate demographic inference of D. melanogaster populations by ARG-based methods is compromised by the presence of pervasive background selection alone, leading to spurious inferences of recent population expansion, which may be further worsened by recurrent sweeps, depending on the proportion and strength of beneficial mutations. Caution and additional testing with species-specific simulations are needed when inferring population history with non-human populations using ARG-based approaches to avoid misinference due to the linked effects of selection.

Keywords: Drosophila melanogaster; ancestral recombination graph; background selection; demographic inference; human population genomics; selective sweeps.


Conflict of interest statement

Conflict of Interest The authors declare no conflicts of interest.

Figures

Fig. 1.
Fig. 1.
Historical population size inferred by Relate for human-like parameters under five demographic scenarios under neutrality and in the presence of BGS. The black line represents the true simulated population size (N) for each demographic scenario (a to e); colored lines represent simulations without selection with varying recombination/mutation rates (gray), with constant recombination/mutation rates (gold), with BGS from the DFE reported by Johri et al. (2023; light blue), and with BGS from the DFE reported by Huber et al. (2017; dark blue). Thin colored lines represent each of the ten replicates per evolutionary scenario, thick colored lines represent the moving regression (LOESS) across all replicates for a given condition. Nucleotide diversity at neutral intron/intergenic sites for simulations with selection relative to identical simulations under neutrality is presented as πneuπ0 in the table. Note that population size is presented on a log10 scale.
Fig. 2.
Fig. 2.
Historical population size inferred by Relate for human-like parameters under five demographic scenarios experiencing selective sweeps from relatively low frequency positive selection (fpos = 0.001) with variable recombination/mutation rates and BGS (DFE from Huber et al. 2017). The black line represents the true simulated population size (N) for each demographic scenario (a to e), colored lines represent results for BGS only (blue), and different simulated mean positive selection coefficients (2Nancsa¯). Thin colored lines represent results for each of the ten replicates per evolutionary scenario; thick colored lines represent the moving regression (LOESS) across all replicates for a given condition. Nucleotide diversity at neutral intron/intergenic sites relative to identical simulations under neutrality is presented as πneuπ0 in the table. Note that population size is presented on a log10 scale.
Fig. 3.
Fig. 3.
Historical population size inferred by Relate for human-like parameters under five demographic scenarios experiencing selective sweeps from relatively high frequency positive selection (fpos = 0.01) with variable recombination/mutation rates and BGS (DFE from Huber et al. 2017). The black line represents the true simulated population size (N) for each demographic scenario (a to e), colored lines represent results for BGS only (blue), and different simulated mean positive selection coefficients (2Nancsa¯). Thin colored lines represent results for each of the ten replicates per evolutionary scenario; thick colored lines represent the moving regression (LOESS) across all replicates for a given condition. Nucleotide diversity at neutral intron/intergenic sites relative to identical simulations under neutrality is presented as πneuπ0 in the table. Note that population size is presented on a log10 scale.
Fig. 4.
Fig. 4.
Historical population size inferred by Relate for D. melanogaster-like parameters under five demographic scenarios, with variable recombination/mutation rates. The black line represents the true simulated population size (N) for each demographic scenario a to e); colored lines represent simulations under strict neutrality (gray), with BGS from the DFE reported by Johri et al. (2020; blue), and simulations experiencing BGS as well as sweeps from positive selection introduced with different parameter combinations. Thin colored lines represent results for each of the ten replicates per evolutionary scenario; thick colored lines represent the moving regression (LOESS) across all replicates for a given condition. Nucleotide diversity at neutral intron/intergenic sites for simulations with selection relative to identical simulations under neutrality is presented as πneuπ0 in the table. Note that population size is presented on a log10 scale.

Similar articles

Cited by

References

    1. Almarri MA, Haber M, Lootah RA, Hallast P, Al Turki S, Martin HC, Xue Y, Tyler-Smith C. The genomic history of the Middle East. Cell. 2021:184(18):4612–4625. 10.1016/j.cell.2021.07.013. - DOI - PMC - PubMed
    1. Andolfatto P. Adaptive evolution of non-coding DNA in Drosophila. Nature. 2005:437(7062):1149–1152. 10.1038/nature04107. - DOI - PubMed
    1. Arguello JR, Laurent S, Clark AG. Demographic history of the human commensal Drosophila melanogaster. Genome Biol Evol. 2019:11(3):844–854. 10.1093/gbe/evz022. - DOI - PMC - PubMed
    1. Beaumont MA, Zhang W, Balding DJ. Approximate Bayesian computation in population genetics. Genetics. 2002:162(4):2025–2035. 10.1093/genetics/162.4.2025. - DOI - PMC - PubMed
    1. Beichman AC, Huerta-Sanchez E, Lohmueller KE. Using genomic data to infer historic population dynamics of nonmodel organisms. Annu Rev Ecol Evol Syst. 2018:49(1):433–456. 10.1146/annurev-ecolsys-110617-062431. - DOI

LinkOut - more resources