. 2024 Jul 17;15(7):e0168423.
doi: 10.1128/mbio.01684-23. Epub 2024 Jun 14.

Cellular endosomal potassium ion flux regulates arenavirus uncoating during virus entry

Affiliations

Cellular endosomal potassium ion flux regulates arenavirus uncoating during virus entry

Amelia B Shaw et al. mBio. .

Abstract

Lymphocytic choriomeningitis virus (LCMV) is an enveloped and segmented negative-sense RNA virus classified within the Arenaviridae family of the Bunyavirales order. LCMV is associated with fatal disease in immunocompromised populations and, as the prototypical arenavirus member, acts as a model for the many highly pathogenic members of the Arenaviridae family, such as Junín, Lassa, and Lujo viruses, all of which are associated with devastating hemorrhagic fevers. To enter cells, the LCMV envelope fuses with late endosomal membranes, for which two established requirements are low pH and interaction between the LCMV glycoprotein (GP) spike and secondary receptor CD164. LCMV subsequently uncoats, where the RNA genome-associated nucleoprotein (NP) separates from the Z protein matrix layer, releasing the viral genome into the cytosol. To further examine LCMV endosome escape, we performed an siRNA screen which identified host cell potassium ion (K+) channels as important for LCMV infection, with pharmacological inhibition confirming K+ channel involvement during the LCMV entry phase completely abrogating productive infection. To better understand the K+-mediated block in infection, we tracked incoming virions along their entry pathway under physiological conditions, where uncoating was signified by separation of NP and Z proteins. In contrast, K+ channel blockade prevented uncoating, trapping virions within Rab7 and CD164-positive endosomes, identifying K+ as a third LCMV entry requirement. K+ did not increase GP-CD164 binding or alter GP-CD164-dependent fusion. Thus, we propose that K+ mediates uncoating by modulating NP-Z interactions within the virion interior. These results suggest K+ channels represent a potential anti-arenaviral target.IMPORTANCEArenaviruses can cause fatal human disease for which approved preventative or therapeutic options are not available. Here, using the prototypical LCMV, we identified K+ channels as critical for arenavirus infection, playing a vital role during the entry phase of the infection cycle. We showed that blocking K+ channel function resulted in entrapment of LCMV particles within late endosomal compartments, thus preventing productive replication. Our data suggest K+ is required for LCMV uncoating and genome release by modulating interactions between the viral nucleoprotein and the matrix protein layer inside the virus particle.

Keywords: LCMV; arenavirus; ion channels; potassium.


Conflict of interest statement

The authors declare no conflict of interest.

Figures
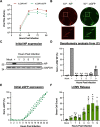
Fig 1
Fig 1
Comparison of replication kinetics of wild-type LCMV and eGFP-expressing LCMV. (A) BHK-21 cells were infected in triplicate (n = 3) with either rLCMV-WT or rLCMV-eGFP at an MOI of 0.001. Supernatant samples were collected every 24 h and were subsequently titered by focus-forming assay. The average titer of each time point was plotted with standard error. (B) Focus-forming assays for LCMV were performed by infecting BHK-21 cells with a serial dilution of the virus supernatant and incubating for 3 days. For rLCMV-WT, the focus-forming assay was fixed, permeabilized, and stained for LCMV NP by indirect immunostaining and was imaged using the IncuCyte S3 Live-Cell Analysis System. For rLCMV-eGFP, the focus-forming assays were imaged without fixing. (C and D) To identify initial synthesis of NP, SH-SY5Y cells were infected with rLCMV-WT, and lysates were collected at subsequent hours post-infection for Western blot (C) and densitometry analysis (D). This was plotted as a percentage of LCMV NP expression at 24 h post-infection, with standard error (n = 3). Results were analyzed by Student’s t-test, whereby n.s. denotes P > 0.5; *P < 0.05, **P < 0.01, ***P < 0.001, comparing the time points to NP expression at 24 h. (E) To examine time points of eGFP expression, SH-SY5Y cells were infected with rLCMV-eGFP, and the total integrated intensity of eGFP expression was measured every hour using the IncuCyte S3 Live-Cell Analysis System and plotted as a percentage of eGFP expression at 24 h, with standard error (n = 3). (F) SH-SY5Y cells were infected with rLCMV-eGFP at an MOI of 0.2 for 1 h at 37 ℃, after which the virus supernatant was removed, and the cells were extensively washed with phosphate-buffered saline (PBS). Fresh medium was added to the cells and incubated until the specified time point to transfer the supernatant to fresh cells, which were then imaged using the IncuCyte S3 Live-Cell Analysis System, 24 h after the time of transfer. The average number of eGFP-expressing cells counted (green cell count), resulting from four experimental repeats, is plotted with standard error. Results were analyzed by Student’s t-test, whereby n.s. denotes P > 0.05, **P < 0.01, ***P < 0.001, comparing time points to 1 h post-infection. n.s., not significant.
Fig 2
Fig 2
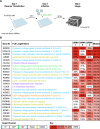
Assessment of the requirement of ion channels in the LCMV multiplication cycle using an siRNA screen. (A) Schematic depiction of the siRNA screening protocol. SH-SY5Y cells were reverse-transfected with siRNAs that targeted 176 cellular ion channel genes and then infected with rLCMV-eGFP at an MOI of 0.2. At 16 h post-infection (hpi), the cells were scanned using the IncuCyte S3 Live-Cell Analysis System for expression of eGFP. (B) The top 25 gene targets, which resulted in the highest knockdown of eGFP expression at 16 hpi, are shown. Percentage of eGFP expression is shown as the median of the average percentage of three individual siRNAs targeting the particular gene. Each percentage represents the mean of four experimental repeats. The channel families have been classified into color as shown by the target channel box. The percentage of expression of eGFP has been color coded with a red-to-white gradient, where red represents less than 60% eGFP expression and white represents more than 80% eGFP expression, as indicated by the key.
Fig 3
Fig 3
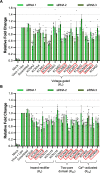
Cellular potassium ion channels are required for LCMV infection. Histograms showing the relative fold change of eGFP expression in SH-SY5Y cells after gene knockdown of a selection of potassium ion channels and infection with rLCMV-eGFP at an MOI of 0.2, after 16 h post-infection. The bars represent the knockdown eGFP expression of individual triplicate siRNAs, which targeted the same gene (siRNA 1, light green; siRNA 2, medium green; siRNA 3, dark green), as the result of four experimental repeats. Appropriate controls, such as mock-infected cells, cells infected with rLCMV-eGFP in the presence of a transfection reagent, and cells infected with rLCMV-eGFP after treatment with scrambled siRNAs, were included. Results were analyzed by Student’s t-test, whereby *P < 0.05, **P < 0.01, ***P < 0.001. (A) Histograms of siRNAs targeting genes expressing voltage-gated potassium (KV) ion channels. (B) Histograms of siRNAs targeting genes expressing inward rectifier (Kir), two-pore domain (K2P), and Ca2+-activated (KCa) potassium ion channels. Red boxes were used to indicate the genes, the knockdown of which resulted in a reduction in eGFP expression below 75%.
Fig 4
Fig 4
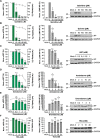
Broad-acting potassium ion channel inhibitors inhibit LCMV infection. (A–F) SH-SY5Y cells were pretreated for 45 min with increasing concentrations of broad-acting potassium ion channel inhibitors including TEA (A), quinidine (B), quinine (C), 4AP (D), amiodarone (E), and dronedarone (F). The cells were then infected in triplicate (n = 3) with either rLCMV-eGFP or rLCMV-WT at an MOI of 0.1 and were incubated for 24 h. eGFP expression (left-hand panels) was measured in live cells in triplicate (n = 3) using the IncuCyte S3 Live-Cell Analysis System and plotted as a percentage of cells infected with rLCMV-eGFP in the absence of the drug. Cell viability was also assessed using an MTS assay and plotted on the right axis. Cells infected with rLCMV-WT were lysed at 24 h post-infection, and the lysates were probed for NP expression. Densitometry analysis (middle panels) was performed on the Western blots in triplicate (n = 3) and plotted on the graphs as a percentage of cells infected with rLCMV-WT in the absence of the drug. Both eGFP expression and densitometry results were analyzed by Student’s t-test, whereby *P < 0.05, **P < 0.01, ***P < 0.001, comparing results to untreated controls. Examples of Western blots (right-hand panels) have also been included to demonstrate change in band size. 4AP, 4-aminopyridine; TEA, tetraethylammonium.
Fig 5
Fig 5
Cellular potassium ion channels are needed for early stages of LCMV infection. (A–C) SH-SY5Y cells were infected in triplicate (n = 3) with either rLCMV-eGFP or rLCMV-WT at an MOI of 0.1 and were incubated for 24 h. At the indicated hours post-infection (hpi; 0, 1, 2, 3, 6, 9, and 12 h), a suitable concentration of quinidine (A) (150 µM), quinine (B) (150 µM), or 4AP (C) (1 mM) was added for the remainder of the incubation time. At 24 hpi, the cells were then either imaged using the IncuCyte S3 Live-Cell Analysis System for analysis of eGFP expression or lysates were collected for Western blot and densitometry analysis. These were plotted as a percentage of untreated eGFP or NP expression at 24 h post-infection (virus, n = 3) (left-hand panels) and examples of Western blots are shown (right-hand panels). Results were analyzed by Student’s t-test, whereby n.s. denotes P > 0.05; *P < 0.05, **P < 0.01, ***P < 0.001, ****P < 0.0001, comparing results to the untreated control (virus). 4AP, 4-aminopyridine.
Fig 6
Fig 6
LCMV becomes trapped in presence of potassium ion channel inhibitors. A549 cells were untreated or pretreated with 150 µM quinidine and then infected with rLCMV-Z-HA at an MOI of 5 and fixed with formaldehyde at either 0, 3, 6, or 9 h. The cells were then permeabilized, blocked, and stained for the nucleus (DAPI, blue), LCMV NP (red), and Z-HA (green) by indirect immunostaining. The cells were then imaged on an Olympus IX83 widefield microscope at ×60 magnification. White dashed boxes were included to indicate which region of cells has been shown in the zoomed image. Scale bars representing 50 and 10 µm (zoomed images) are shown. Alongside the images is co-occurrence analysis, performed over five different images including >150 cells, which has been determined using the Manders coefficient method. The percentage of NP signal to Z signal and Z signal to NP signal was compared between untreated (pink) and quinidine-treated (blue). The co-occurrence analysis between untreated and treated was further analyzed through Student’s t-test, whereby n.s. denotes P > 0.05; *P < 0.05, ***P < 0.001; ****P < 0.0001. DAPI, 4',6-diamidino-2-phenylindole.
Fig 7
Fig 7
LCMV NP puncta co-localize with Rab7 and CD164 in cells treated with potassium ion channel inhibitors. A549 cells were untreated or pretreated with 150 µM quinidine and then infected with rLCMV-Z-HA at an MOI of 5 and fixed with formaldehyde at 6 h post-infection (hpi). The cells were then permeabilized, blocked, and stained for the nucleus (DAPI, blue), LCMV NP (red), Z-HA (green), and for cellular markers (cyan), Rab5, Rab7, CD164, and LAMP1, by indirect immunostaining. The cells were then imaged on an Olympus IX83 widefield microscope at ×60 magnification. White dashed boxes have been included to indicate which region of cells has been shown in the zoomed image. Scale bars representing 50 and 10 µm are included. Alongside the images is co-occurrence analysis, performed over five different images including >150 cells, which has been determined using the Manders coefficient method. The percentage of either NP signal, Z signal, or NP and Z signals has been examined against the signal of the marker. Comparison between untreated (pink) and quinidine treated (blue) was further analyzed through Student’s t-test, whereby n.s. denotes P > 0.05; *P < 0.05, ****P < 0.0001.
Fig 8
Fig 8
LCMV GP1 binding to CD164 is reduced in the presence of potassium. Soluble LCMV GP1 was used to coat 96-well high-protein-binding plates overnight, and then the wells were washed and blocked before washing in buffers at the specified pH, containing either 5 mM potassium chloride (GP+ CD164 – K+, red) or 140 mM potassium chloride (GP+ CD164+ K+, green). CD164-Fc was then added at the specified pH, washed, and incubated with goat anti-human IgG-HRP. The wells were washed and 3,3′,5,5′-tetramethylbenzidine (TMB) substrate was added, and the reaction was stopped with sulfuric acid, before reading the plate at 450 nm on a spectrophotometer plate-reader. The experiment was performed three times in duplicate with all results shown. All results were normalized to GP + CD164 – K+ at pH 5.4, which was the condition that resulted in the strongest absorption. Controls whereby LCMV NP was bound to the plate instead of GP1 (NP + CD164 – K+, blue, or NP + CD164 + K+, orange) or where no CD164 was added (GP – CD164 – K+, purple, or GP – CD164 – K+, black) were included to show lack of binding between NP and CD164 or between GP1 and goat anti-human IgG-HRP. The difference between 5 mM potassium chloride or 140 mM potassium chloride at the respective pH was further analyzed through Student’s t-test, whereby *P < 0.05, ****P < 0.0001.
Fig 9
Fig 9
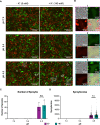
LCMV GPC and CD164-mediated fusion is not improved by the presence of potassium. (A) ∆CD164 HeLa cells expressing mCherry (red) were transfected with pCAGGS LCMV-GPC. At 4 h post-transfection, the cells were washed, trypsinized, and mixed 1:1 with ∆CD164 HeLa cells expressing plasma membrane-localized CD164 mutants and eGFP (green) to be seeded onto poly-L-lysine-coated 12-well plates. After overnight incubation, wells were initially imaged. Cells were then washed and treated with media at pH 7.4, 5.4, or 4.5 supplemented with 5 mM potassium chloride (−K+) or 140 mM potassium chloride (+K+) for 10 min. The treatment was then removed, and the cells were incubated in media supplemented with HEPES for 1 h. The cells were imaged using the IncuCyte S3 Live-Cell Analysis System. From three independent experimental repeats, representative images of green and red fluorescence are shown with a white outline indicating green and red fluorescence overlap and thus syncytia formation. (B) Zoom images of example syncytia indicated in panel A are shown as phase, green, red, and merge images. (C) Masks of green and red overlap areas were exported from the IncuCyte S3 program and imported into Fiji software. Here, the masks were made binary and inverted, and the number and areas of individual syncytia were measured. The number of syncytia seen across all images is plotted in panel C, whereas the average area of the syncytia is plotted in panel D alongside individual points representing the area of each syncytia. All three experimental repeats are shown. The difference between 5 mM potassium chloride or 140 mM potassium chloride at the respective pH was further analyzed through Student’s t-test, whereby n.s. denotes P > 0.05.
Fig 10
Fig 10
Proposed model of the role of potassium during LCMV entry. Proposed schematic model depicting the entry pathway of LCMV under physiological conditions and under conditions of potassium ion (K+) depletion. LCMV is internalized through macropinocytosis, after binding to alpha-dystroglycan, into early endosomes. LCMV then progresses through the endocytic system to late endosomes, where it experiences a reduction in pH and an increase in K+ concentration. The low pH is sufficient to drive a receptor switch to secondary receptor CD164, and the low pH and CD164 interaction drives membrane fusion and RNP release. We propose that, in addition to hydrogen ions (H+), K+ ions are transported into the virion interior to mediate destabilization and subsequent uncoating of the Z matrix layer. Under conditions of K+ depletion, we see incoming virions trapped in Rab7+ and CD164+ late endosomes, but we suggest that the absence of K+ in the endosome means no K+ is present in the virion interior, preventing uncoating of the viral matrix layer and release of the RNPs. This figure was created using Biorender. α-DG, α-dystroglycan.

Similar articles

Cited by

References

    1. Walker PJ, Siddell SG, Lefkowitz EJ, Mushegian AR, Dempsey DM, Dutilh BE, Harrach B, Harrison RL, Hendrickson RC, Junglen S, Knowles NJ, Kropinski AM, Krupovic M, Kuhn JH, Nibert M, Rubino L, Sabanadzovic S, Simmonds P, Varsani A, Zerbini FM, Davison AJ. 2019. Changes to virus taxonomy and the International code of virus classification and nomenclature ratified by the International committee on taxonomy of viruses. Arch Virol 164:2417–2429. doi:10.1007/s00705-019-04306-w - DOI - PubMed
    1. Radoshitzky SR, Buchmeier MJ, Charrel RN, Clegg JCS, Gonzalez J-P, Günther S, Hepojoki J, Kuhn JH, Lukashevich IS, Romanowski V, Salvato MS, Sironi M, Stenglein MD, de la Torre JC, Ictv Report Consortium . 2019. ICTV virus taxonomy profile: arenaviridae. J Gen Virol 100:1200–1201. doi:10.1099/jgv.0.001280 - DOI - PubMed
    1. Charrel RN, de Lamballerie X. 2010. Zoonotic aspects of arenavirus infections. Vet Microbiol 140:213–220. doi:10.1016/j.vetmic.2009.08.027 - DOI - PubMed
    1. Kernéis S, Koivogui L, Magassouba N, Koulemou K, Lewis R, Aplogan A, Grais RF, Guerin PJ, Fichet-Calvet E. 2009. Prevalence and risk factors of Lassa seropositivity in inhabitants of the forest region of guinea: a cross-sectional study. PLoS Negl Trop Dis 3:e548. doi:10.1371/journal.pntd.0000548 - DOI - PMC - PubMed
    1. Shao J, Liang Y, Ly H. 2015. Human hemorrhagic fever causing arenaviruses: molecular mechanisms contributing to virus virulence and disease pathogenesis. Pathogens 4:283–306. doi:10.3390/pathogens4020283 - DOI - PMC - PubMed

LinkOut - more resources