

The interictal suppression hypothesis is the dominant differentiator of seizure onset zones in focal epilepsy
- PMID: 38874456
- PMCID: PMC11370787
- DOI: 10.1093/brain/awae189
The interictal suppression hypothesis is the dominant differentiator of seizure onset zones in focal epilepsy
Abstract
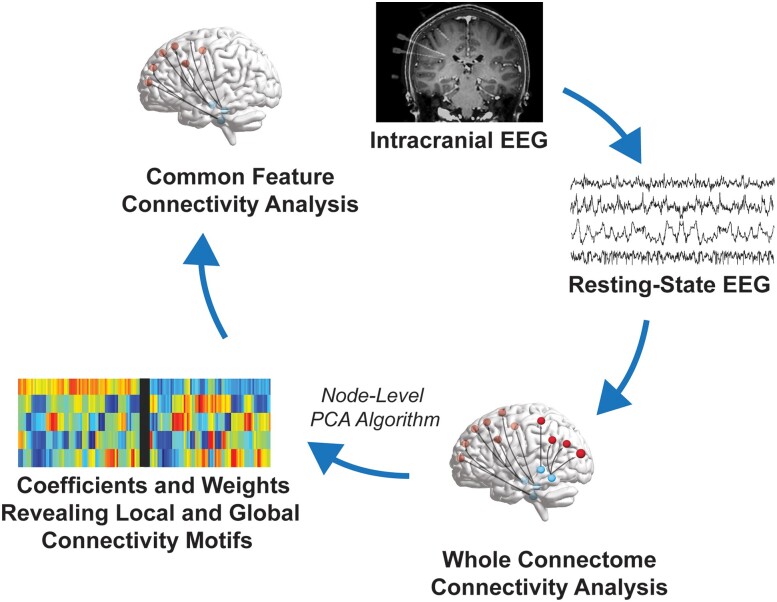
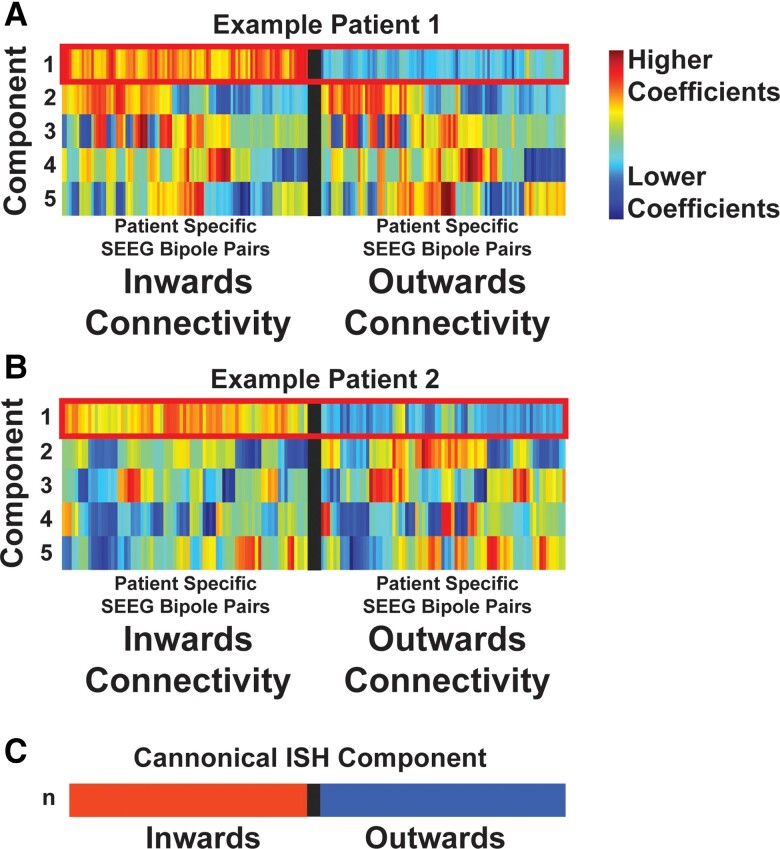
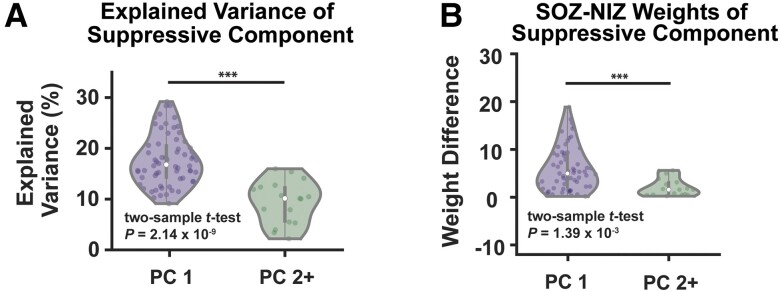
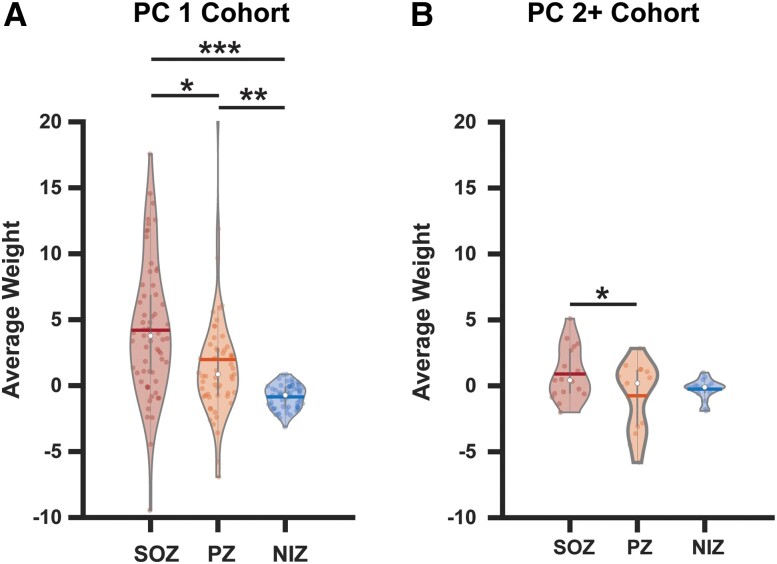
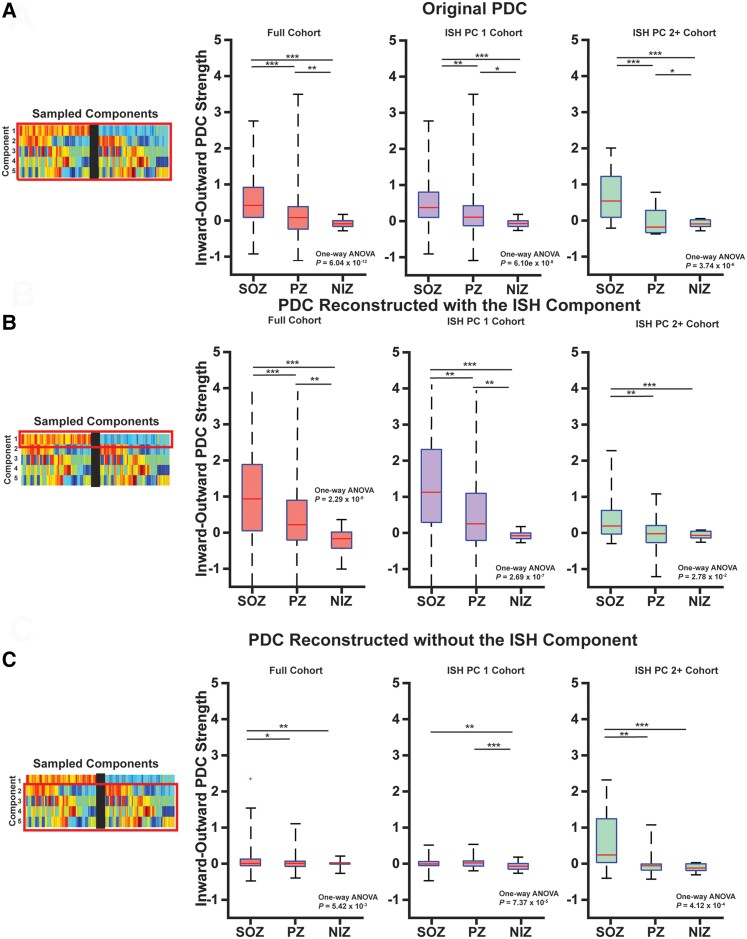
Successful surgical treatment of drug-resistant epilepsy traditionally relies on the identification of seizure onset zones (SOZs). Connectome-based analyses of electrographic data from stereo electroencephalography (SEEG) may empower improved detection of SOZs. Specifically, connectome-based analyses based on the interictal suppression hypothesis posit that when the patient is not having a seizure, SOZs are inhibited by non-SOZs through high inward connectivity and low outward connectivity. However, it is not clear whether there are other motifs that can better identify potential SOZs. Thus, we sought to use unsupervised machine learning to identify network motifs that elucidate SOZs and investigate if there is another motif that outperforms the ISH. Resting-state SEEG data from 81 patients with drug-resistant epilepsy undergoing a pre-surgical evaluation at Vanderbilt University Medical Center were collected. Directed connectivity matrices were computed using the alpha band (8-13 Hz). Principal component analysis (PCA) was performed on each patient's connectivity matrix. Each patient's components were analysed qualitatively to identify common patterns across patients. A quantitative definition was then used to identify the component that most closely matched the observed pattern in each patient. A motif characteristic of the interictal suppression hypothesis (high-inward and low-outward connectivity) was present in all individuals and found to be the most robust motif for identification of SOZs in 64/81 (79%) patients. This principal component demonstrated significant differences in SOZs compared to non-SOZs. While other motifs for identifying SOZs were present in other patients, they differed for each patient, suggesting that seizure networks are patient specific, but the ISH is present in nearly all networks. We discovered that a potentially suppressive motif based on the interictal suppression hypothesis was present in all patients, and it was the most robust motif for SOZs in 79% of patients. Each patient had additional motifs that further characterized SOZs, but these motifs were not common across all patients. This work has the potential to augment clinical identification of SOZs to improve epilepsy treatment.
Keywords: connectomics; drug-resistant focal epilepsy; interictal suppression hypothesis; machine learning; principal component analysis; stereo electroencephalography.
© The Author(s) 2024. Published by Oxford University Press on behalf of the Guarantors of Brain.
Conflict of interest statement
The authors report no competing interests.
Figures
Comment in
-
Sink into the epileptogenic zone: findings from directed SEEG functional connectivity decomposition.Brain. 2024 Sep 3;147(9):2902-2905. doi: 10.1093/brain/awae256. Brain. 2024. PMID: 39074199 No abstract available.
Similar articles
-
Interictal suppression in patients with mesial temporal lobe epilepsy: A simultaneous PET/fMRI study.Neuroimage. 2025 Jul 1;314:121207. doi: 10.1016/j.neuroimage.2025.121207. Epub 2025 Apr 23. Neuroimage. 2025. PMID: 40280218
-
The Interictal Suppression Hypothesis in focal epilepsy: network-level supporting evidence.Brain. 2023 Jul 3;146(7):2828-2845. doi: 10.1093/brain/awad016. Brain. 2023. PMID: 36722219 Free PMC article.
-
Interictal high-frequency oscillations (HFOs) as predictors of high frequency and conventional seizure onset zones.Epileptic Disord. 2015 Dec;17(4):413-24. doi: 10.1684/epd.2015.0774. Epileptic Disord. 2015. PMID: 26620382 Free PMC article.
-
Defining epileptogenic networks: Contribution of SEEG and signal analysis.Epilepsia. 2017 Jul;58(7):1131-1147. doi: 10.1111/epi.13791. Epub 2017 May 20. Epilepsia. 2017. PMID: 28543030 Review.
-
Patient phenotypes and clinical outcomes in invasive monitoring for epilepsy: An individual patient data meta-analysis.Epilepsy Behav. 2020 Jan;102:106652. doi: 10.1016/j.yebeh.2019.106652. Epub 2019 Nov 23. Epilepsy Behav. 2020. PMID: 31770717 Review.
Cited by
-
Directionality of neural activity in and out of the seizure onset zone in focal epilepsy.Netw Neurosci. 2025 Jun 30;9(2):798-823. doi: 10.1162/netn_a_00454. eCollection 2025. Netw Neurosci. 2025. PMID: 40612715 Free PMC article.
-
Advancements in Surgical Therapies for Drug-Resistant Epilepsy: A Paradigm Shift towards Precision Care.Neurol Ther. 2025 Apr;14(2):467-490. doi: 10.1007/s40120-025-00710-4. Epub 2025 Feb 10. Neurol Ther. 2025. PMID: 39928287 Free PMC article. Review.
-
Mini-Seizures: Novel Interictal iEEG Biomarker Capturing Synchronization Network Dynamics at the Epileptogenic Zone.medRxiv [Preprint]. 2025 Feb 2:2025.01.31.25321482. doi: 10.1101/2025.01.31.25321482. medRxiv. 2025. PMID: 39974054 Free PMC article. Preprint.
-
Can brain network analyses guide epilepsy surgery?Curr Opin Neurol. 2025 Apr 1;38(2):105-110. doi: 10.1097/WCO.0000000000001346. Epub 2025 Jan 31. Curr Opin Neurol. 2025. PMID: 39886890 Review.
-
Preictal connectivity dynamics: Exploring inflow and outflow in iEEG networks.Front Netw Physiol. 2025 Apr 28;5:1539682. doi: 10.3389/fnetp.2025.1539682. eCollection 2025. Front Netw Physiol. 2025. PMID: 40357443 Free PMC article.
References
-
- Behr C, Goltzene MA, Kosmalski G, Hirsch E, Ryvlin P. Epidemiology of epilepsy. Rev Neurol (Paris). 2016;172:27–36. - PubMed
-
- Beghi E. The epidemiology of epilepsy. Neuroepidemiology. 2020;54:185–191. - PubMed
-
- Téllez-Zenteno JF, Dhar R, Wiebe S. Long-term seizure outcomes following epilepsy surgery: A systematic review and meta-analysis. Brain. 2005;128:1188–1198. - PubMed
-
- Ryvlin P, Cross JH, Rheims S. Epilepsy surgery in children and adults. Lancet Neurol. 2014;13:1114–1126. - PubMed
MeSH terms
Grants and funding
LinkOut - more resources
Full Text Sources
Medical
