. 2024 Jul 22;52(13):7987-8002.
doi: 10.1093/nar/gkae522.

Cooperative Gsx2-DNA binding requires DNA bending and a novel Gsx2 homeodomain interface

Affiliations

Cooperative Gsx2-DNA binding requires DNA bending and a novel Gsx2 homeodomain interface

Jordan A Webb et al. Nucleic Acids Res. .

Erratum in

Abstract

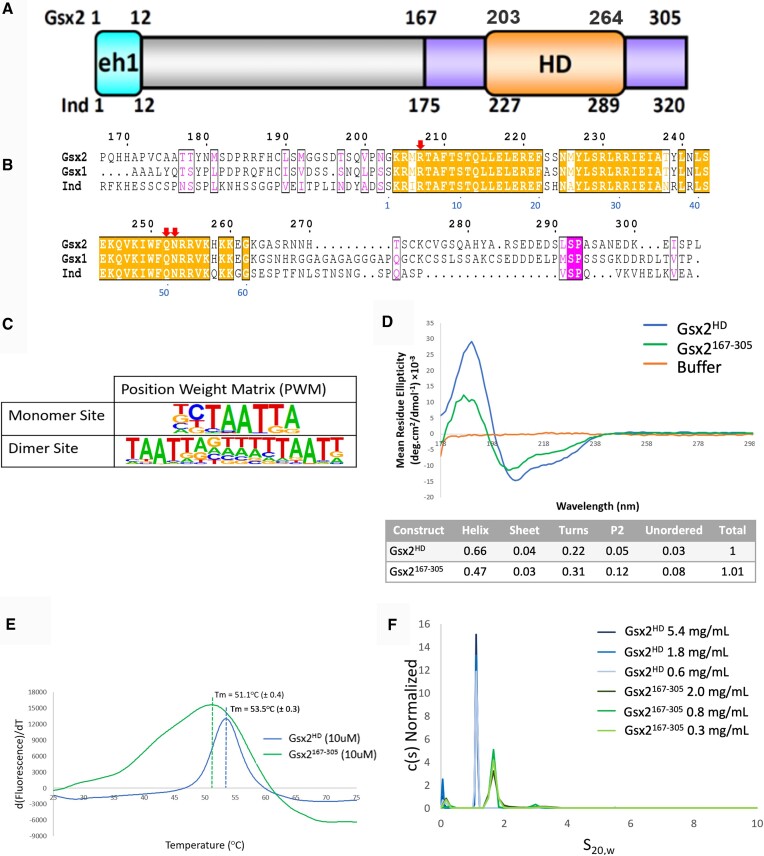
The conserved Gsx homeodomain (HD) transcription factors specify neural cell fates in animals from flies to mammals. Like many HD proteins, Gsx factors bind A/T-rich DNA sequences prompting the following question: How do HD factors that bind similar DNA sequences in vitro regulate specific target genes in vivo? Prior studies revealed that Gsx factors bind DNA both as a monomer on individual A/T-rich sites and as a cooperative homodimer to two sites spaced precisely 7 bp apart. However, the mechanistic basis for Gsx-DNA binding and cooperativity is poorly understood. Here, we used biochemical, biophysical, structural and modeling approaches to (i) show that Gsx factors are monomers in solution and require DNA for cooperative complex formation, (ii) define the affinity and thermodynamic binding parameters of Gsx2/DNA interactions, (iii) solve a high-resolution monomer/DNA structure that reveals that Gsx2 induces a 20° bend in DNA, (iv) identify a Gsx2 protein-protein interface required for cooperative DNA binding and (v) determine that flexible spacer DNA sequences enhance Gsx2 cooperativity on dimer sites. Altogether, our results provide a mechanistic basis for understanding the protein and DNA structural determinants that underlie cooperative DNA binding by Gsx factors.


Figures

Graphical Abstract
Graphical Abstract
Figure 1.
Figure 1.
The HD region of Gsx2 that cooperatively binds DNA is monomeric in solution. (A) Schematic of Gsx2 with the conserved HD colored orange, flanking sequences in purple and the eh1 repression domain in cyan. Numbers denote amino acid positions in the Mus musculus Gsx2 and Drosophila melanogaster Ind homologs. (B) Sequence alignment of the murine Gsx2167–305 protein with similar regions from its mouse paralog Gsx1, and its ortholog Ind from Drosophila. Gsx2 residue numbering is above the alignment and the canonical HD numbering scheme is below in blue font. Red arrows denote conserved residues involved in specific DNA binding. (C) The Gsx2 position weight matrices (PWMs) generated from HT-SELEX data revealed specific DNA monomer and DNA dimer sites (4,17). (D) Far-ultraviolet circular dichroism (CD) spectra depicting the difference in spectra between Gsx2HD, Gsx2167–305 and buffer. Table generated by the CDSSTR program from the DichroWeb online server estimating the secondary structure predictions of the corresponding CD data. (E) Differential scanning fluorimetry (DSF) assays of Gsx2HD and Gsx2167–305 at 10 μM, highlighting a single melting peak averaging at 53.5 and 51.1°C, respectively. (F) Sedimentation velocity analytical ultracentrifugation (SV-AUC) of Gsx2HD and Gsx2167–305 at increasing concentrations yields a sedimentation coefficient distribution showing a single peak for both constructs, which corresponds to a Gsx2 monomer.
Figure 2.
Figure 2.
Gsx proteins bind a consensus DNA binding motif with high affinity. Isotherms from ITC depict the binding activity of Gsx2HD, Gsx1HD and Gsx2167–305 to both a -TAATTA- and a -TAATGG- motif. (A) The Gsx2HD shows an average 15 nM affinity for the -TAATTA- site and a 36 nM affinity for the -TAATGG- site. (B) The Gsx1HD shows nearly identical affinities to Gsx2HD, with an average 18 and 42 nM affinity for the -TAATTA- and -TAATGG- sites, respectively. (C) Conversely, the Gsx2167–305 protein containing short N- and C-terminal flanking regions shows weaker affinity with 77 and 143 nM affinity for the -TAATTA- and -TAATGG- sites, respectively.
Figure 3.
Figure 3.
Gsx2 forms a canonical HD fold with three major contacts within the major and minor DNA grooves. X-ray crystal structure of Gsx2 203–264 (HD) bound to DNA containing the consensus motif TAATTA. (A) A single Gsx2HD–DNA complex shows the classic HD three-helix fold, with the third helix inserted into the major groove of DNA. Gsx2 is colored cyan while DNA is colored gray, except for the -TAATTA- motif, which is colored green. N- and C-terminal ends are labeled. (B) A water molecule mediates hydrogen bond interactions between Q252 (Q50) of the HD and two thymine bases within the major groove. (C) Highly conserved N253 (N51) makes two direct hydrogen bonds with an adenine in the major groove. (D) R207 (R5) makes two direct hydrogen bonds with a thymine and an adenine in the minor groove. (E) Schematic of all specific and nonspecific protein–DNA interactions. Figure created with DNAproDB (49,50).
Figure 4.
Figure 4.
Modeling Gsx2HD bound to a DNA dimer site reveals a potential protein–protein interface involved in cooperativity that is dependent on DNA bending. (A) Top, side and bottom views of the Gsx2HD–DNA monomer structure, which shows significant bending of the DNA to an ∼20° angle due to Gsx2HD interactions. Gsx2HD is shown in green, and DNA is shown in light gray. Blue lines parallel to the DNA represent the helical axis, while blue lines perpendicular to the DNA represent the degree and directionality of DNA bending. (B) Isolated view of the DNA from the structure without the Gsx2 protein, highlighting DNA bending. (C) Comparison views of an ideal B-form DNA duplex with an identical sequence to the DNA used in the Gsx2HD–DNA structure. (D) Top and back views of a Gsx2HD–DNA dimer model with optimal dimer sequence, 7 bp spacer length and orientation, but lacking any DNA bending. One Gsx2HD protein is in yellow, the second Gsx2HD protein is in green and the DNA is light gray. No protein–protein contacts are observed in this model. (E) Comparison views of a Gsx2HD–DNA dimer model based upon a dimer sequence with 7 bp spacer length and 20° bend observed in monomer structure. Potential protein–protein interactions are observed between both Gsx2HD proteins. (F) Comparison views of a Gsx2HD–DNA dimer model with a dimer sequence with an 8 bp spacer length and DNA bending show a loss of direct contact between the two Gsx2HD proteins.
Figure 5.
Figure 5.
Gsx2 preferentially selects DNA dimer sequences with flexible A/T-rich spacers. (A) Analysis of in vitro HT-SELEX data (4) revealed significantly faster enrichment for dimer sequences with A/T-rich spacers compared to G/C-rich spacers. Note that the PWM generated from analyzing the sequences after the fourth round of selection at top reveals a boxed spacer sequence of five nucleotides with strong overall A/T preference. Graph below depicts the percentage of sequences encoding A/T- versus G/C-rich spacers in the original library (cycle 0) and after each round of selection (cycles 1–4). (B) Analysis of in vivo CUT&RUN data showing that Gsx2 has a bias for DNA dimer sequences with A/T-rich spacers. At top is the Gsx2 dimer PWM from the top quartile of called peaks and the dashed line in the graph below indicates a perfect Gaussian curve if no bias was detected. (C) EMSAs of Gsx2167–305 binding to DNA dimer duplexes with various A/T-rich or G/C-rich spacers show increased cooperative binding for all A/T-rich sequences compared to G/C-rich sequences. Note that each EMSA probe was tested in five lanes containing the following concentrations of purified Gsx2167–305 protein: 0, 50, 100, 200 and 400 nM. (D) The cooperativity of the EMSAs was quantified using the τ factor, which reveals an ∼6-fold increase for A/T-rich sequences versus G/C-rich sequences, consistent with our bioinformatic data highlighting Gsx2’s preference for more flexible A/T-rich spacer sequences. Each dot represents the τ value from an individual binding reaction of either an A/T-rich or a G/C-rich spacer probe (n = 12 for each group). Error bars denote standard deviation. τ factors were compared with a two-sided unpaired Student’s t-test.
Figure 6.
Figure 6.
Gsx2HD dimer model reveals a novel binding interface with residue conservation among the Gsx/Ind family. (A) Expanded front and top views of the protein–protein interface observed in our 7-bp spacer length dimer model. Four residues are primarily localized at the interface: S212, L216, L231 and I234. The two Gsx2HD monomers are colored yellow and green, and the interface residues are shown in stick representation. (B) Sequence alignment of the HDs Gsx2HD and Gsx1HD, which have been shown to bind DNA cooperatively, with close relatives, none of which are expected to bind DNA cooperatively. Red triangles denote residues S212, L216, L231 and I234. Gsx2 residue numbering is above the alignment and the canonical HD numbering scheme is below in blue font. (C) A representative EMSA and corresponding τ factor calculations of WTHD and I234EHD binding to the 7bpS (7-bp spacer, cooperative) and 8bpS (8-bp spacer, noncooperative) DNA dimer probes, demonstrating that the I234EHD protein shows significantly reduced cooperative binding on the 7bpS probe compared to the WTHD protein. Note that each EMSA probe was tested in four lanes containing the following concentrations of purified Gsx2HD protein: 0, 25, 100 and 400 nM. Each dot represents the τ value for either the 7-bp or 8-bp spacer probe at each of the different protein concentrations. The mean τ value for each probe:protein combination is noted and error bars denote standard deviation of the mean. Significance was determined by two-way analysis of variance (ANOVA) with Tukey’s multiple comparison test. (D) Replicate EMSA from panel (A) but instead showing WT167–305 and I234E167–305 binding to the 7bpS and 8bpS DNA dimer probes. Again, only WT167–305 on the 7bpS probe is strongly cooperative, demonstrating that even in the presence of the flanking regions around the HD the I234E mutation is sufficient to greatly diminish Gsx2 cooperative DNA binding. Note that each EMSA probe was tested in four lanes containing the following concentrations of purified Gsx2167–305 protein: 0, 25, 100 and 400 nM. Each dot represents the τ value for either the 7-bp or 8-bp spacer probe at each of the different protein concentrations. Numbers beneath graph bars denote the mean τ value for each probe:protein combination. Error bars denote standard deviation of the mean. Significance was determined by two-way ANOVA with Tukey’s multiple comparison test.

Update of

Similar articles

Cited by

References

    1. Cain B., Gebelein B. Mechanisms underlying Hox-mediated transcriptional outcomes. Front. Cell Dev. Biol. 2021; 9:787339. - PMC - PubMed
    1. Bürglin T.R., Affolter M. Homeodomain proteins: an update. Chromosoma. 2016; 125:497–521. - PMC - PubMed
    1. Pick L., Heffer A. Hox gene evolution: multiple mechanisms contributing to evolutionary novelties. Ann. N.Y. Acad. Sci. 2012; 1256:15–32. - PubMed
    1. Jolma A., Yan J., Whitington T., Toivonen J., Nitta K.R., Rastas P., Morgunova E., Enge M., Taipale M., Wei G. et al. . DNA-binding specificities of human transcription factors. Cell. 2013; 152:327–339. - PubMed
    1. Noyes M.B., Christensen R.G., Wakabayashi A., Stormo G.D., Brodsky M.H., Wolfe S.A. Analysis of homeodomain specificities allows the family-wide prediction of preferred recognition sites. Cell. 2008; 133:1277–1289. - PMC - PubMed

MeSH terms

LinkOut - more resources