. 2024 Aug;11(30):e2401789.
doi: 10.1002/advs.202401789. Epub 2024 Jun 14.

Lefamulin Overcomes Acquired Drug Resistance via Regulating Mitochondrial Homeostasis by Targeting ILF3 in Hepatocellular Carcinoma

Affiliations

Lefamulin Overcomes Acquired Drug Resistance via Regulating Mitochondrial Homeostasis by Targeting ILF3 in Hepatocellular Carcinoma

Ying Zheng et al. Adv Sci (Weinh). 2024 Aug.

Abstract

Acquired resistance represents a critical clinical challenge to molecular targeted therapies such as tyrosine kinase inhibitors (TKIs) treatment in hepatocellular carcinoma (HCC). Therefore, it is urgent to explore new mechanisms and therapeutics that can overcome or delay resistance. Here, a US Food and Drug Administration (FDA)-approved pleuromutilin antibiotic is identified that overcomes sorafenib resistance in HCC cell lines, cell line-derived xenograft (CDX) and hydrodynamic injection mouse models. It is demonstrated that lefamulin targets interleukin enhancer-binding factor 3 (ILF3) to increase the sorafenib susceptibility of HCC via impairing mitochondrial function. Mechanistically, lefamulin directly binds to the Alanine-99 site of ILF3 protein and interferes with acetyltransferase general control non-depressible 5 (GCN5) and CREB binding protein (CBP) mediated acetylation of Lysine-100 site, which disrupts the ILF3-mediated transcription of mitochondrial ribosomal protein L12 (MRPL12) and subsequent mitochondrial biogenesis. Clinical data further confirm that high ILF3 or MRPL12 expression is associated with poor survival and targeted therapy efficacy in HCC. Conclusively, this findings suggest that ILF3 is a potential therapeutic target for overcoming resistance to TKIs, and lefamulin may be a novel combination therapy strategy for HCC treatment with sorafenib and regorafenib.

Keywords: HCC; ILF3; MRPL12; acetylation; lefamulin; targeted therapy resistance.


Conflict of interest statement

The authors declare no conflict of interest.

Figures
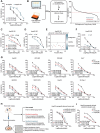
Figure 1
Figure 1
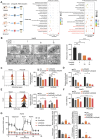
Identification of pleuromutilin class of antibiotics as sensitizers for sorafenib from FDA‐approved library. A) The viability of sorafenib‐resistant (HepG2 SR) cells and its corresponding parental cells HepG2 cells were analyzed by CCK‐8 assay. Cells were treated with various concentrations of sorafenib for 48 h (n = 3). B) Left, screening diagram showing the procedure for screening drugs in FDA‐approved drug library that can enhance the sensitivity of sorafenib. Right, statistical distribution curve of cell viability in HCC cells of 1430 FDA‐approved drugs. C,D) HepG2 SR cells were treated with various concentrations of sorafenib alone, or in combination with 10 × 10−6 m C) valnemulin (val), retapamulin (reta) or D) lefamulin (lef) for 48 h, and cell viability was evaluated by CCK‐8 assay (n = 3). E) Synergistic effect of valnemulin, retapamulin or lefamulin with sorafenib on HepG2 SR cells. CI (combination index) values were calculated as described in Supporting Information. F) HepG2 SR cells were treated with various concentrations of regorafenib alone, or in combination with 10 × 10−6 m lefamulin for 48 h, and cell viability was evaluated by CCK‐8 assay (n = 3). G) Cell viability assay was carried out in different HCC cell lines, including HepG2, HCCLM3, SNU449, Huh7, Bel7402, MHCC‐97H, Hep3B and SK‐Hep‐1 cells treated with 10 × 10−6 or 20 × 10−6 m lefamulin and/or various concentrations of sorafenib for 48 h (n = 3). H) Left, experimental design of an HCC xenograft model of acquired resistance to sorafenib and the isolation and representative images of sorafenib‐resistant tumor cells. Scale bar, 5 µm. Right, HepG2‐xenografts derived tumor cells were treated with various concentrations of sorafenib for 48 h, and cell viability was analyzed by CCK‐8 assay (n = 3). I) HepG2‐xenografts derived sorafenib resistant cells were treated with various concentrations of sorafenib alone, or in combination with 10 × 10−6 or 20 × 10−6 m lefamulin for 48 h, and cell viability was evaluated by CCK‐8 assay (n = 3). Data are presented as mean ± SEM.
Figure 2
Figure 2
Combination of lefamulin and sorafenib significantly inhibits HCC growth in vitro and in vivo. A–C) HepG2 and HCCLM3 cells were treated with various concentrations of lefamulin and 5 × 10⁻⁶ m sorafenib separately or in combination for indicated time, and cell proliferation was evaluated by A) CCK‐8 assay (n = 3), B) colony formation assay and C) EDU incorporation assay (Scale bar, 100 µm). D) HepG2 and HCCLM3 cells were treated with various concentrations of lefamulin and 5 × 10⁻⁶ m sorafenib separately or in combination for 48 h, and apoptosis was analyzed by flow cytometry (n = 3). E–G) Nude mice bearing HepG2‐derived xenografts were intraperitoneally administered lefamulin (25 or 50 mg kg−1) and/or orally administered sorafenib (30 mg kg−1) every day, n = 6. Representative images of E) the tumors, F) tumor growth curves and tumor weight, G) representative images of hematoxylin and eosin (H & E) (Scale bar, 100 µm) and Ki67 staining (Scale bar, 50 µm) in tumor tissues are shown (n = 6). Data are presented as mean ± SEM. t test, *P < 0.05, **P < 0.01, ***P < 0.001, and ****P < 0.0001.
Figure 3
Figure 3
Lefamulin‐mediated mitochondrial dysfunction augmented the susceptibility of HCC cells to sorafenib. A) Left, scheme illustrating; middle, KEGG pathway analysis; right, Gene ontology (GO) analysis for differentially expressed genes of lefamulin and/or sorafenib treated tumors. B) Left, representative transmission electron microscopy (TEM) images of mitochondrial morphological changes in HepG2 cells after lefamulin and/or sorafenib treatment. Scale bar, 5 µm (top), 1 µm (bottom). Right, statistical chart of the numbers of mitochondria (n = 3). C) Mitochondrial mass was estimated with MitoTracker Green using flow cytometry in HepG2 and HCCLM3 cells treated with lefamulin and/or sorafenib (n = 3). D) RT‐qPCR analysis of mitochondrial DNA content in HepG2 and HCCLM3 cells treated with lefamulin and/or sorafenib (n = 3). E) Flow cytometric analysis of ROS accumulation using DCFH‐DA probe in HepG2 and HCCLM3 cells treated with lefamulin and/or sorafenib (n = 3). F) HepG2 cells were treated with 20 × 10−6 m lefamulin and/or 5 × 10⁻⁶ m sorafenib in the presence or absence of NAC (an ROS scavenger, 5 × 10⁻⁶ m) pre‐treatment for 24 h. The cell viability was determined by CCK‐8 assay (n = 3). G) Oxygen consumption rate (OCR) analysis using Seahorse analysis revealed compromised mitochondrial function in HepG2 cells treated with lefamulin and/or sorafenib for 48 h. Basal respiration, ATP production, maximal respiration, and spare respiratory capacity were identified, respectively (n = 3). Data are presented as mean ± SEM. t test, *P < 0.05, **P < 0.01, ***P < 0.001, and ****P < 0.0001.
Figure 4
Figure 4
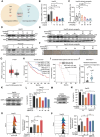
Lefamulin impairs mitochondrial function via downregulation of MRPL12. A) Venn diagram of the co‐downregulated mRNAs after lefamulin treatment in HepG2 cells and HepG2‐derived xenografts. B,C) RT‐qPCR was carried out to examine mRNA expression of MRPL12 in B) HepG2 cells (n = 3) and C) HepG2‐derived xenografts (n = 6) treated with lefamulin and/or sorafenib. D,E) Western blot was carried out to examine protein expression of MRPL12 in D) HepG2 and HCCLM3 cells and E) HepG2‐derived xenografts treated with lefamulin and/or sorafenib. F) Representative images of IHC staining of MRPL12 of tumors from nude mice. Scale bar, 50 µm. G) The expression of MRPL12 in HCC (n = 369) and non‐tumor tissues (n = 160) (P < 0.01) from GEPIA database. Based on the selected TCGA tumors and TCGA normal + GTEx normal datasets performed difference analysis (one‐way ANOVA). H) Kaplan‐Meier overall survival (Log‐rank P = 0.0034) curves of HCC patients, using the TCGA datasets in the GEPIA database. High and low expression of MRPL12 were stratified by the median. I) Kaplan‐Meier analysis of overall survival (Log‐rank P = 0.0069) probability in liver cancer patients that have undergone sorafenib treatment. The patients were stratified according to high versus low expression (cutoff, median) of MRPL12 mRNA within their tumors. J) MRPL12 mRNA levels in tumors between sorafenib responders (n = 21) and sorafenib non‐responders (n = 46) from GEO database. K,M) Western blot was carried out to examine protein expression of MRPL12 in HepG2 cells after K) MRPL12 knockdown or M) overexpression. L,N) Effect of L) MRPL12 knockdown or N) overexpression on sorafenib sensitivity in HepG2 cells. The cells were treated for 48 h. Cell viability was measured by CCK‐8 assay (n = 3). O,P) Effect of O) MRPL12 knockdown or P) overexpression on ROS accumulation in HepG2 cells measured by DCFH‐DA probe (n = 3). Data are presented as mean ± SEM. t test, *P < 0.05, **P < 0.01, ***P < 0.001, ****P < 0.0001, and n.s., not significant.
Figure 5
Figure 5
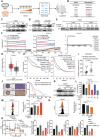
Lefamulin targets ILF3 to sensitize HCC to sorafenib. A) Schematic diagram of the CETSA method and mass spectrometry analysis. B) The 6 candidate proteins with high abundances identified by mass spectrometry analysis. C) Western blot was carried out to examine protein expression of ILF3 in HepG2 cells treated with 5 × 10⁻⁶ m sorafenib for 0, 24, 72, and 120 h. D) Western blot was carried out to examine protein expression of ILF3 in sorafenib‐sensitive (P) and resistant (SR) HepG2 and HCCLM3 cells. E) DARTS was used to evaluate the binding of lefamulin with ILF3. The expression of ILF3 was detected by western blot. F) BLI analysis showing the affinity of lefamulin for the ILF3WT, ILF3V575A and ILF3A99E protein. G) The expression of ILF3 in HCC (n = 369) and non‐tumor tissues (n = 160) (P < 0.01) from GEPIA database. Based on the selected TCGA tumors and TCGA normal + GTEx normal datasets performed difference analysis. H) Kaplan‐Meier overall survival (Log‐rank P = 0.0086) and disease‐free survival (Log‐rank P = 0.013) curves of HCC patients, using the TCGA datasets in the GEPIA database. High and low expression of ILF3 were stratified by the median. I) ILF3 mRNA levels in tumors between sorafenib responders (n = 21) and sorafenib non‐responders (n = 46) from GEO database. J) Left, representative images of IHC staining of ILF3 in sorafenib‐resistant or sorafenib‐sensitive liver cancer tissues. Scale bar, 500 µm (left), 100 µm (right). Right, Kaplan‐Meier analysis of liver cancer patients’ overall survival grouped by low or high expression of ILF3. P‐values were determined by Log‐rank test, P = 0.0038. K) Western blot was carried out to examine protein expression of ILF3 in HepG2 cells transfected with or without siILF3. L) Effect of ILF3 knockdown on sorafenib sensitivity in HepG2 cells. The cells were treated for 72 h. Cell viability was measured by CCK‐8 assay (n = 3). M) Effect of ILF3 knockdown and/or sorafenib treatment on ROS accumulation in HepG2 cells measured by DCFH‐DA probe (n = 3). N) Effect of ILF3 knockdown on mitochondrial mass in HepG2 cells measured by mitotracker green probe (n = 3). O) Oxygen consumption rate (OCR) analysis using Seahorse analysis revealed compromised mitochondrial function in HepG2 cells transfected with siMRPL12 and/or ILF3‐Flag. Basal respiration, ATP production, maximal respiration, and spare respiratory capacity were identified, respectively (n = 3). Data are presented as mean ± SEM. t test, *P < 0.05, **P < 0.01, ***P < 0.001, and ****P < 0.0001.
Figure 6
Figure 6
ILF3 is a transcriptional activator of MRPL12. A) The mRNA (n = 3) and B) protein expression of MRPL12 in HepG2 cells with or without ILF3 knockdown. C) The mRNA expression of ILF3 downstream target genes, including IL2, IL13, uPA and Survivin in HepG2 cells treated with lefamulin and/or sorafenib (n = 3). D) The construction of pGL4‐Luc reporter plasmids containing DNA fragments serially deleted from ‐2000 to +200 bp or mutant of the MRPL12 promoter. E) Fold change in luciferase activity driven by MRPL12‐promoter reporter under ILF3 siRNA or control siRNA transfection in HepG2 cells (n = 3). F) ChIP assays to determine the enrichment of ILF3 protein in the MRPL12 promoter in HepG2 cells (n = 3). G) Fold change in luciferase activity driven by MRPL12‐mutant promoter reporter under ILF3 siRNA or control siRNA treatment, or lefamulin and/or sorafenib treatment in HepG2 cells (n = 3). H) ChIP assays were used to determine the enrichment of ILF3 protein in the MRPL12 promoter under the treatment of lefamulin and/or sorafenib in HepG2 cells (n = 3). Data are presented as mean ± SEM. t test, *P < 0.05, **P < 0.01, ***P < 0.001, ****P < 0.0001, and n.s., not significant.
Figure 7
Figure 7
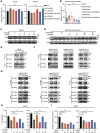
Lefamulin inhibits GCN5/CBP‐mediated acetylation of ILF3 and subsequent transcriptional activation. A,B) RT‐qPCR was carried out to examine mRNA expression of ILF3 in A) HepG2, HCCLM3 cells (n = 3) and B) HepG2‐derived xenografts (n = 6) treated with lefamulin and/or sorafenib. C,D) Western blot was carried out to examine protein expression of ILF3 in C) HepG2 cells and D) HepG2‐derived xenografts treated with lefamulin and/or sorafenib. E,F) Western blot was carried out to examine the expression of E) acetylated ILF3 or F) acetylated Flag‐ILF3 in HepG2 cells in the presence or absence of 20 × 10−6 m lefamulin. G) Western blot was carried out to examine the interaction between ILF3 and GCN5 or CBP in HepG2 cells transfected with ILF3WT‐Flag, ILF3A99E‐Flag or ILF3L100R‐Flag in the presence or absence of 20 × 10−6 m lefamulin. H) Cell viability was examined in GCN5 or CBP‐knockdown HepG2 cells treated with 5 × 10⁻⁶ m sorafenib by CCK‐8 assay (n = 3). I) Luciferase activity was examined in GCN5 or CBP knockdown HepG2 cells treated with 20 × 10−6 m lefamulin by dual luciferase analysis kit (n = 3). Data are presented as mean ± SEM. t test, *P < 0.05 and **P < 0.01.
Figure 8
Figure 8
Lefamulin sensitized HCC cells to sorafenib and regorafenib in an immune‐competent mouse model. A) Schematic diagram of the treatment regimen with sorafenib/regorafenib, lefamulin alone or the combination of sorafenib/regorafenib with lefamulin, n = 7. B,F) Liver weight, liver/body weight ratio and C,G) number of tumors in hydrodynamic injection animal model were shown (n = 7). D,H) Representative gross images of HCC tumors, H&E staining (Scale bar, 2.5 mm (left), 100 µm (right)) and IHC images of MRPL12, ILF3 and Ki67 (Scale bar, 50 µm) in hydrodynamic injection animal model. E,I) Quantification of MRPL12, ILF3 and Ki67 expression (n = 7). Data are presented as mean ± SEM. t test, *P < 0.05, **P < 0.01, ***P < 0.001, and ****P < 0.0001.
Figure 9
Figure 9
Schematic diagram summarizing how lefamulin overcomes sorafenib resistance via ILF3‐MRPL12 axis. Lefamulin directly targets Ala‐99 site of ILF3 and interferes with GCN5 and CBP‐mediated acetylation of Lys‐100, thus disrupting the ILF3‐mediated transcription of MRPL12 and subsequent mitochondrial biogenesis, mediating sorafenib resistance.

References

    1. Siegel R. L., Miller K. D., Fuchs H. E., Jemal A., Ca‐ Cancer J. Clin. 2022, 72, 7. - PubMed
    1. Cheng A.‐L., Kang Y.‐K., Chen Z., Tsao C.‐J., Qin S., Kim J. S., Luo R., Feng J., Ye S., Yang T.‐S., Xu J., Sun Y., Liang H., Liu J., Wang J., Tak W. Y., Pan H., Burock K., Zou J., Voliotis D., Guan Z., Lancet Oncol. 2009, 10, 25. - PubMed
    1. Bruix J., Qin S., Merle P., Granito A., Huang Y. H., Bodoky G., Pracht M., Yokosuka O., Rosmorduc O., Breder V., Gerolami R., Masi G., Ross P. J., Song T., Bronowicki J. P., Ollivier‐Hourmand I., Kudo M., Cheng A. L., Llovet J. M., Finn R. S., LeBerre M. A., Baumhauer A., Meinhardt G., Han G., Investigators R., Lancet 2017, 389, 56. - PubMed
    1. Bruix J., da Fonseca L. G., Reig M., Nat. Rev. Gastroenterol. Hepatol. 2019, 16, 617. - PubMed
    1. Llovet S. R. J. M., Mazzaferro V., Hilgard P., Gane E., Blanc J. F., Oliveira A. C., Santoro A., Raoul J. L., Forner A., Schwartz M., Porta C., Zeuzem S., Bolondi L., Greten T. F., Galle P. R., Seitz J. F., Borbath I., Häussinger D., Giannaris T., Shan M., Moscovici M., Voliotis D., Bruix J., N. Engl. J. Med. 2008, 359, 378. - PubMed

MeSH terms

LinkOut - more resources