. 2024 Sep 3;12(9):1286-1301.
doi: 10.1158/2326-6066.CIR-23-0289.

PlexinB1 Inactivation Reprograms Immune Cells in the Tumor Microenvironment, Inhibiting Breast Cancer Growth and Metastatic Dissemination

Affiliations

PlexinB1 Inactivation Reprograms Immune Cells in the Tumor Microenvironment, Inhibiting Breast Cancer Growth and Metastatic Dissemination

Giulia Franzolin et al. Cancer Immunol Res. .

Abstract

Semaphorin-plexin signaling plays a major role in the tumor microenvironment (TME). In particular, Semaphorin 4D (SEMA4D) has been shown to promote tumor growth and metastasis; however, the role of its high-affinity receptor Plexin-B1 (PLXNB1), which is expressed in the TME, is poorly understood. In this study, we directly targeted PLXNB1 in the TME of triple-negative murine breast carcinoma to elucidate its relevance in cancer progression. We found that primary tumor growth and metastatic dissemination were strongly reduced in PLXNB1-deficient mice, which showed longer survival. PLXNB1 loss in the TME induced a switch in the polarization of tumor-associated macrophages (TAM) toward a pro-inflammatory M1 phenotype and enhanced the infiltration of CD8+ T lymphocytes both in primary tumors and in distant metastases. Moreover, PLXNB1 deficiency promoted a shift in the Th1/Th2 balance of the T-cell population and an antitumor gene signature, with the upregulation of Icos, Perforin-1, Stat3, and Ccl5 in tumor-infiltrating lymphocytes (TILs). We thus tested the translational relevance of TME reprogramming driven by PLXNB1 inactivation for responsiveness to immunotherapy. Indeed, in the absence of PLXNB1, the efficacy of anti-PD-1 blockade was strongly enhanced, efficiently reducing tumor growth and distant metastasis. Consistent with this, pharmacological PLXNB1 blockade by systemic treatment with a specific inhibitor significantly hampered breast cancer growth and enhanced the antitumor activity of the anti-PD-1 treatment in a preclinical model. Altogether, these data indicate that PLXNB1 signaling controls the antitumor immune response in the TME and highlight this receptor as a promising immune therapeutic target for metastatic breast cancers.


Conflict of interest statement

J. Takagi reports grants from Japan Agency for Medical Research and Development (AMED) during the conduct of the study and has a patent for WO2019026920A1 issued, licensed, and with royalties paid from MiraBiologics Inc. Dr. J. Takagi is a cofounder and shareholder of MiraBiologics Inc. No disclosures were reported by the other authors.

Figures

Figure 1.
Figure 1.
PLXNB1 expression in the TME sustains tumor growth and metastatic dissemination in TNBC models. A–E,PLXNB1 expression in the 4T1 tumor microenvironment sustains tumor growth, and it is critical for metastatic dissemination. 1 × 10⁶ 4T1 cells were injected in the mammary fat pad of female Balb/c WT and Plxnb1−/− mice. Graph bars indicate (A) mean tumor volume ± SEM. B, mean tumor weight ± SEM. C, Mean metastasis number ± SEM. D, Mean metastatic index (number of lung metastasis/tumor weight) ± SEM. Results were analyzed by unpaired Student t test. **, P < 0.01; ***, P < 0.001 (n = 12 mice). E, Survival curve of female 4T1 WT and Plxnb1−/− mice injected in the mammary fat pad with 1 × 10⁶ 4T1 cells. Animals were euthanized when tumors reached the volume of 700 mm3. Results were analyzed by log-rank (Mantel–Cox) test, ****, P < 0.0001 (n = 8 mice). F and G,PLXNB1 expression in the Py230 tumor microenvironment supports tumor growth. F, Individual tumor growth curve of C57/BL6 WT and Plxnb1−/− mice injected in the mammary fat pad with 4 × 10⁶ Py230 cells (n = 6 mice). G, Survival curve of female C57/BL6 WT and Plxnb1−/− mice injected in the mammary fat pad with 4 × 10⁶ Py230 cells. Animals were euthanized when tumors reached the volume of 500 mm3. Results were analyzed by log-rank (Mantel–Cox) test, ***, P < 0.001 (n = 6 mice).
Figure 2.
Figure 2.
PLXNB1 and SEMA4D expression in different immune populations of the TME and their contribution on tumor growth in 4T1 mice. A, PLXNB1 and (B) SEMA4D gene expression evaluated by RT-PCR analysis on RNA extracted from different cell population (CD4+, CD8+, CD11b+, F4/80+, CD31+ cells) purified from 4T1 tumors and in 4T1 cells. Graph bars represent average ± SEM mRNA transcripts per 104 β-actin copies, based on triplicate samples per each cell type (see “Materials and Methods” for details). C, 1 × 10⁶ 4T1 cells were injected in the mammary fat pad of female Balb/c WT, Sema4d−/−, and Plxnb1/ mice. Graph bars indicate mean tumor weight ± SEM. Results were analyzed by unpaired Student t test. *, P < 0.05; **, P < 0.01 (n = 5 mice).
Figure 3.
Figure 3.
PLXNB1 depletion enhances M1-like macrophages in the TME and CD11c+ APC infiltration. A–C,PLXNB1 deficiency reprograms macrophages toward a M1 pro-inflammatory phenotype. Representative images of (A) CD68 (green) and iNOS (red) or (B) CD68 (green) and MRC1 (red) immunofluorescence staining of 4T1 tumors from WT and Plxnb1/ tumors. In A and B M2 and M1 polarization was evaluated, respectively, as the percentage of MRC1 or iNOS fluorescence signal overlapping the CD68 channel using ImageJ “colocalization” plugin and normalized to total macrophage area ± SEM. Results were analyzed by unpaired Student t test. *, P < 0.05 (n = 6 tumors). Scale bars, 75 μm. C, Representative dot plots of whole 4T1 tumor digests analyzed with flow cytometry. Graph bars represent the percentage of CD206+ or iNOS+ on F4/80+ cells, gated on CD11b+ and CD45+ live cells. Results were analyzed by unpaired Student t test. **, P < 0.01 (n = 7 tumors). D,Increased number of infiltrating CD11c+APCs in tumors grown in Plxnb1−/−mice. CD11c immunofluorescence staining of 4T1 tumors from WT and Plxnb1/ tumors. CD11c immunofluorescence staining quantification, measured as a positive area percentage (%) ± SEM. Results were analyzed by unpaired Student t test. *, P < 0.05 (n = 6 tumors). Scale bars, 75 μm.
Figure 4.
Figure 4.
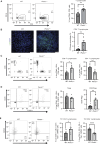
PLXNB1 depletion induces cytotoxic CD8+ T-cell recruitment in the TME and a shift toward a Th1 phenotype. A, Representative dot plots of 4T1 whole tumor digests analyzed with flow cytometry. Graph bars represent the percentage of CD3+ cells on CD45+ live cells (n = 7 tumors). B, CD8 immunofluorescence staining of 4T1 tumors from WT and Plxnb1−/− mice (n = 6 tumors). Scale bars, 75 μm. C, Representative dot plots of 4T1 whole tumor digests analyzed with flow cytometry. Graph bars represent the percentage of CD8+ or CD4+ on CD3+ cells, gated on CD3+ and CD45+ live cells (n = 7 tumors). D, Representative dot plots of 4T1 whole tumor digests analyzed with flow cytometry. Graph bars represent the percentage of CD25+ and Foxp3+ on CD4+ T cells, gated on CD3+ and CD45+ live cells (n = 7 tumors). E, Representative dot plots of 4T1 whole tumor digests analyzed with flow cytometry. Graph bars represent the percentage of Tbet+ (Th1) and Gata3+ (Th2) on CD4+ T cells, gated on CD3+ and CD45+ live cells (n = 7 tumors). Results were analyzed by unpaired Student t test. *, P < 0.05; **, P < 0.01; ****, P < 0.0001.
Figure 5.
Figure 5.
PlexinB1 deficiency activates and reprograms T cells toward an antitumor phenotype. A–D,Increased levels of IFNγ in the TME of Plxnb1−/−mice. A, IFNγ immunofluorescence staining of 4T1 tumors from WT and Plxnb1−/− mice. B, IFNγ immunofluorescence staining quantification was measured as a positive area percentage (%) ± SEM. Results were analyzed by unpaired Student t test. **, P < 0.01 (n = 6 tumors). Scale bars, 75 μm. C, Representative dot plots of 4T1 whole tumor digests analyzed with flow cytometry for CD8+ T cells and IFNγ. D, Graph bars represent the percentage of IFNγ + CD8+ T cells on CD3+ cells, gated on CD45+ live cells (n = at least 4 tumors). Results were analyzed by unpaired Student t test. **, P < 0.01. E and F,Increased levels of GrzB in the TME of Plxnb1−/−mice.E, Representative histograms of CD8+ T-cell GrzB expression. F, MFI was assessed in flow cytometry. Results were analyzed by unpaired Student t test. *, P < 0.05 (n = at least 6 tumors). G,CD8+T-cell proliferation is increased in Plxnb1−/−mice. Representative images of IF staining of 4T1 tumors from WT and Plxnb1/ tumors for CD8 in green and Ki67 in red. Ki67/CD8 colocalization signal, shown in yellow, was evaluated using ImageJ “colocalization” plugin and normalized to total CD8 area. Results were analyzed by unpaired Student t test. *, P < 0.05. Scale bars, 75 μm (n = 5 tumors). H,Transcriptional changes induced by PlexinB1 deficiency in TILs. Heatmap representation of the most up- and downregulated genes identified by the Taqman Mouse Immune Array (fold change >2 and P < 0.05). Color gradient represents a log2 fold change scale.
Figure 6.
Figure 6.
PLXNB1 inactivation enhances the efficacy of anti-PD-1 immunotherapy hampering tumor growth. A–C, CD8 + T-cell recruitment to tumors grown in Plxnb1 −/− mice contributes to the reduction of tumor growth and metastatic burden. A, Schematic representation of experimental design. 1 × 10⁶ 4T1 cells were injected in the mammary fat pad of female Balb/c WT and Plxnb1/ mice at day 0. Anti-CD8 antibody treatment (200 μg IP) or saline solution as negative control (nt) was given at days −1, 0, 1, and 8. B, Bar graphs indicate average tumor weight ± SEM. C, Bar graphs indicate average lung metastasis number ± SEM. Results were analyzed by unpaired Student t test. *, P < 0.05; **, P < 0.01 (n = at least 5 mice). D–F,PLXNB1 inactivation enhances the efficacy of anti-PD-1 immunotherapy in 4T1 mice.D, Schematic representation of experimental design. 1 × 10⁶ 4T1 cells were injected in the mammary fat pad of female Balb/c WT and Plxnb1/ mice at day 0. Anti-PD-1 antibody treatment (250 μg IP) or saline solution as a negative control (nt) was given every 4 days starting from day 7. E, Bar graphs indicate tumor weight at explant ± SEM. F, Bar graphs indicate average lung metastasis number ± SEM. Results were analyzed by unpaired Student t test. *, P < 0.05; **, P < 0.01; ***, P < 0.001; ****, P < 0.0001 (n = 5 mice).
Figure 7.
Figure 7.
Pharmacological inhibition of PLXNB1 inhibits tumor growth and synergizes with anti- PD-1 treatment. A–C, Pharmacological inhibition of PLXNB1 reduces tumor growth. A, Schematic representation of experimental design. 4 × 10⁶ Py230 cells were injected in the mammary fat pad of female C57BL/6 mice at day 0. Fc(m6A9)B3 or Fc control was administered intravenously once a week for 3 weeks at a dosage of 400 µg starting at 4 weeks post Py230 tumor inoculation. B, Tumor growth curve. Results were analyzed by two-way ANOVA. ****, P < 0.0001 (n = 8 mice). C, Bar graphs indicate tumor weight at explant ± SEM. Results were analyzed by unpaired Student t test. *, P < 0.05 (n = 8 mice). D and E,PLXNB1 blockade synergizes with anti-PD-1 treatment.D, Schematic representation of experimental design. 4 × 10⁶ Py230 cells were injected in the mammary fat pad of female C57BL/6 mice at day 0. Fc(m6A9)B3 or Fc control was administered intravenously once a week for 3 weeks at a dosage of 400 µg starting at 4 weeks post Py230 tumor inoculation. Anti-PD-1 antibody treatment (250 μg IP) was given twice a week starting at 4 weeks post tumor inoculation. E, Bar graphs indicate tumor weight at explant ± SEM. Results were analyzed by unpaired Student t test. *, P < 0.05; **, P < 0.01 (n = 5 mice).

Similar articles

Cited by

  • Molecular Underpinnings of Brain Metastases.
    Jacome MA, Wu Q, Chen J, Mohamed ZS, Mokhtari S, Piña Y, Etame AB. Jacome MA, et al. Int J Mol Sci. 2025 Mar 5;26(5):2307. doi: 10.3390/ijms26052307. Int J Mol Sci. 2025. PMID: 40076927 Free PMC article. Review.

References

    1. Coughlin SS. Epidemiology of breast cancer in women. Adv Exp Med Biol 2019;1152:9–29. - PubMed
    1. de Visser KE, Joyce JA. The evolving tumor microenvironment: from cancer initiation to metastatic outgrowth. Cancer Cell 2023;41:374–403. - PubMed
    1. Duan Q, Zhang H, Zheng J, Zhang L. Turning cold into hot: firing up the tumor microenvironment. Trends Cancer 2020;6:605–18. - PubMed
    1. de Melo Gagliato D, Buzaid AC, Perez-Garcia J, Cortes J. Immunotherapy in breast cancer: current practice and clinical challenges. BioDrugs 2020;34:611–23. - PubMed
    1. Mastrantonio R, You H, Tamagnone L. Semaphorins as emerging clinical biomarkers and therapeutic targets in cancer. Theranostics 2021;11:3262–77. - PMC - PubMed

MeSH terms