

Diagnostic potential of endothelin-1 in peri-implant diseases: a cross-sectional study
- PMID: 38874661
- PMCID: PMC11178717
- DOI: 10.1186/s40729-024-00551-0
Diagnostic potential of endothelin-1 in peri-implant diseases: a cross-sectional study
Abstract
Purpose: This study aimed to evaluate the potential of Endothelin-1 (ET-1), a peptide derived from vascular endothelial cells, as a biomarker for diagnosing peri-implant diseases.
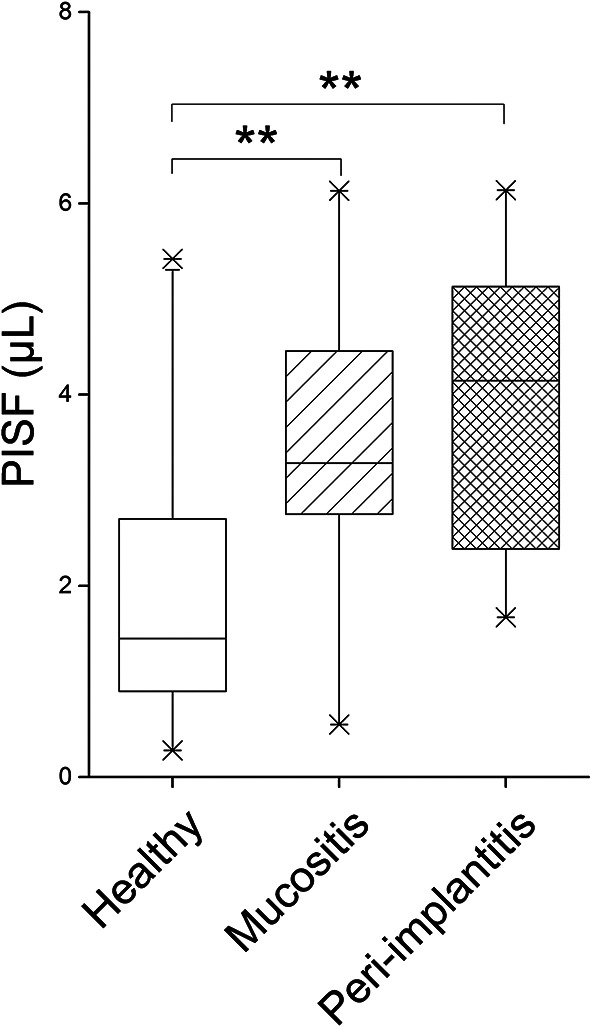
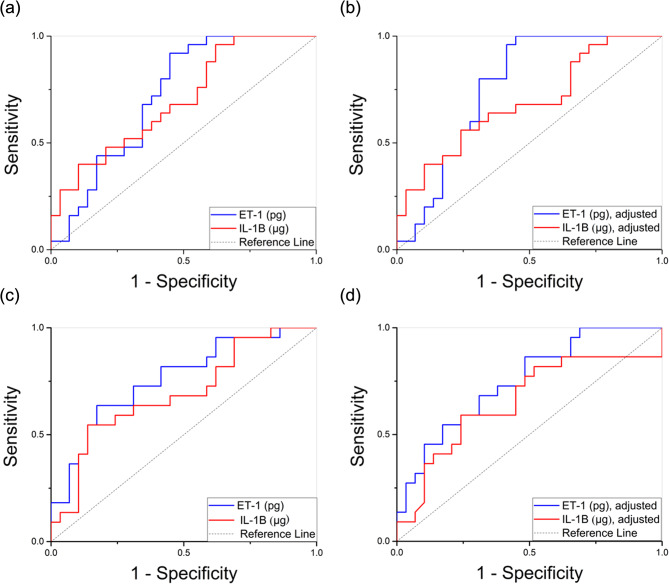
Methods: A cohort of 29 patients with a total of 76 implants was included in this study and subsequently divided into three groups based on peri-implant clinical parameters and radiographic examination: healthy (peri-implant health) (n = 29), mucositis (n = 22), and peri-implantitis (n = 25) groups. The levels of ET-1 (ρg/site) and interleukin (IL)-1β (ρg/site) in peri-implant sulcus fluid (PISF) samples were determined using enzyme immunoassay. Statistical analyses were conducted using Kruskal-Wallis and Steel-Dwass tests. Logistic regression and receiver operating characteristic (ROC) curve analyses were performed to evaluate the diagnostic performance of the biomarkers.
Results: ET-1 levels were significantly elevated in the peri-implantitis group compared to those in the healthy group, and were highest in the peri-implant mucositis group. Additionally, IL-1β levels were significantly higher in the peri-implantitis group than those in the healthy group. ROC curve analysis indicated that ET-1 exhibited superior area under the curve values, sensitivity, and specificity compared to those of IL-1β.
Conclusions: Our findings suggest that the presence of ET-1 in PISF plays a role in peri-implant diseases. Its significantly increased expression in peri-implant mucositis indicates its potential for enabling earlier and more accurate assessments of peri-implant inflammation when combined with conventional examination methods.
Keywords: Endothelin-1; Interleukin-1β; Marginal bone loss; Peri-implant mucositis; Peri-implantitis.
© 2024. The Author(s).
Conflict of interest statement
The authors declare no competing interests.
Figures


Similar articles
-
A controlled, cross-sectional exploratory study on markers for the plasminogen system and inflammation in crevicular fluid samples from healthy, mucositis and peri-implantitis sites.Eur J Oral Implantol. 2015 Summer;8(2):153-66. Eur J Oral Implantol. 2015. PMID: 26021226 Clinical Trial.
-
Diagnostic accuracy of bone-related biomarkers on peri-implantitis: potential of A-proliferation-inducing ligand.BMC Oral Health. 2025 Jul 25;25(1):1240. doi: 10.1186/s12903-025-06578-y. BMC Oral Health. 2025. PMID: 40713636 Free PMC article.
-
Diagnostic value of aMMP-8 and azurocidin in peri-implant sulcular fluid as biomarkers of peri-implant health or disease.Clin Exp Dent Res. 2024 Jun;10(3):e883. doi: 10.1002/cre2.883. Clin Exp Dent Res. 2024. PMID: 38853451 Free PMC article.
-
Use of IL-1 β, IL-6, TNF-α, and MMP-8 biomarkers to distinguish peri-implant diseases: A systematic review and meta-analysis.Clin Implant Dent Relat Res. 2019 Feb;21(1):190-207. doi: 10.1111/cid.12694. Epub 2018 Dec 3. Clin Implant Dent Relat Res. 2019. PMID: 30508312
-
Oral Fluid Biomarkers for Peri-Implantitis: A Scoping Review.Int Dent J. 2024 Jun;74(3):387-402. doi: 10.1016/j.identj.2023.11.005. Epub 2023 Dec 8. Int Dent J. 2024. PMID: 38065782 Free PMC article.
Cited by
-
Changes of maternal carotid artery elasticity in patients with pregnancy concurred with hypertension.Arch Gynecol Obstet. 2025 Mar;311(3):731-740. doi: 10.1007/s00404-025-07941-8. Epub 2025 Feb 5. Arch Gynecol Obstet. 2025. PMID: 39907747 Free PMC article.
-
Validation of endothelin-1 and interleukin-1β as a biomarker for diagnosing peri-implant disorders.Bioinformation. 2024 Sep 30;20(9):1148-1153. doi: 10.6026/9732063002001148. eCollection 2024. Bioinformation. 2024. PMID: 39917223 Free PMC article.
References
-
- Derks J, Tomasi C. Peri-implant health and disease. A systematic review of current epidemiology. J Clin Periodontol. 2015;42(Suppl 16):S158–171. - PubMed
-
- Heitz-Mayfield LJA, Salvi GE. Peri-implant mucositis. J Clin Periodontol. 2018;45(Suppl 20):S237–45. - PubMed
-
- Schwarz F, Derks J, Monje A, Wang HL. Peri-implantitis. J Periodontol. 2018;89(Suppl 1):S267–90. - PubMed
-
- Jepsen S, Berglundh T, Genco R, Aass AM, Demirel K, Derks J, et al. Primary prevention of peri-implantitis: managing peri-implant mucositis. J Clin Periodontol. 2015;42(Suppl 16):S152–157. - PubMed
MeSH terms
Substances
Grants and funding
- 20K10075 and 23K09298/Japan Society for the Promotion of Science
- 20K10075 and 23K09298/Japan Society for the Promotion of Science
- 20K10075 and 23K09298/Japan Society for the Promotion of Science
- 20K10075 and 23K09298/Japan Society for the Promotion of Science
- 20K10075 and 23K09298/Japan Society for the Promotion of Science
LinkOut - more resources
Full Text Sources
Molecular Biology Databases
