

Methanol as a co-substrate with CO2 enhances butyrate production in microbial electrosynthesis
- PMID: 38874789
- PMCID: PMC11178620
- DOI: 10.1007/s00253-024-13218-y
Methanol as a co-substrate with CO2 enhances butyrate production in microbial electrosynthesis
Abstract
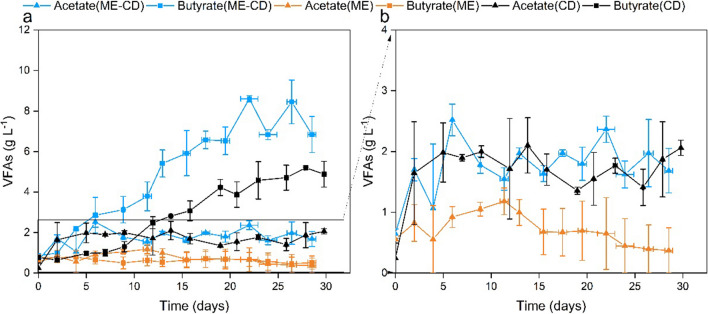
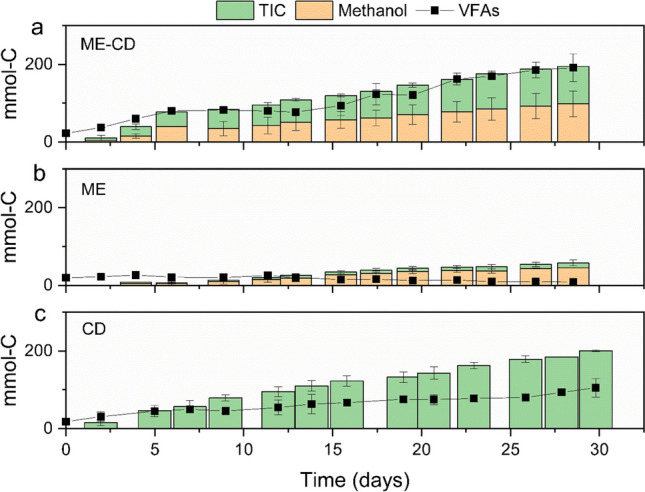
Methanol is a promising feedstock for the bio-based economy as it can be derived from organic waste streams or produced electrochemically from CO2. Acetate production from CO2 in microbial electrosynthesis (MES) has been widely studied, while more valuable compounds such as butyrate are currently attracting attention. In this study, methanol was used as a co-substrate with CO2 to enhance butyrate production in MES. Feeding with CO2 and methanol resulted in the highest butyrate production rates and titres of 0.36 ± 0.01 g L-1 d-1 and 8.6 ± 0.2 g L-1, respectively, outperforming reactors with only CO2 feeding (0.20 ± 0.03 g L-1 d-1 and 5.2 ± 0.1 g L-1, respectively). Methanol acted as electron donor and as carbon source, both of which contributed ca. 50% of the carbon in the products. Eubacterium was the dominant genus with 52.6 ± 2.5% relative abundance. Thus, we demonstrate attractive route for the use of the C1 substrates, CO2 and methanol, to produce mainly butyrate. KEY POINTS: • Butyrate was the main product from methanol and CO2 in MES • Methanol acted as both carbon and electron source in MES • Eubacterium dominating microbial culture was enriched in MES.
Keywords: Butyrate; CO2 utilisation; Electron donor; Methanol utilisation; Microbial electrosynthesis.
© 2024. The Author(s).
Conflict of interest statement
This study was funded by the Research Council of Finland (grant number 329227). Furthermore, the Research Council of Finland (Bio and Circular Economy Research Infrastructure (decision no. 353658)) is gratefully acknowledged. Authors declare that they have no competing interests that are relevant to the content of this article. This article does not contain any studies with human participants or animals performed by any of the authors.
Figures


References
-
- Anderson MJ (2008) A new method for non-parametric multivariate analysis of variance. Austral Ecol 26:32–46. 10.1111/j.1442-9993.2001.01070.pp.x - DOI
-
- Aresta M, Dibenedetto A (2007) Utilisation of CO2 as a chemical feedstock: opportunities and challenges. Dalton Trans 2975–2992. 10.1039/B700658F - PubMed
-
- Bache R, Pfennig N (1981) Selective isolation of Acetobacterium woodii on methoxylated aromatic acids and determination of growth yields. Arch Microbiol 130:255–261. 10.1007/BF00459530 - DOI
-
- Balch WE, Schoberth S, Tanner RS, Wolfe RS (1977) Acetobacterium, a new genus of hydrogen-oxidizing, carbon dioxide-reducing, anaerobic bacteria. Int J Syst Bacteriol 27:355–361. 10.1099/00207713-27-4-355 - DOI
MeSH terms
Substances
Grants and funding
LinkOut - more resources
Full Text Sources
Miscellaneous
