

Analysis of PM2.5, black carbon, and trace metals measurements from the Kansas City Transportation and Local-Scale Air Quality Study (KC-TRAQS)
- PMID: 38874903
- PMCID: PMC11361304
- DOI: 10.1080/10962247.2024.2365708
Analysis of PM2.5, black carbon, and trace metals measurements from the Kansas City Transportation and Local-Scale Air Quality Study (KC-TRAQS)
Abstract
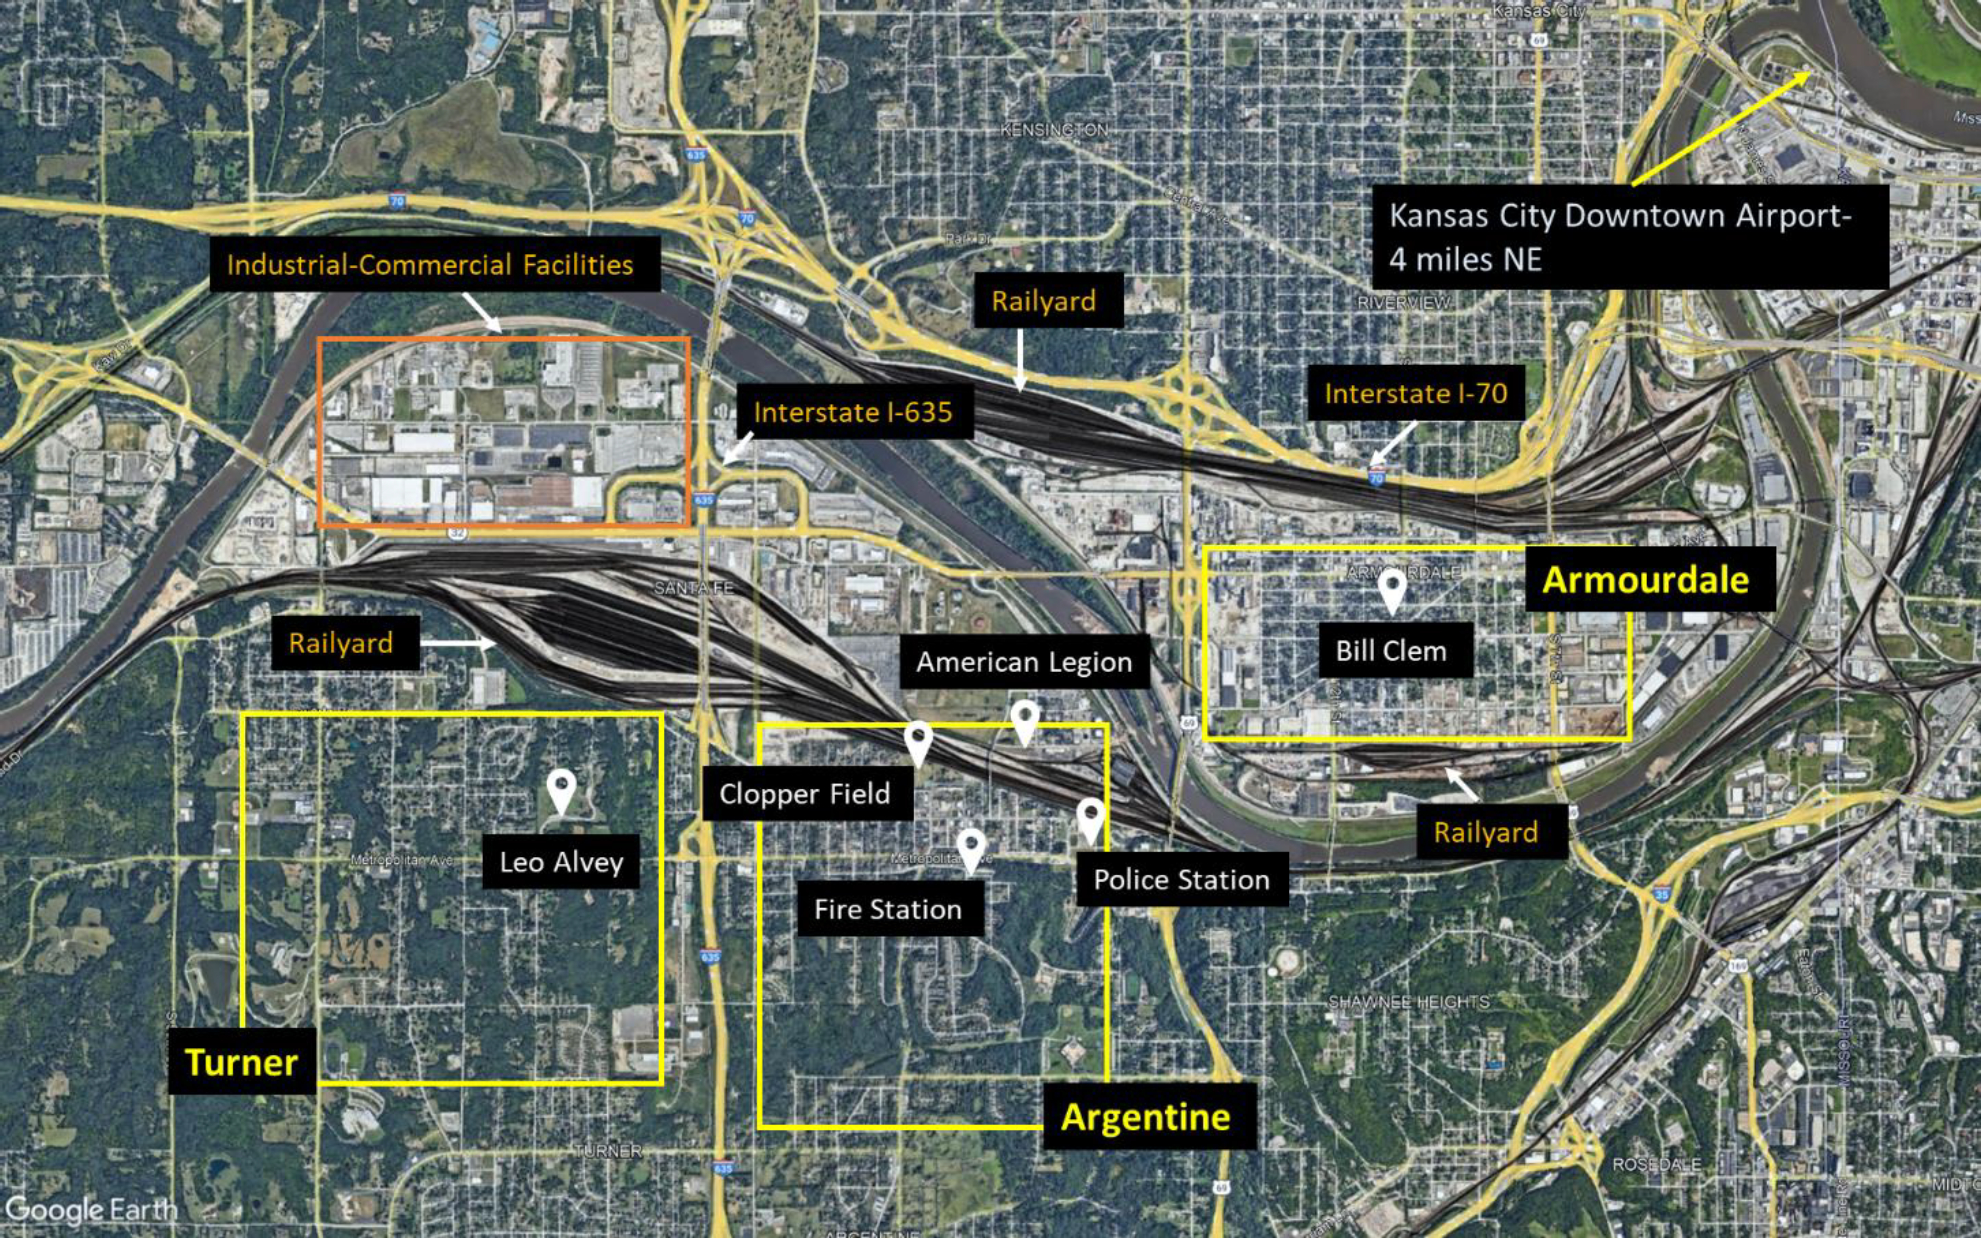
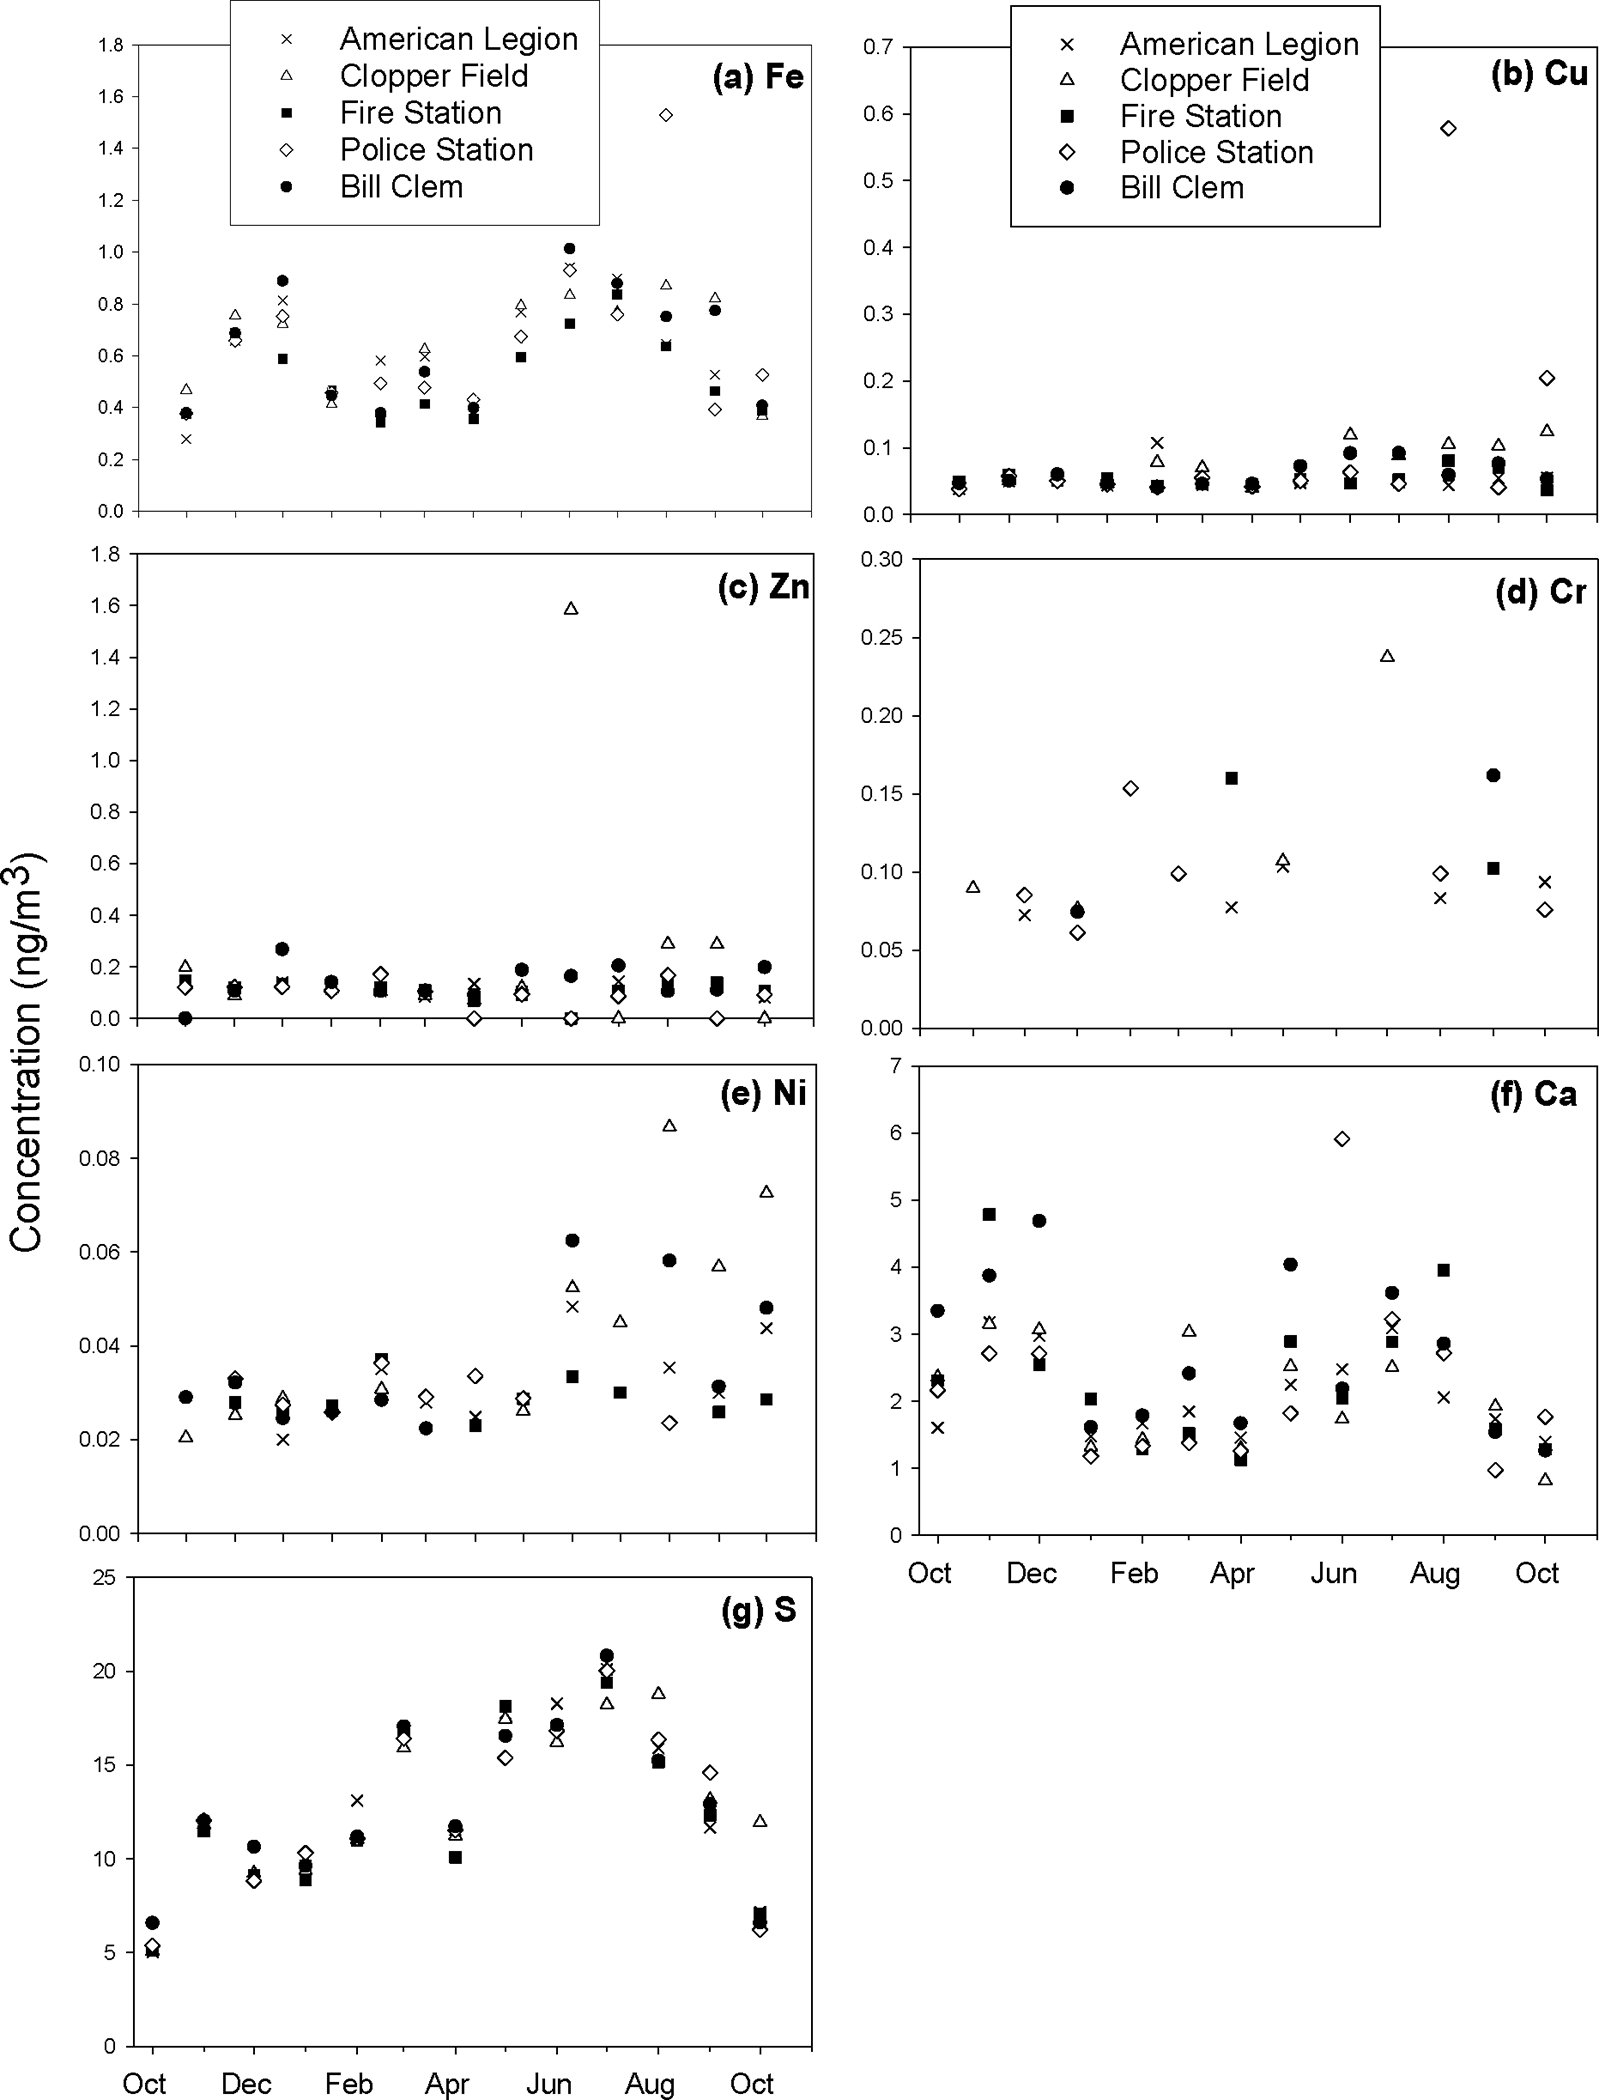
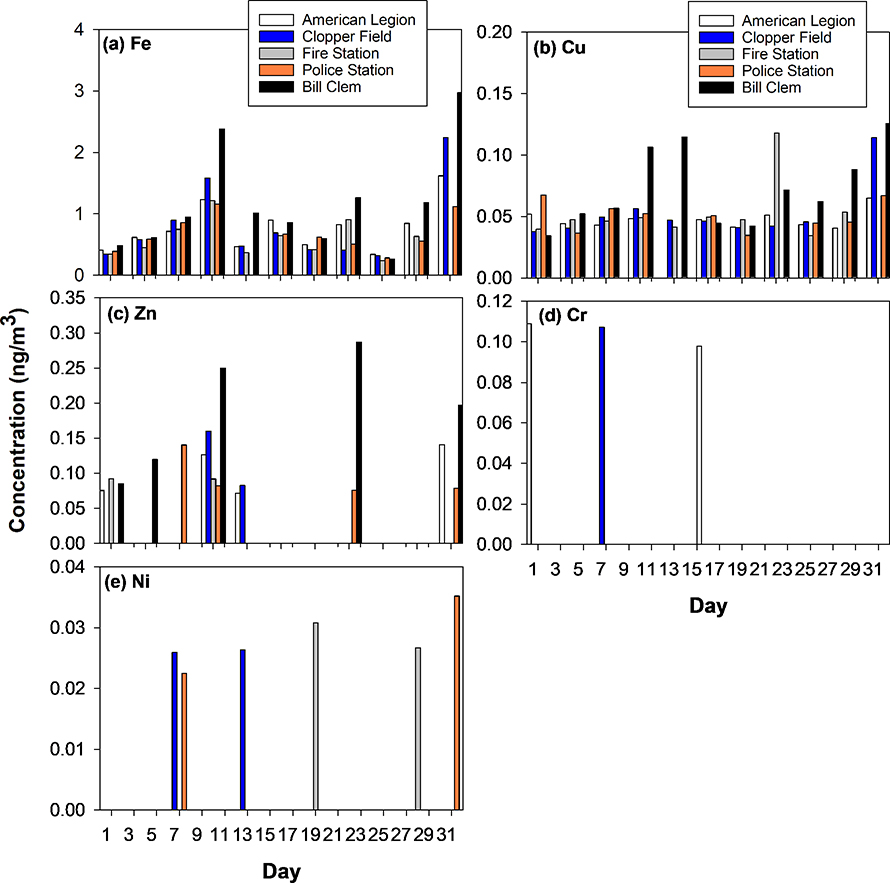
Communities near transportation sources can be impacted by higher concentrations of particulate matter (PM) and other air pollutants. Few studies have reported on air quality in complex urban environments with multiple transportation sources. To better understand these environments, the Kansas City Transportation and Local-Scale Air Quality Study (KC-TRAQS) was conducted in three neighborhoods in Southeast Kansas City, Kansas. This area has several emissions sources including transportation (railyards, vehicles, diesel trucks), light industry, commercial facilities, and residential areas. Stationary samples were collected for 1-year (October 24, 2017, to October 31, 2018) at six sites using traditional sampling methods and lower-cost air sensor packages. This work examines PM less than 2.5 μm in diameter (PM2.5), black carbon (BC), and trace metals data collected during KC-TRAQS. PM2.5 filter samples showed the highest 24-h mean concentrations (9.34 μg/m3) at the sites located within 20-50 m of the railyard. Mean 24-h PM2.5 concentrations, ranging from 7.96 to 9.34 μg/m3, at all sites were lower than that of the nearby regulatory site (9.83 μg/m3). Daily maximum PM2.5 concentrations were higher at the KC-TRAQS sites (ranging from 25.31 to 43.76 μg/m3) compared to the regulatory site (20.50 μg/m3), suggesting short-duration impacts of localized emissions sources. Across the KC-TRAQS sites, 24-h averaged PM2.5 concentrations from the sensor package (P-POD) ranged from 3.24 to 5.69 µg/m3 showing that, out-of-the-box, the PM sensor underestimated the reference concentrations. KC-TRAQS was supplemented by elemental and organic carbon (EC/OC) and trace metal analysis of filter samples. The EC/OC data suggested the presence of secondary organic aerosol formation, with the highest mean concentrations observed at the site within 20 m of the railyard. Trace metals data showed daily, monthly, and seasonal variations for iron, copper, zinc, chromium, and nickel, with elevated concentrations occurring during the summer at most of the sites.Implications: This work reports on findings from a year-long air quality study in Southeast Kansas City, Kansas to understand micro-scale air quality in neighborhoods impacted by multiple emissions sources such as transportation sources (including a large railyard operation), light industry, commercial facilities, and residential areas. While dozens of studies have reported on air quality near roadways, this work will provide more information on PM2.5, black carbon, and trace metals concentrations near other transportation sources in particular railyards. This work can also inform additional field studies near railyards.
Figures
Similar articles
-
Temporal dynamics between COVID-19 cases and particulate matter in Bangkok: Impact of lockdown policies on air quality and disease transmission.J Air Waste Manag Assoc. 2025 Aug 19. doi: 10.1080/10962247.2025.2547642. Online ahead of print. J Air Waste Manag Assoc. 2025. PMID: 40828967
-
Modeling attainment in Fairbanks, Alaska, for the wintertime PM2.5 24-hour non-attainment area using the CMAQ (community multi-scale air quality) model.Faraday Discuss. 2025 Jun 16;258(0):234-264. doi: 10.1039/d4fd00158c. Faraday Discuss. 2025. PMID: 40042620
-
Effects of city design on transport mode choice and exposure to health risks during and after a crisis: a retrospective observational analysis.Lancet Planet Health. 2025 Jun;9(6):e467-e479. doi: 10.1016/S2542-5196(25)00088-9. Lancet Planet Health. 2025. PMID: 40516538
-
Estimates of emissions from hydrogen transportation fueling infrastructure and vehicles.J Air Waste Manag Assoc. 2025 Jul;75(7):559-590. doi: 10.1080/10962247.2025.2495811. Epub 2025 Jun 16. J Air Waste Manag Assoc. 2025. PMID: 40327627 Review.
-
The Black Book of Psychotropic Dosing and Monitoring.Psychopharmacol Bull. 2024 Jul 8;54(3):8-59. Psychopharmacol Bull. 2024. PMID: 38993656 Free PMC article. Review.
References
-
- Baldauf R, Thoma E, Hays M, Shores R, Kinsey J, Gullett B, Kimbrough S, Isakov V, Long T, Snow R, Khlystov A, Weinstein J, Chen FL, Seila R, Olson D, Gilmour I, Cho SH, Watkins N, Rowley P, and Bang J, Traffic and meteorological impacts on near-road air quality: Summary of methods and trends from the Raleigh near-road study. Journal of the Air & Waste Management Association, 2008. 58(7): p. 865–878. - PubMed
-
- Birch ME and Cary RA Elemental carbon-based method for monitoring occupational exposures to particulate diesel exhaust. Aerosol Science & Technology, 1996, 25, 221–241. - PubMed
-
- Breysse PN, Delfino RJ, Dominici F, Elder ACP, Frampton MW, Froines JR, Geyh AS, Godleski JJ, Gold DR, Hopke PK, Koutrakis P, Li N, Oberdörster G, Pinkerton KE, Samet JM, Utell MJ, and Wexler AS, US EPA particulate matter research centers: summary of research results for 2005–2011. Air Quality, Atmosphere & Health, 2013. 6(2): p. 333–355.
-
- Cahill TA, Cahill TM, Barnes DE, Spada NJ, and Miller R, Inorganic and Organic Aerosols Downwind of California’s Roseville Railyard. Aerosol Sci. Tech, 2011. 45(9): p. 1049–1059.
MeSH terms
Substances
Grants and funding
LinkOut - more resources
Full Text Sources
Other Literature Sources