

Hypertension Likely Drives Arteriolar Wall Thickening in Preclinical Diabetic Retinopathy While Diabetes Drives Wall Thickness in Clinical Retinopathy
- PMID: 38874974
- PMCID: PMC11182368
- DOI: 10.1167/tvst.13.6.8
Hypertension Likely Drives Arteriolar Wall Thickening in Preclinical Diabetic Retinopathy While Diabetes Drives Wall Thickness in Clinical Retinopathy
Abstract
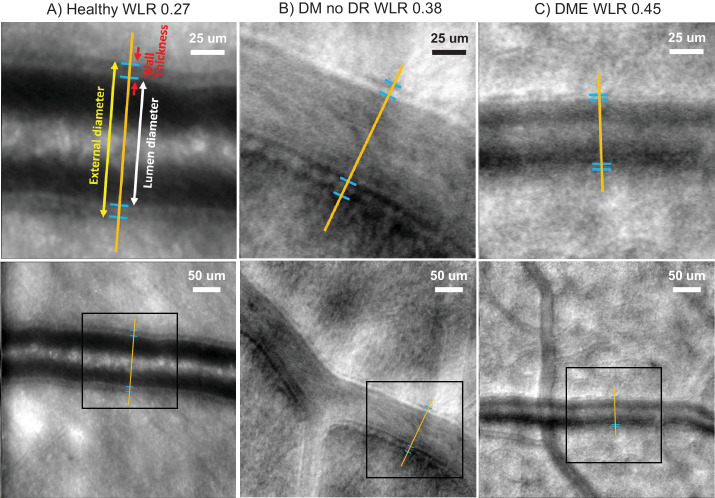
Purpose: Both hypertension and diabetes are known to increase the wall-to-lumen ratio (WLR) of retinal arterioles, but the differential effects are unknown. Here, we study the timing and relative impact of hypertension versus diabetes on the WLR in diabetic retinopathy (DR) to address this unresolved question.
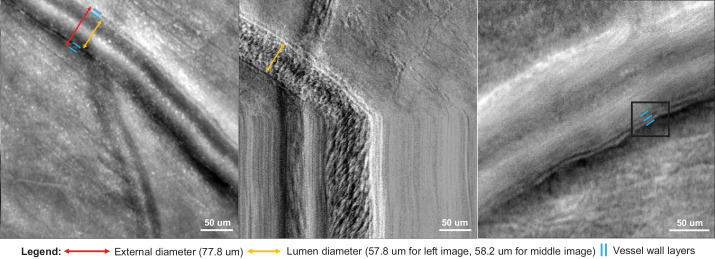
Methods: This prospective cross-sectional study compared the retinal arteriolar WLR in 17 healthy eyes, 15 with diabetes but no apparent DR (DM no DR), and 8 with diabetic macular edema (DME) and either nonproliferative or proliferative DR. We imaged each arteriole using adaptive optics scanning laser ophthalmoscopy and measured the WLR using ImageJ. Multiple linear regression (MLR) was performed to estimate the effects of hypertension, diabetes, and age on the WLR.
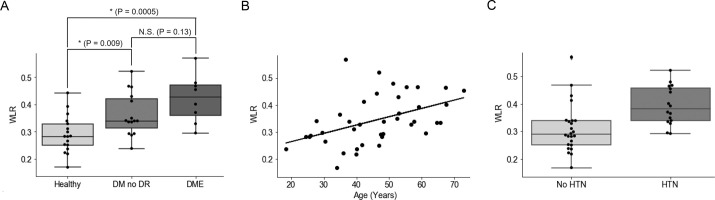
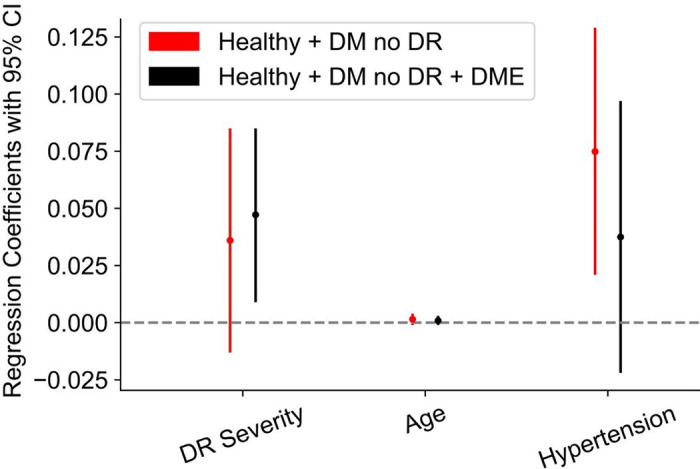
Results: Both subjects with DM no DR and subjects with DME had significantly higher WLR than healthy subjects (0.36 ± 0.08 and 0.42 ± 0.08 vs. 0.29 ± 0.07, 1-way ANOVA P = 0.0009). MLR in healthy subjects and subjects with DM no DR showed hypertension had the strongest effect (regression coefficient = 0.08, P = 0.009), whereas age and diabetes were not significantly correlated with WLR. MLR in all three groups together (healthy, DM no DR, and DME) showed diabetes had the strongest effect (regression coefficient = 0.05, P = 0.02), whereas age and hypertension were not significantly correlated with WLR.
Conclusions: Hypertension may be an early driver of retinal arteriolar wall thickening in preclinical DR, independent of age or diabetes, whereas changes specific to DR may drive wall thickening in DME and later DR stages.
Translational relevance: We offer a framework for understanding the relative contributions of hypertension and diabetes on the vascular wall, and emphasize the importance of hypertension control early in diabetes even before DR onset.
Conflict of interest statement
Disclosure:
Figures
Similar articles
-
Measurement of retinal wall-to-lumen ratio by adaptive optics retinal camera: a clinical research.Graefes Arch Clin Exp Ophthalmol. 2015 Nov;253(11):1985-95. doi: 10.1007/s00417-015-3115-y. Epub 2015 Aug 13. Graefes Arch Clin Exp Ophthalmol. 2015. PMID: 26267750
-
Retinal Arteriolar Wall Remodeling in Diabetes Captured With AOSLO.Transl Vis Sci Technol. 2023 Nov 1;12(11):16. doi: 10.1167/tvst.12.11.16. Transl Vis Sci Technol. 2023. PMID: 37962539 Free PMC article.
-
Characterizing Vascular Wall and Lumen Caliber in Eyes with Diabetic Retinopathy Based on Adaptive Optics Scanning Laser Ophthalmoscopy.Diagnostics (Basel). 2024 Sep 12;14(18):2020. doi: 10.3390/diagnostics14182020. Diagnostics (Basel). 2024. PMID: 39335699 Free PMC article.
-
Application of the Full-Width-at-Half-Maximum Image Segmentation Method to Analyse Retinal Vascular Changes in Patients with Diabetic Retinopathy.J Healthc Eng. 2022 Aug 8;2022:6726499. doi: 10.1155/2022/6726499. eCollection 2022. J Healthc Eng. 2022. PMID: 39296953 Free PMC article. Review.
-
Microcirculation in Hypertension: A Therapeutic Target to Prevent Cardiovascular Disease?J Clin Med. 2023 Jul 25;12(15):4892. doi: 10.3390/jcm12154892. J Clin Med. 2023. PMID: 37568294 Free PMC article. Review.
Cited by
-
Volumetric Measures of Capillary Nonperfusion on Optical Coherence Tomography Angiography Detect Early Ischemia in Diabetes Without Retinopathy.Invest Ophthalmol Vis Sci. 2025 Apr 1;66(4):2. doi: 10.1167/iovs.66.4.2. Invest Ophthalmol Vis Sci. 2025. PMID: 40168154 Free PMC article.
-
Advances in materials science for ocular diseases induced by cardiovascular risk factors.Front Bioeng Biotechnol. 2025 Jun 27;13:1618232. doi: 10.3389/fbioe.2025.1618232. eCollection 2025. Front Bioeng Biotechnol. 2025. PMID: 40657159 Free PMC article. Review.
References
-
- Fowler MJ. Microvascular and macrovascular complications of diabetes. Clin Diabetes. 2008; 26(2): 77–82.
-
- Wong TY, Mitchell P. Hypertensive retinopathy. N Engl J Med. 2004; 351(22): 2310–2317. - PubMed
-
- Grosso A, Cheung N, Veglio F, Wong TY.. Similarities and differences in early retinal phenotypes in hypertension and diabetes. J Hypertens. 2011; 29(9): 1667. - PubMed
MeSH terms
Grants and funding
LinkOut - more resources
Full Text Sources
Medical
