Acute neuromuscular, cardiovascular, and muscle oxygenation responses to low-intensity aerobic interval exercises with blood flow restriction
- PMID: 38875101
- PMCID: PMC11291873
- DOI: 10.1113/EP091742
Acute neuromuscular, cardiovascular, and muscle oxygenation responses to low-intensity aerobic interval exercises with blood flow restriction
Abstract
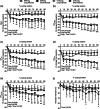
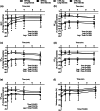
We investigated the influence of short- and long-interval cycling exercise with blood flow restriction (BFR) on neuromuscular fatigue, shear stress and muscle oxygenation, potent stimuli to BFR-training adaptations. During separate sessions, eight individuals performed short- (24 × 60 s/30 s; SI) or long-interval (12 × 120 s/60 s; LI) trials on a cycle ergometer, matched for total work. One leg exercised with (BFR-leg) and the other without (CTRL-leg) BFR. Quadriceps fatigue was quantified using pre- to post-interval changes in maximal voluntary contraction (MVC), potentiated twitch force (QT) and voluntary activation (VA). Shear rate was measured by Doppler ultrasound at cuff release post-intervals. Vastus lateralis tissue oxygenation was measured by near-infrared spectroscopy during exercise. Following the initial interval, significant (P < 0.05) declines in MVC and QT were found in both SI and LI, which were more pronounced in the BFR-leg, and accounted for approximately two-thirds of the total reduction at exercise termination. In the BFR-leg, reductions in MVC (-28 ± 15%), QT (-42 ± 17%), and VA (-15 ± 17%) were maximal at exercise termination and persisted up to 8 min post-exercise. Exercise-induced muscle deoxygenation was greater (P < 0.001) in the BFR-leg than CTRL-leg and perceived pain was more in LI than SI (P < 0.014). Cuff release triggered a significant (P < 0.001) shear rate increase which was consistent across trials. Exercise-induced neuromuscular fatigue in the BFR-leg exceeded that in the CTRL-leg and was predominantly of peripheral origin. BFR also resulted in diminished muscle oxygenation and elevated shear stress. Finally, short-interval trials resulted in comparable neuromuscular and haemodynamic responses with reduced perceived pain compared to long-intervals.
Keywords: arterial blood flow; blood flow restriction; central fatigue; interval exercise; interval training; peripheral fatigue; vascular occlusion.
© 2024 The Author(s). Experimental Physiology published by John Wiley & Sons Ltd on behalf of The Physiological Society.
Conflict of interest statement
None declared.
Figures


Similar articles
-
Blood flow restriction during self-paced aerobic intervals reduces mechanical and cardiovascular demands without modifying neuromuscular fatigue.Eur J Sport Sci. 2023 May;23(5):755-765. doi: 10.1080/17461391.2022.2062056. Epub 2022 May 14. Eur J Sport Sci. 2023. PMID: 35400303
-
Acute Neuromuscular Adaptations in Response to Low-Intensity Blood-Flow Restricted Exercise and High-Intensity Resistance Exercise: Are There Any Differences?J Strength Cond Res. 2018 Apr;32(4):902-910. doi: 10.1519/JSC.0000000000002022. J Strength Cond Res. 2018. PMID: 29570594 Clinical Trial.
-
Acute effects of exercise under different levels of blood-flow restriction on muscle activation and fatigue.Eur J Appl Physiol. 2016 May;116(5):985-95. doi: 10.1007/s00421-016-3359-1. Epub 2016 Mar 26. Eur J Appl Physiol. 2016. PMID: 27017495
-
Sprint training in hypoxia and with blood flow restriction: Controversies and perspectives.J Sports Sci. 2024 Oct 18:1-15. doi: 10.1080/02640414.2024.2416839. Online ahead of print. J Sports Sci. 2024. PMID: 39422258 Review.
-
Potential Local Mechanisms for Exercise-Induced Hypoalgesia in Response to Blood Flow Restriction Training.Cureus. 2023 Aug 9;15(8):e43219. doi: 10.7759/cureus.43219. eCollection 2023 Aug. Cureus. 2023. PMID: 37692724 Free PMC article. Review.
References
-
- Aboodarda, S. J. , Xin Yu Zhang, C. , Sharara, R. , Cline, M. , & Millet, G. Y. (2019). Exercise‐induced fatigue in one leg does not impair the neuromuscular performance in the contralateral leg but improves the excitability of the ipsilateral corticospinal pathway. Brain Sciences, 9(10), 250. - PMC - PubMed
-
- Aboodarda, S. J. , Iannetta, D. , Emami, N. , Varesco, G. , Murias, J. M. , & Millet, G. Y. (2020). Effects of pre‐induced fatigue vs. concurrent pain on exercise tolerance, neuromuscular performance and corticospinal responses of locomotor muscles. The Journal of Physiology, 598(2), 285–302. - PubMed
-
- Allen, D. G. , Lamb, G. D. , & Westerbald, H. (2008). Skeletal muscle fatigue: Cellular mechanisms. Physiological Reviews, 88(1), 287–332. - PubMed
-
- de Almeida Azevedo, R. , Cruz, R. , Couto, P. , Silva‐Cavalcante, M. D. , Boari, D. , Lima‐Silva, A. E. , Millet, G. Y. , & Bertuzzi, R. (2019). Characterization of performance fatigability during a self‐paced exercise. Journal of Applied Physiology, 127(3), 838–846. - PubMed
MeSH terms
LinkOut - more resources
Full Text Sources
Medical
