. 2024 Jun 14;20(6):e1010935.
doi: 10.1371/journal.pgen.1010935. eCollection 2024 Jun.

Interplay between Pitx2 and Pax7 temporally governs specification of extraocular muscle stem cells

Affiliations

Interplay between Pitx2 and Pax7 temporally governs specification of extraocular muscle stem cells

Mao Kuriki et al. PLoS Genet. .

Abstract

Gene regulatory networks that act upstream of skeletal muscle fate determinants are distinct in different anatomical locations. Despite recent efforts, a clear understanding of the cascade of events underlying the emergence and maintenance of the stem cell pool in specific muscle groups remains unresolved and debated. Here, we invalidated Pitx2 with multiple Cre-driver mice prenatally, postnatally, and during lineage progression. We showed that this gene becomes progressively dispensable for specification and maintenance of the muscle stem (MuSC) cell pool in extraocular muscles (EOMs) despite being, together with Myf5, a major upstream regulator during early development. Moreover, constitutive inactivation of Pax7 postnatally led to a greater loss of MuSCs in the EOMs compared to the limb. Thus, we propose a relay between Pitx2, Myf5 and Pax7 for EOM stem cell maintenance. We demonstrate also that MuSCs in the EOMs adopt a quiescent state earlier that those in limb muscles and do not spontaneously proliferate in the adult, yet EOMs have a significantly higher content of Pax7+ MuSCs per area pre- and post-natally. Finally, while limb MuSCs proliferate in the mdx mouse model for Duchenne muscular dystrophy, significantly less MuSCs were present in the EOMs of the mdx mouse model compared to controls, and they were not proliferative. Overall, our study provides a comprehensive in vivo characterisation of MuSC heterogeneity along the body axis and brings further insights into the unusual sparing of EOMs during muscular dystrophy.


Conflict of interest statement

The authors have declared that no competing interests exist.

Figures
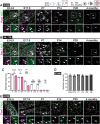
Fig 1
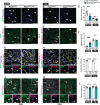
Fig 1. Postnatal extraocular myogenic cells exit the cell cycle earlier than those in TA muscle.
(A,B) Immunostaining for Pax7 (magenta) and Ki67 (green) at indicated stages from E14.5 to 4 months (4M) at the EOM, HL (E14.5, E17.5) or TA level (P7, 4 months). White arrowheads point to Ki67+Pax7+ cells, open arrowheads to Ki67-Pax7+ cells. Bottom panels, higher magnification views of the area delimited with dots. (C) Percentage of Ki67+Pax7+ cells in extraocular, HL and TA muscles at each stage (n = 3 per stage). (D) Percentage of Pitx2+Pax7+ cells over total Pax7+ stem cells at indicated stages from E14.5 to 4 months (4M) (n = 3 per stage). (E) Immunostaining for Pax7 (magenta) and Pitx2 (green) on EOM sections at indicated stages. White arrowheads point to Pitx2+Pax7+ cells. Bottom panels, higher magnification views of the area delimited with dots. Scale bars: 100μm (A), (B) and (E). Error bars represent mean ± SEM. Two-tailed unpaired Student’s t-test. ns, non-significant, P>0.05, *P<0.05, ***P<0.001, ****P<0.0001. EOM, extraocular muscle; HL, hindlimb; TA, Tibialis anterior. All recti EOMs were assessed.
Fig 2
Fig 2. Pax7 is critical for the maintenance of the extraocular MuSC pool postnatally.
(A, B) Immunostaining for GFP on EOM and TA muscle sections from Pax7nGFP/+ and Pax7nGFP/nGFP P20 mice. White arrowheads indicate GFP+ cells (green). (C) Number of GFP+ cells per area from the immunostaining in (A, B). (EOM n = 10, TA n = 8). (D, E) Immunostaining for GFP (green), together with Myod and Myogenin (MM) (magenta) on EOM and TA muscle sections from Pax7nGFP/+ and Pax7nGFP/nGFP P20 mice. White arrowheads indicate MM+GFP+ cells; open arrowheads MM-GFP+ cells. (F) Percentage of MM+GFP+ cells over total GFP+ cells from immunostaining in (D,E) (EOM n = 7, TA n = 5). (G,H) Immunostaining for GFP (green), Calcitonin receptor (CalcR) (magenta) and Laminin (white) on EOM and TA muscle sections from Pax7nGFP/+ and Pax7nGFP/nGFP P20 mice. Yellow arrowheads indicate CalcR+GFP+ cells; yellow open arrowheads indicate CalcR-GFP+ cells. Bottom panels, higher magnification views of the area delimited with dots. (I) Percentage of CalcR+GFP+ cells over total GFP+ cells from immunostaining in (G,H) (n = 3 each). (J,K) Immunostaining for GFP (green), together with Pitx2 (magenta) on EOM and TA muscle sections from Pax7nGFP/+ and Pax7nGFP/nGFP P20 mice. White arrowheads indicate Pitx2+GFP+ cells. Bottom panels, higher magnification views of the area delimited with dots. (L) Percentage of Pitx2+GFP+ cells over total GFP+ cells from immunostaining in (J, K) (EOM n = 8, TA n = 8). G/+: Pax7nGFP/+; G/G: Pax7nGFP/nGFP. Scale bars: 200μm (A) and (B), 100μm (D,E,G,H,J,K). Error bars represent mean±SEM. Two-tailed unpaired Student’s t-test. ns, non-significant, P>0.05, **P<0.01, ***P<0.001, ****P<0.0001. EOM, extraocular muscle; TA, Tibialis anterior. All recti EOMs were assessed.
Fig 3
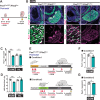
Fig 3. Deletion of Pitx2 in Myf5-positive cells impairs establishment of EOMs.
(A) Scheme summarising the timing of expression of Pitx2, Myf5 and Pax7 during EOM development from the anlage stage to individual muscles. (B) Whole-mount immunostaining of the EOM anlage of Myf5nlacZ embryos at (i) E10.5, (ii) E11.5, (iii) E11.75, (iv) E12.0 for Pax7 (red), β-gal (green) and Pitx2 (cyan). EOMs were segmented from adjacent head structures and 3D-reconstructed in Imaris. Yellow dashed lines indicate single Z-section level shown in (C). ncc, neural crest cells. Only few myogenic cells express Pax7 at E11.5 (white arrowheads). (D) Immunostaining of EOM sections from Myf5Cre;R26mTmG: Myf5nlacZ embryos at E11.5 (i, i’) and E14.5 (ii, ii’) for Pax7 (cyan), β-gal (red) and mGFP (green). White arrowheads in (i) and (ii) indicate mGFP+β-gal+ cells. White arrowheads in (i’) and (ii’) indicate Pax7+β-gal+ cells. White open arrowheads point to Pax7-β-gal+ cells. Right panels, higher magnification views of the area delimited with dots. (E) Percentage of β-gal+ and negative cells over total Pax7+ population in EOMs at E11.5 and E14.5 from the immunostaining in (D) (n = 3 each). (F, G) Immunostaining of E14.5 EOM sections from Myf5Cre;Pitx2flox/+ (control) and Myf5Cre;Pitx2flox/flox (KO) for Pax7 (magenta), Pitx2 (green) and MF20 (cyan) (F) and Myod and Myogenin (MM) (magenta), Pitx2 (green) and MF20 (cyan) (G). Bottom panels, higher magnification views of the area delimited with dots. Periocular mesenchyme (pom). Scale bars: 100μm (B,D), 40μm (C,i’-ii’), 50μm (C,iii’-iv’), 500μm (F,G). Error bars represent mean ± SEM. Two-tailed unpaired Student’s t-test. ****P<0.0001. EOM, extraocular muscle. All recti EOMs were assessed.
Fig 4
Fig 4. Normal EOM formation following deletion of Pitx2 in Myod-expressing cells.
(A) Immunostaining of E14.5 EOM sections from MyodiCre;Pitx2flox/+ (control) and MyodiCre;Pitx2flox/flox (KO) for Pax7 (magenta), Pitx2 (green) and MF20 (cyan). Bottom panels, higher magnification views of the area delimited with dots. (B) Number of Pax7+ cells per area in EOM sections from the immunostaining in (A) (n = 5 each). (C) Immunostaining of E14.5 EOM sections from MyodiCre;Pitx2flox/+ (control) and MyodiCre;Pitx2flox/flox (KO) for Myod and Myogenin (MM) (magenta), Pitx2 (green) and MF20 (cyan). Bottom panels, higher magnification views of the area delimited with dots. (D) Number of MM+ cells per area in EOM sections from immunostaining in (C) (n = 3). Scale bars: 500μm (A) and (B). Error bars represent mean ± SEM. Two-tailed unpaired Student’s t-test. ns, non-significant, P>0.05. EOM, extraocular muscle. All recti EOMs were assessed.
Fig 5
Fig 5. Postnatal ablation of Pax7+ cells results in major loss of myogenic cells in EOMs.
(A) Scheme indicating timing of Tamoxifen injections for ablation of Pax7-expressing cells postnatally. Tamoxifen was injected at P2 and P3, samples were collected at P8. (B,C) Immunostaining for Pax7 (magenta) on Pax7CreERT2;R26+/+ (control) and Pax7CreERT2;R26DTA/+ (ablated) EOM and TA sections. White arrowheads indicate Pax7+ cells. (D,E) Immunostaining for Myod and Myogenin (MM) (yellow) on Pax7CreERT2;R26+/+ (control) and Pax7CreERT2;R26DTA/+ (ablated) EOMs and TA sections. White arrowheads indicate MM+ cells. (F,G) Immunostaining for Calcitonin receptor (CalcR) (white) on Pax7CreERT2;R26+/+ (control) and Pax7CreERT2;R26DTA/+ (ablated) EOMs and TA sections. White arrowheads indicate CalcR+ cells. (H) Number of Pax7+ cells per area from immunostaining in (B, C) (Control, n = 3, Ablated, n = 3). (I) Number of MM+ cells per area from immunostaining in (D,E) (Control, n = 3, Ablated, n = 3). (J) Number of CalcR+ cells per area from immunostaining in (F,G) (Control, n = 3, Ablated, n = 3). Scale bars: 100μm in (B-E), 50μm in (F,G). Error bars represent mean ± SEM. Two-tailed unpaired Student’s t-test. **P<0.01, ***P<0.001. EOM, extraocular muscle; TA, Tibialis anterior. All recti EOMs were assessed.
Fig 6
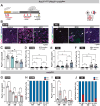
Fig 6. Timing of inactivation of Pitx2 differently impairs extraocular MuSCs.
(A) Scheme indicating timing of Tamoxifen injections for invalidation of Pitx2 during embryogenesis. Tamoxifen was injected at E11.5 and E12.5 to Pitx2flox/flox pregnant females crossed with Pax7CreERT2;Pitx2flox/+ male mice and samples collected at E17.5. (B) Immunostaining of E17.5 EOM sections from Pax7CreERT2;Pitx2flox/+ (control) and Pax7CreERT2;Pitx2flox/flox (cKO) foetuses for Pax7 (magenta), Pitx2 (green) and MF20(cyan). Bottom panels, higher magnification views of the area delimited with dots. White arrowheads indicate Pax7+Pitx2+ cells and white open arrowheads Pax7+Pitx2- cells. (C) Number of Pax7+ cells per area in EOM and hindlimb (HL) sections from immunostaining in (B) (n = 3 each). (D) Percentage of Ki67+Pax7+ cells over total Pax7+ cells in EOM and HL sections (n = 3 each). (E) Scheme indicating timing of Tamoxifen injections for invalidation of Pitx2 with Pax7CreERT2. Condition1: Tamoxifen was administered 3 times from P1-P7, at 2 months, and at 3 months. Condition2: Tamoxifen was administered 3 times from P20-P25, at 2 months, and at 3 months. Samples were collected at 4 months of age. (F) Number of Pax7+ cells per area in EOM sections from Condition 1 (n = 3 each). (G) Number of Pax7+ cells per area in EOM sections from Condition 2 (n = 3 each). Scale bars: 500μm (B). Error bars represent mean ± SEM. Two-tailed unpaired Student’s t-test. ns, non-significant, P>0.05, **P<0.01. EOM, extraocular muscle; TA, Tibialis anterior. All recti EOMs were assessed.
Fig 7
Fig 7. Absence of proliferation in EOM of mdx and mdx;Pitx2 KO mice.
(A) Scheme indicating timing of Tamoxifen injections on Pax7CreERT2;Pitx2flox; mdxβgeo and control mice at postnatal (3 times from P0-P7) and adult stages (every month). Samples were collected at 8 months and 1 year for analysis. (B) Immunostaining of EOM and TA sections from 1 year old control (Pitx2flox/flox or Pitx2flox/+), cKO (Pax7CreERT2;Pitx2flox/flox), mdxβgeo (MDX) and Pax7CreERT2;Pitx2flox/flox; mdxβgeo (dKO) mice for Pax7 (magenta) and Ki67 (green). White arrowheads point to Pax7+Ki67+ cells; open arrowheads to Pax7+Ki67- cells. (C) Number of Pax7+ cells per area on EOM sections from immunostaining in (B) (Control, n = 7, MDX, n = 4; cKO, n = 7; dKO, n = 6). (D) Percentage of Ki67+Pax7+ cells over total Pax7+cells on EOM sections from immunostaining in (B) (Control, n = 7, MDX, n = 5; cKO, n = 7; dKO, n = 4). (E) Number of Pax7+ cells per area on TA sections from immunostaining in (B) (Control, n = 7, MDX, n = 5; cKO, n = 7; dKO, n = 5). (F) Percentage of Ki67+Pax7+ cells over Pax7+cells on TA sections from immunostaining in (B) (Control, n = 7, MDX, n = 5; cKO, n = 7; dKO, n = 5). In (C),(D),(G),(H), the entire EOMs were counted. In (E),(F),(I),(J), in TA counting was done on a random area for controls and in the damaged/regenerating area of MDX and DKO. 1 year old animals were littermates. 8-month-old mice, dKO and control mice were littermates while MDX were generated in independent litters. All mice were treated with Tamoxifen. (G) Number of Pax7+ cells per area on EOM sections from immunostaining at indicated stages from 4 months (4M) to 2 years (2yrs). (4M, n = 3, 8M, n = 5, 2yrs, n = 3). (H) Percentage of Ki67+Pax7+ cells over total Pax7+ cells on EOM sections at indicated stages from 4M to 2yrs (4M, n = 3, 8M, n = 5, 2yrs, n = 3). (I) Number of Pax7+ cells per area on TA sections at indicated stages from 4M to 2yrs. (4M, n = 3, 8M, n = 5, 2yrs, n = 3). (J) Percentage of Ki67+Pax7+ cells over total Pax7+cells on TA sections at indicated stages from 4M to 2yrs. (4M, n = 3, 8M, n = 5, 2yrs, n = 3). Scale bars: 100μm in (B). Error bars represent mean ± SEM. Two-way ANOVA with Dunnett post-hoc test. ns, non-significant, P>0.05, *P<0.05, **P<0.01. EOM, extraocular muscles, TA, Tibialis anterior. All recti EOMs were assessed.
Fig 8
Fig 8. Stage dependent interplay between Pitx2 and Pax7 in the EOMs.
Schemes summarising the principal findings of this study. Pitx2 becomes progressively dispensable for regulation of the EOM stem cell pool whereas constitutive inactivation of Pax7 showed a greater loss of muscle stem cells in EOM postnatally compared to limb. Significant loss of myogenic cells occurred in EOMs following DTA-ablation of Pax7+ cells, with no rescue by a Pax7-negative population in this scenario. Finally, significantly less MuSCs are present in EOM compared to the limb in dystrophic mdx mice.

Similar articles

Cited by

References

    1. Comai G, Tajbakhsh S. Molecular and cellular regulation of skeletal myogenesis. Curr Top Dev Biol. 2014;110:1–73. doi: 10.1016/B978-0-12-405943-6.00001-4 . - DOI - PubMed
    1. Grimaldi A, Tajbakhsh S. Diversity in cranial muscles: Origins and developmental programs. Curr Opin Cell Biol. 2021;73:110–6. Epub 20210906. doi: 10.1016/j.ceb.2021.06.005 . - DOI - PubMed
    1. Grimaldi A, Comai G, Mella S, Tajbakhsh S. Identification of bipotent progenitors that give rise to myogenic and connective tissues in mouse. Elife. 2022;11. Epub 20220228. doi: 10.7554/eLife.70235 ; PubMed Central PMCID: PMC9020825. - DOI - PMC - PubMed
    1. Noden DM, Francis-West P. The differentiation and morphogenesis of craniofacial muscles. Dev Dyn. 2006;235(5):1194–218. doi: 10.1002/dvdy.20697 . - DOI - PubMed
    1. Suzuki DG, Fukumoto Y, Yoshimura M, Yamazaki Y, Kosaka J, Kuratani S, et al.. Comparative morphology and development of extra-ocular muscles in the lamprey and gnathostomes reveal the ancestral state and developmental patterns of the vertebrate head. Zoological Lett. 2016;2:10. Epub 20160414. doi: 10.1186/s40851-016-0046-3 ; PubMed Central PMCID: PMC4831119. - DOI - PMC - PubMed

MeSH terms