

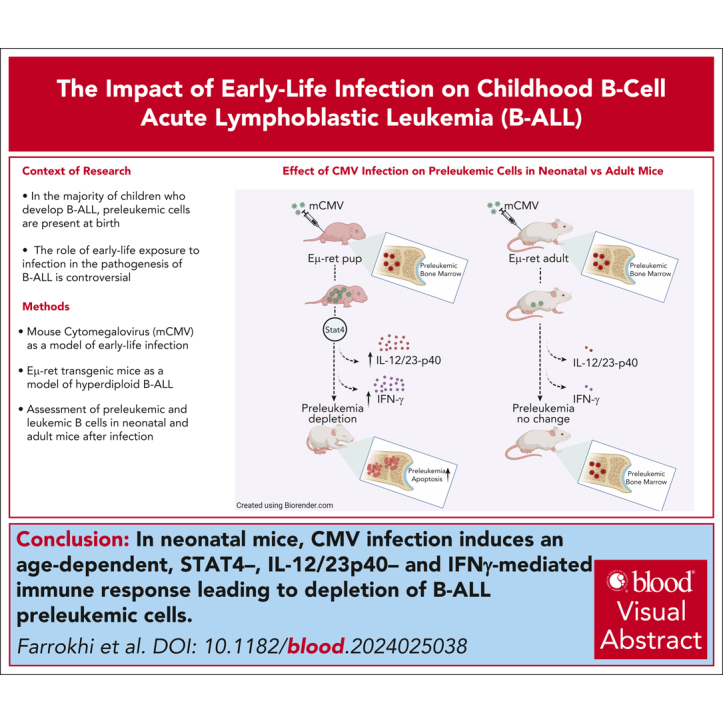
Early-life infection depletes preleukemic cells in a mouse model of hyperdiploid B-cell acute lymphoblastic leukemia
- PMID: 38875504
- PMCID: PMC11375503
- DOI: 10.1182/blood.2024025038
Early-life infection depletes preleukemic cells in a mouse model of hyperdiploid B-cell acute lymphoblastic leukemia
Abstract
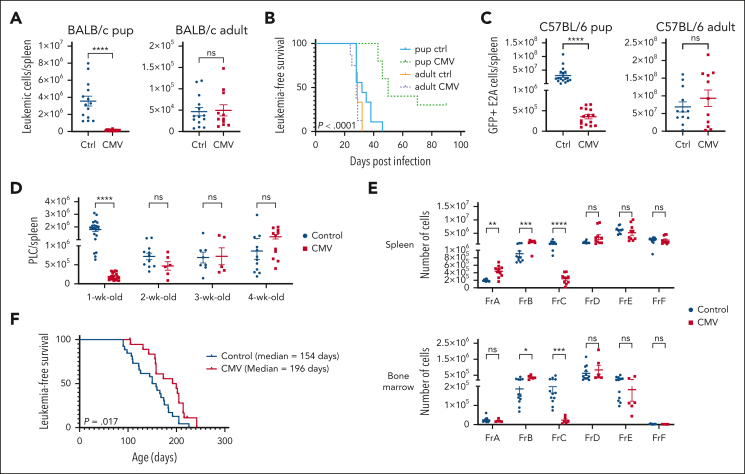
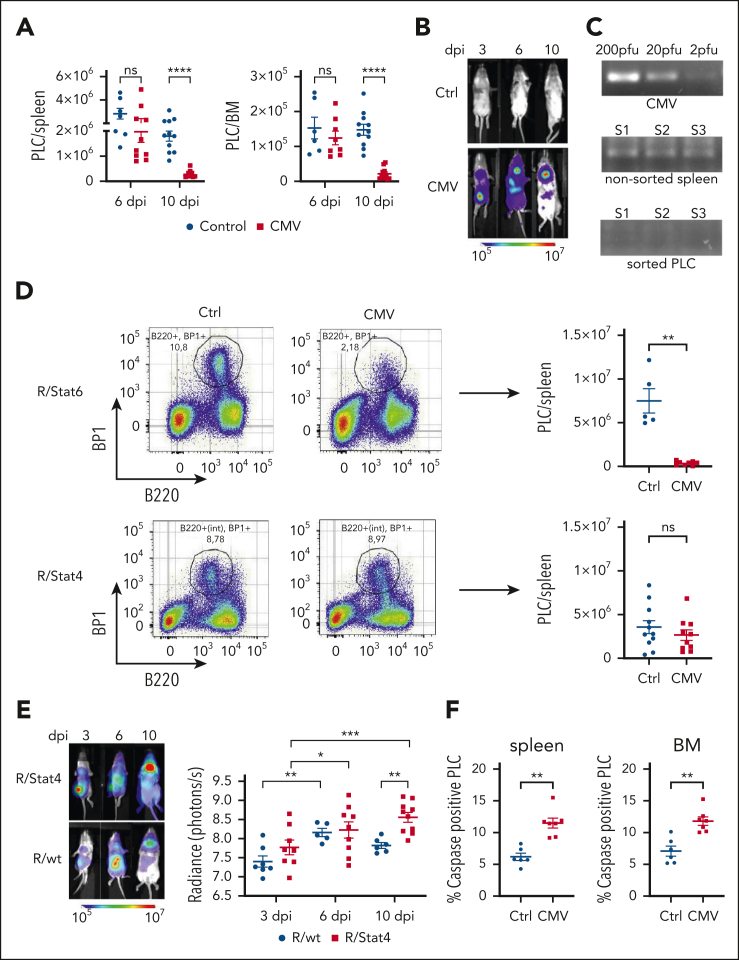
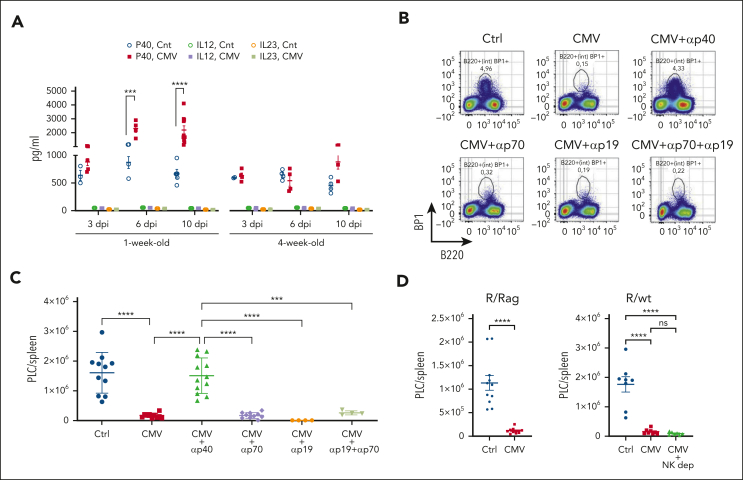
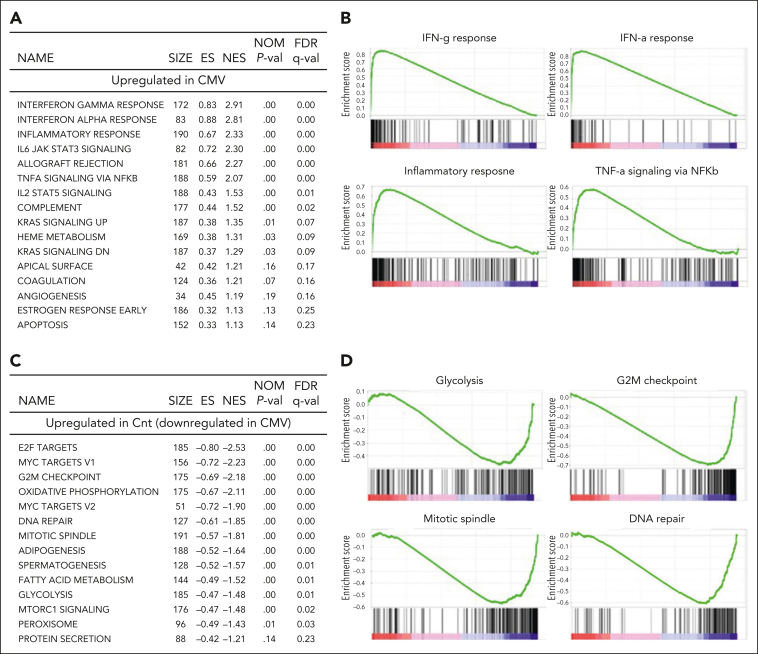
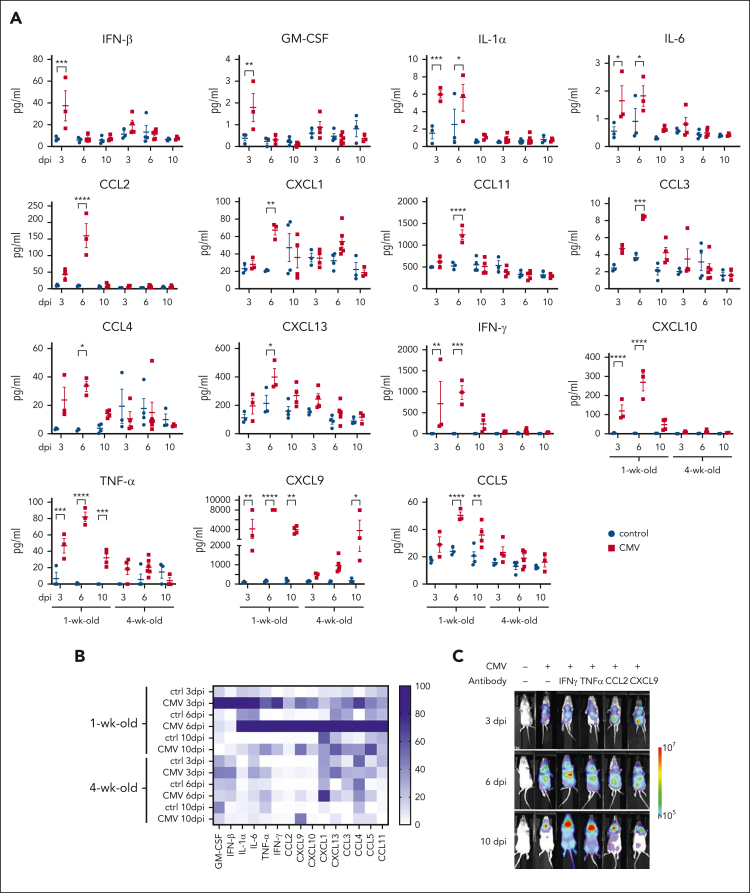
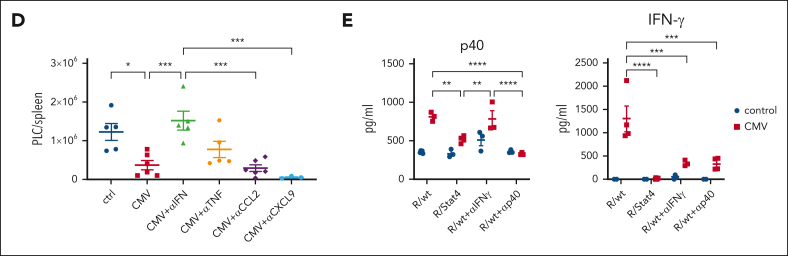
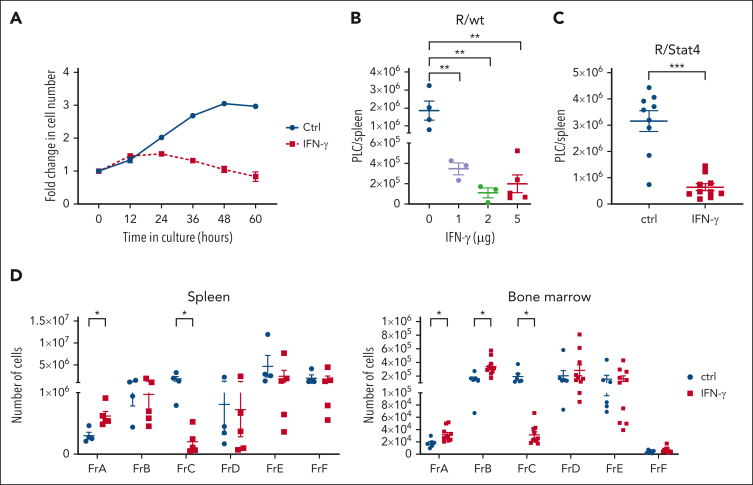
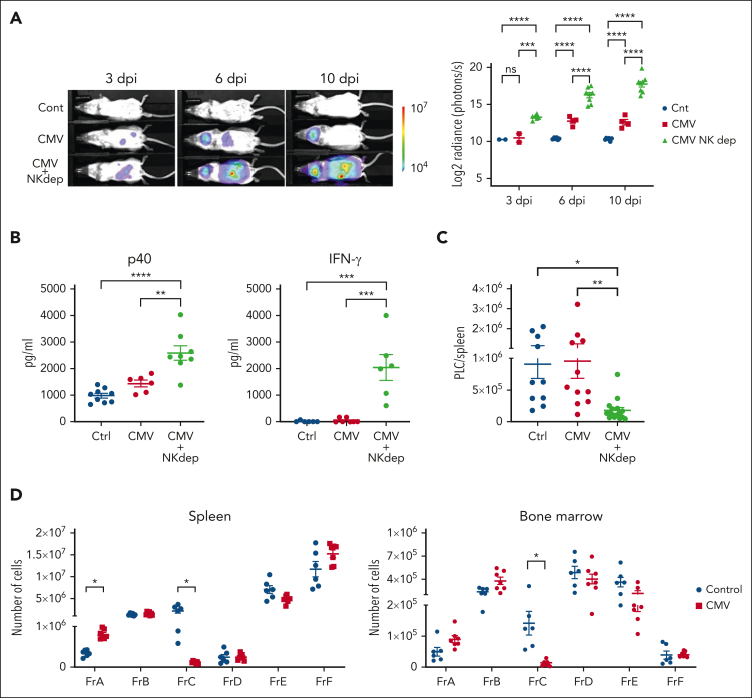
Epidemiological studies report opposing influences of infection on childhood B-cell acute lymphoblastic leukemia (B-ALL). Although infections in the first year of life appear to exert the largest impact on leukemia risk, the effect of early pathogen exposure on the fetal preleukemia cells (PLC) that lead to B-ALL has yet to be reported. Using cytomegalovirus (CMV) infection as a model early-life infection, we show that virus exposure within 1 week of birth induces profound depletion of transplanted E2A-PBX1 and hyperdiploid B-ALL cells in wild-type recipients and in situ-generated PLC in Eμ-ret mice. The age-dependent depletion of PLC results from an elevated STAT4-mediated cytokine response in neonates, with high levels of interleukin (IL)-12p40-driven interferon (IFN)-γ production inducing PLC death. Similar PLC depletion can be achieved in adult mice by impairing viral clearance. These findings provide mechanistic support for potential inhibitory effects of early-life infection on B-ALL progression and could inform novel therapeutic or preventive strategies.
© 2024 American Society of Hematology. Published by Elsevier Inc. Licensed under Creative Commons Attribution-NonCommercial-NoDerivatives 4.0 International (CC BY-NC-ND 4.0), permitting only noncommercial, nonderivative use with attribution. All other rights reserved.
Conflict of interest statement
Conflict-of-interest disclosure: S.G. received research funding from Moderna, Merck, VBI, Pfizer, GSK, Altona Diagnostics, and Meridian Biosciences; and consulting fees from Moderna, Merck, GSK, and Curevo. The remaining authors declare no competing financial interests.
Figures
Comment in
-
Childhood leukemia prevention within reach.Blood. 2024 Aug 22;144(8):799-800. doi: 10.1182/blood.2024025622. Blood. 2024. PMID: 39172445 No abstract available.
Similar articles
-
The Eμ-Ret mouse is a novel model of hyperdiploid B-cell acute lymphoblastic leukemia.Leukemia. 2024 May;38(5):969-980. doi: 10.1038/s41375-024-02221-x. Epub 2024 Mar 22. Leukemia. 2024. PMID: 38519798 Free PMC article.
-
Discordance of MLL-rearranged (MLL-R) infant acute lymphoblastic leukemia in monozygotic twins with spontaneous clearance of preleukemic clone in unaffected twin.Blood. 2009 Jun 25;113(26):6691-4. doi: 10.1182/blood-2009-01-202259. Epub 2009 May 1. Blood. 2009. PMID: 19411627 Free PMC article.
-
IFN-γ directly inhibits murine B-cell precursor leukemia-initiating cell proliferation early in life.Eur J Immunol. 2017 May;47(5):892-899. doi: 10.1002/eji.201646806. Epub 2017 Apr 11. Eur J Immunol. 2017. PMID: 28295300
-
Childhood B-Cell Preleukemia Mouse Modeling.Int J Mol Sci. 2022 Jul 8;23(14):7562. doi: 10.3390/ijms23147562. Int J Mol Sci. 2022. PMID: 35886910 Free PMC article. Review.
-
The advances of E2A-PBX1 fusion in B-cell acute lymphoblastic Leukaemia.Ann Hematol. 2024 Sep;103(9):3385-3398. doi: 10.1007/s00277-023-05595-7. Epub 2023 Dec 27. Ann Hematol. 2024. PMID: 38148344 Review.
Cited by
-
Early Infection Incidence and Risk of Acute Leukemia Development Among Mexican Children.Cancers (Basel). 2025 Feb 21;17(5):733. doi: 10.3390/cancers17050733. Cancers (Basel). 2025. PMID: 40075581 Free PMC article.
References
Publication types
MeSH terms
LinkOut - more resources
Full Text Sources
Molecular Biology Databases
Miscellaneous
