Microbial Proxies for Anoxic Microsites Vary with Management and Partially Explain Soil Carbon Concentration
- PMID: 38875507
- PMCID: PMC11223465
- DOI: 10.1021/acs.est.4c01882
Microbial Proxies for Anoxic Microsites Vary with Management and Partially Explain Soil Carbon Concentration
Abstract
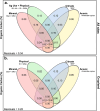
Anoxic microsites are potentially important but unresolved contributors to soil organic carbon (C) storage. How anoxic microsites vary with soil management and the degree to which anoxic microsites contribute to soil C stabilization remain unknown. Sampling from four long-term agricultural experiments in the central United States, we examined how anoxic microsites varied with management (e.g., cultivation, tillage, and manure amendments) and whether anoxic microsites determine soil C concentration in surface (0-15 cm) soils. We used a novel approach to track anaerobe habitat space and, hence, anoxic microsites using DNA copies of anaerobic functional genes over a confined volume of soil. No-till practices inconsistently increased anoxic microsite extent compared to conventionally tilled soils, and within one site organic matter amendments increased anaerobe abundance in no-till soils. Across all long-term tillage trials, uncultivated soils had ∼2-4 times more copies of anaerobic functional genes than their cropland counterparts. Finally, anaerobe abundance was positively correlated to soil C concentration. Even when accounting for other soil C protection mechanisms, anaerobe abundance, our proxy for anoxic microsites, explained 41% of the variance and 5% of the unique variance in soil C concentration in cropland soils, making anoxic microsites the strongest management-responsive predictor of soil C concentration. Our results suggest that careful management of anoxic microsites may be a promising strategy to increase soil C storage within agricultural soils.
Keywords: anoxic microsites; carbon; oxygen; redox; soil organic carbon; soils.
Conflict of interest statement
The authors declare no competing financial interest.
Figures


Similar articles
-
Consider the Anoxic Microsite: Acknowledging and Appreciating Spatiotemporal Redox Heterogeneity in Soils and Sediments.ACS Earth Space Chem. 2023 Aug 23;7(9):1592-1609. doi: 10.1021/acsearthspacechem.3c00032. eCollection 2023 Sep 21. ACS Earth Space Chem. 2023. PMID: 37753209 Free PMC article. Review.
-
Effects of moisture and physical disturbance on pore-scale oxygen content and anaerobic metabolisms in upland soils.Sci Total Environ. 2021 Aug 1;780:146572. doi: 10.1016/j.scitotenv.2021.146572. Epub 2021 Mar 19. Sci Total Environ. 2021. PMID: 33774307
-
Microbial central carbon metabolism in a tidal freshwater marsh and an upland mixed conifer soil under oxic and anoxic conditions.Appl Environ Microbiol. 2024 Jun 18;90(6):e0072424. doi: 10.1128/aem.00724-24. Epub 2024 May 21. Appl Environ Microbiol. 2024. PMID: 38771053 Free PMC article.
-
Microbial necromass in cropland soils: A global meta-analysis of management effects.Glob Chang Biol. 2023 Apr;29(7):1998-2014. doi: 10.1111/gcb.16613. Epub 2023 Feb 7. Glob Chang Biol. 2023. PMID: 36751727
-
Carbon sequestration in European croplands.SEB Exp Biol Ser. 2005:47-55. SEB Exp Biol Ser. 2005. PMID: 17633030 Review.
Cited by
-
Vulnerability of mineral-organic associations in the rhizosphere.Nat Commun. 2025 Jul 1;16(1):5527. doi: 10.1038/s41467-025-61273-4. Nat Commun. 2025. PMID: 40593896 Free PMC article. Review.
References
-
- Friedman D.; Hubbs M.; Tugel A.; Seybold C.; Sucik M.. Guidelines for Soil Quality Assessment in Conservation Planning; Natural Resources Conservation Service Soil Quality Institute, 2001; pp 1–38.
-
- Stott D. E.Recommended Soil Health Indicators and Associated Laboratory Procedures;Soil Health Technical Note No. 450–03; U.S. Department of Agriculture, Natural Resources Conservation Service, 2019.
-
- Minasny B.; Malone B. P.; McBratney A. B.; Angers D. A.; Arrouays D.; Chambers A.; Chaplot V.; Chen Z. S.; Cheng K.; Das B. S.; Field D. J.; Gimona A.; Hedley C. B.; Hong S. Y.; Mandal B.; Marchant B. P.; Martin M.; McConkey B. G.; Mulder V. L.; O’Rourke S.; Richer-de-Forges A. C.; Odeh I.; Padarian J.; Paustian K.; Pan G.; Poggio L.; Savin I.; Stolbovoy V.; Stockmann U.; Sulaeman Y.; Tsui C. C.; Vågen T. G.; van Wesemael B.; Winowiecki L. Soil Carbon 4 per Mille. Geoderma 2017, 292, 59–86. 10.1016/j.geoderma.2017.01.002. - DOI
-
- Paustian K.; Larson E.; Kent J.; Marx E.; Swan A. Soil C Sequestration as a Biological Negative Emission Strategy. Frontiers in Climate 2019, 1, 1–11. 10.3389/fclim.2019.00008. - DOI
MeSH terms
Substances
LinkOut - more resources
Full Text Sources

