

Machine Learning-Based Time in Patterns for Blood Glucose Fluctuation Pattern Recognition in Type 1 Diabetes Management: Development and Validation Study
- PMID: 38875568
- PMCID: PMC11041419
- DOI: 10.2196/45450
Machine Learning-Based Time in Patterns for Blood Glucose Fluctuation Pattern Recognition in Type 1 Diabetes Management: Development and Validation Study
Abstract
Background: Continuous glucose monitoring (CGM) for diabetes combines noninvasive glucose biosensors, continuous monitoring, cloud computing, and analytics to connect and simulate a hospital setting in a person's home. CGM systems inspired analytics methods to measure glycemic variability (GV), but existing GV analytics methods disregard glucose trends and patterns; hence, they fail to capture entire temporal patterns and do not provide granular insights about glucose fluctuations.
Objective: This study aimed to propose a machine learning-based framework for blood glucose fluctuation pattern recognition, which enables a more comprehensive representation of GV profiles that could present detailed fluctuation information, be easily understood by clinicians, and provide insights about patient groups based on time in blood fluctuation patterns.
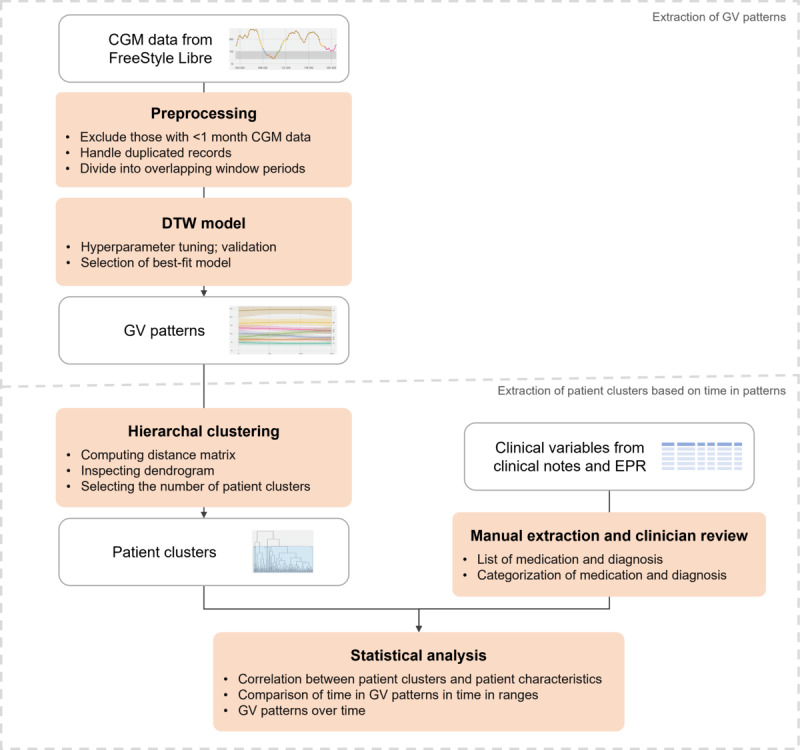
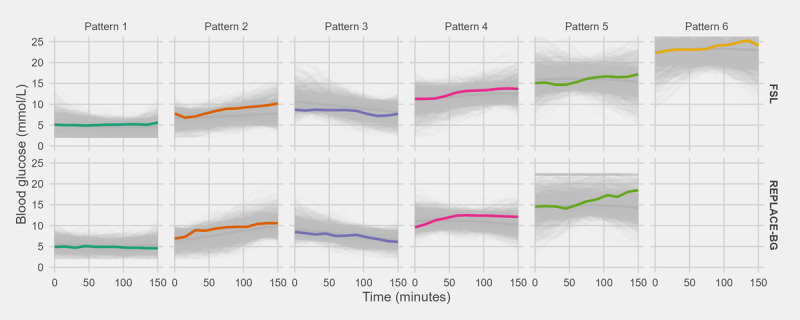
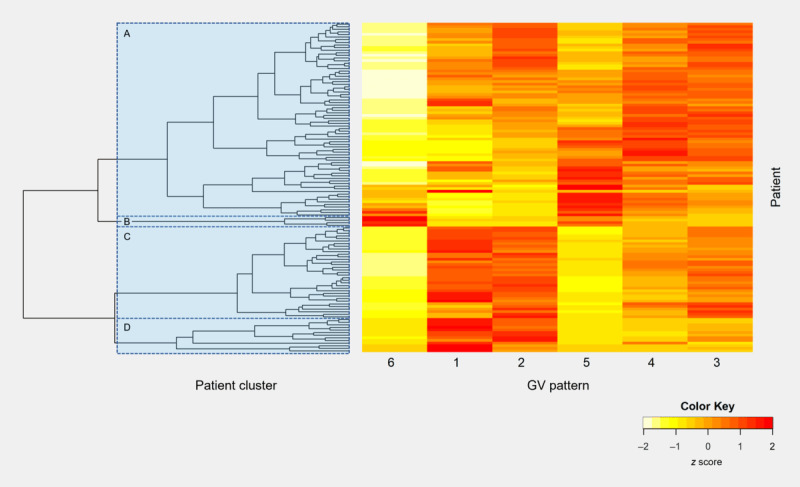
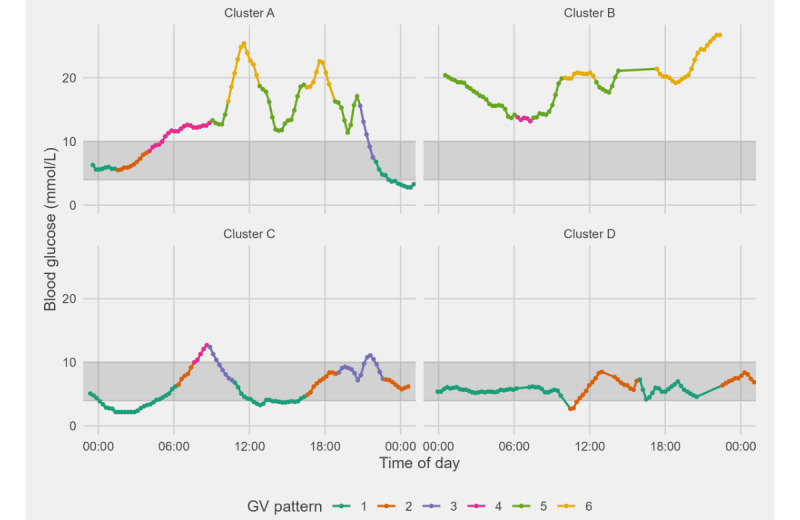
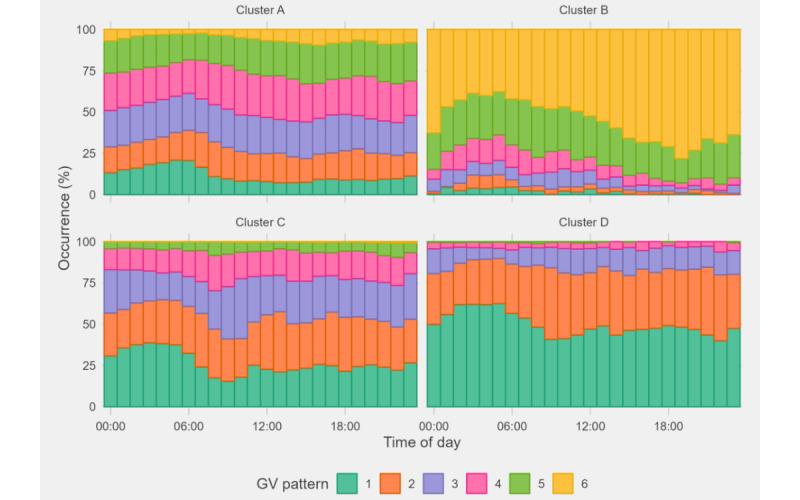
Methods: Overall, 1.5 million measurements from 126 patients in the United Kingdom with type 1 diabetes mellitus (T1DM) were collected, and prevalent blood fluctuation patterns were extracted using dynamic time warping. The patterns were further validated in 225 patients in the United States with T1DM. Hierarchical clustering was then applied on time in patterns to form 4 clusters of patients. Patient groups were compared using statistical analysis.
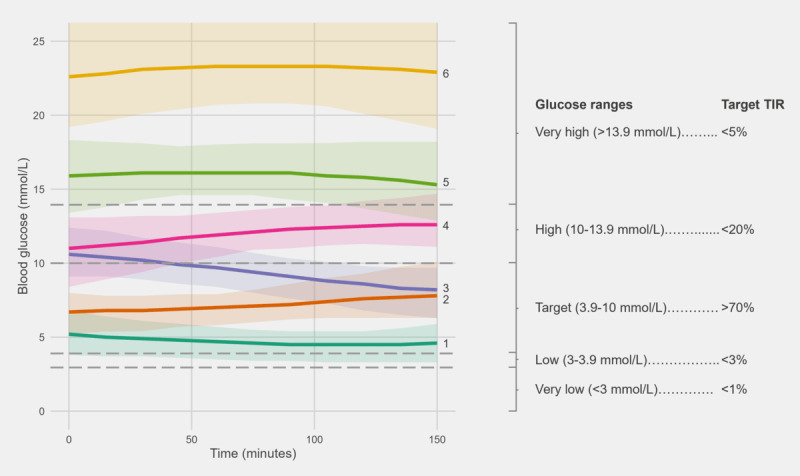
Results: In total, 6 patterns depicting distinctive glucose levels and trends were identified and validated, based on which 4 GV profiles of patients with T1DM were found. They were significantly different in terms of glycemic statuses such as diabetes duration (P=.04), glycated hemoglobin level (P<.001), and time in range (P<.001) and thus had different management needs.
Conclusions: The proposed method can analytically extract existing blood fluctuation patterns from CGM data. Thus, time in patterns can capture a rich view of patients' GV profile. Its conceptual resemblance with time in range, along with rich blood fluctuation details, makes it more scalable, accessible, and informative to clinicians.
Keywords: continuous glucose monitoring; diabetes mellitus; glucose fluctuation pattern; glycemic variability; scalable metrics; temporal clustering.
©Nicholas Berin Chan, Weizi Li, Theingi Aung, Eghosa Bazuaye, Rosa M Montero. Originally published in JMIR AI (https://ai.jmir.org), 26.05.2023.
Conflict of interest statement
Conflicts of Interest: None declared.
Figures
References
-
- IDF Diabetes Atlas 10th edition. International Diabetes Federation. 2021. [2022-09-26]. https://diabetesatlas.org/atlas/tenth-edition/ - PubMed
-
- Global health estimates: Leading causes of death. Cause-specific mortality, 2000–2019. World Health Organization. 2020. [2022-09-26]. https://www.who.int/data/gho/data/themes/mortality-and-global-health-est... .
-
- Juvenile Diabetes Research Foundation Continuous Glucose Monitoring Study Group. Tamborlane WV, Beck RW, Bode BW, Buckingham B, Chase HP, Clemons R, Fiallo-Scharer R, Fox LA, Gilliam LK, Hirsch IB, Huang ES, Kollman C, Kowalski AJ, Laffel L, Lawrence JM, Lee J, Mauras N, O'Grady M, Ruedy KJ, Tansey M, Tsalikian E, Weinzimer S, Wilson DM, Wolpert H, Wysocki T, Xing D. Continuous glucose monitoring and intensive treatment of type 1 diabetes. N Engl J Med. 2008 Oct 02;359(14):1464–76. doi: 10.1056/NEJMoa0805017.NEJMoa0805017 - DOI - PubMed
-
- Reddy N, Verma N, Dungan K. Monitoring technologies- continuous glucose monitoring, mobile technology, biomarkers of glycemic control. Endotext. 2020. Aug 16, [2022-09-26]. https://www.ncbi.nlm.nih.gov/books/NBK279046/
-
- Foster NC, Beck RW, Miller KM, Clements MA, Rickels MR, DiMeglio LA, Maahs DM, Tamborlane WV, Bergenstal R, Smith E, Olson BA, Garg SK. State of type 1 diabetes management and outcomes from the T1D exchange in 2016-2018. Diabetes Technol Ther. 2019 Feb;21(2):66–72. doi: 10.1089/dia.2018.0384. https://europepmc.org/abstract/MED/30657336 - DOI - PMC - PubMed
LinkOut - more resources
Full Text Sources
