. 2024 Jul 9;57(7):1648-1664.e9.
doi: 10.1016/j.immuni.2024.05.018. Epub 2024 Jun 13.

Microbiota dictate T cell clonal selection to augment graft-versus-host disease after stem cell transplantation

Affiliations

Microbiota dictate T cell clonal selection to augment graft-versus-host disease after stem cell transplantation

Albert C Yeh et al. Immunity. .

Abstract

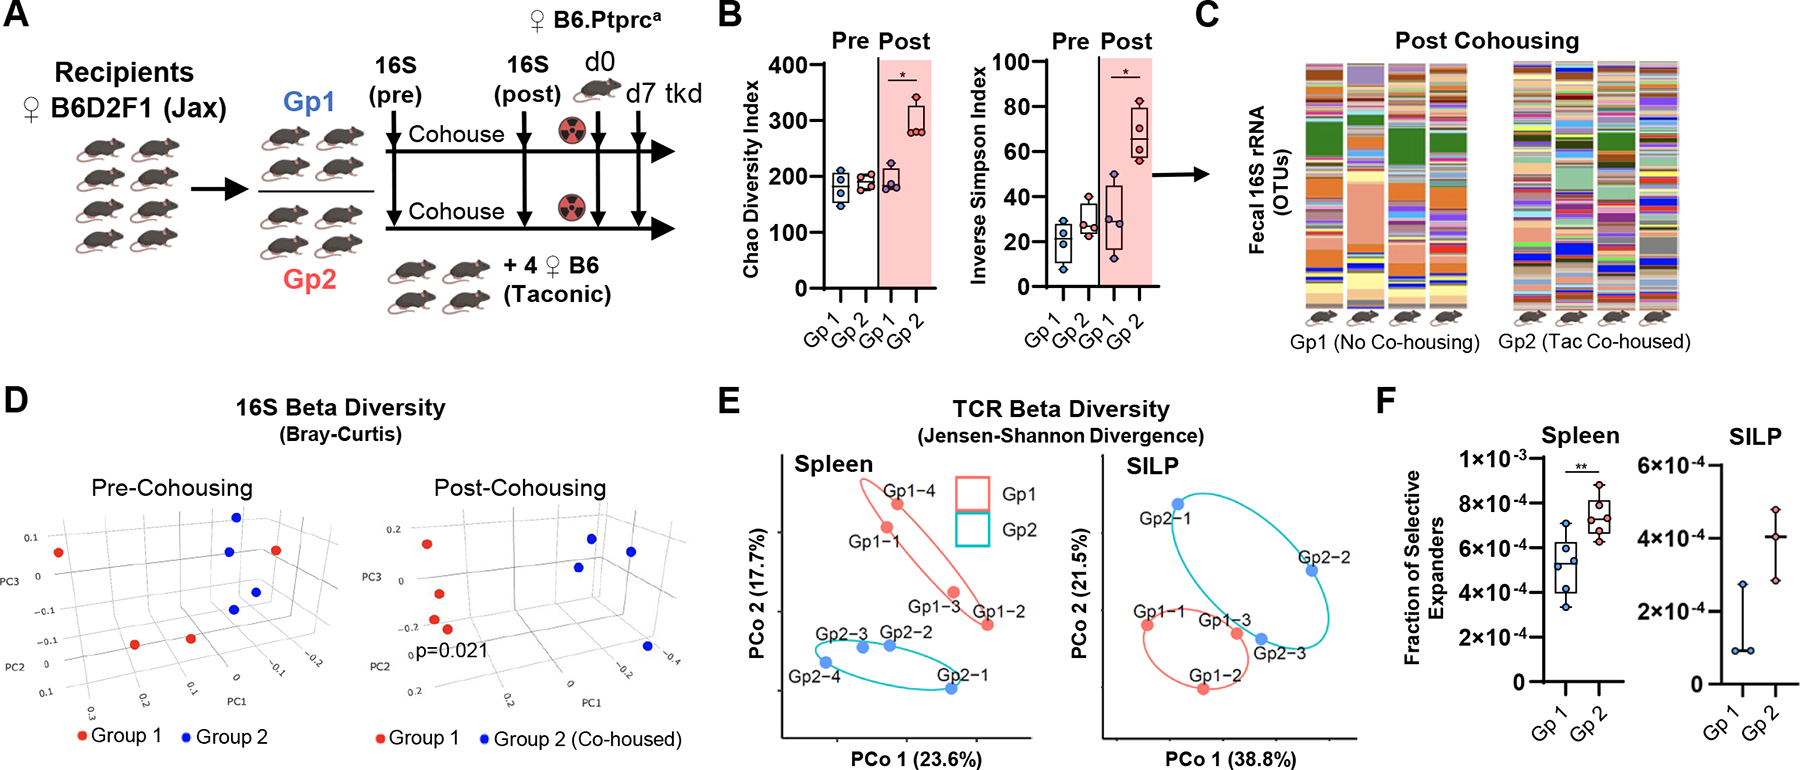
Allogeneic T cell expansion is the primary determinant of graft-versus-host disease (GVHD), and current dogma dictates that this is driven by histocompatibility antigen disparities between donor and recipient. This paradigm represents a closed genetic system within which donor T cells interact with peptide-major histocompatibility complexes (MHCs), though clonal interrogation remains challenging due to the sparseness of the T cell repertoire. We developed a Bayesian model using donor and recipient T cell receptor (TCR) frequencies in murine stem cell transplant systems to define limited common expansion of T cell clones across genetically identical donor-recipient pairs. A subset of donor CD4+ T cell clonotypes differentially expanded in identical recipients and were microbiota dependent. Microbiota-specific T cells augmented GVHD lethality and could target microbial antigens presented by gastrointestinal epithelium during an alloreactive response. The microbiota serves as a source of cognate antigens that contribute to clonotypic T cell expansion and the induction of GVHD independent of donor-recipient genetics.

Keywords: CD4(+) T cell; GVHD; T cell repertoire; graft-versus-host disease; histocompatibility; microbiome; microbiota T cells; stem cell transplant.


Conflict of interest statement

Declaration of interests G.R.H. has consulted for Generon Corporation, NapaJen Pharma, iTeos Therapeutics, and Neoleukin Therapeutics and has received unrelated research funding from Compass Therapeutics, Syndax Pharmaceuticals, Applied Molecular Transport, Serplus Technology, Heat Biologics, Laevoroc Oncology, iTeos Therapeutics, Genentech, and CSL Behring.

Figures

Figure 1.
Figure 1.. A CD4+ dependent GVHD system predictably models T cell clonal structure across matched and mismatched transplants.
(A) B6.Ptprca (CD45.1+, H-2b, I-Ab, I-ENull) mice were used as donor grafts for three B6D2F1 (F1) (Group 1, CD45.2+, H-2b/d, I-Ab/d, I-Ed) and three BALB.b (Group 2, H-2b, I-Ab, I-ENull) littermates. As control, B6.TEa (CD45.1+, Rag1−/−, H-2b, I-Ab, I-ENull) mice were used as donor graft for three F1 recipients. 2×10⁶, 5×10⁶, and 2×10⁶ CD4+ MACS-sorted T cells were injected to each mouse in groups 1, 2, and 3 respectively following TBI conditioning at day −1. Recipient spleens from each group were collected at day 7 post-transplant for TCRβ amplicon sequencing. (B) TCRβ clonal structure derived from sequencing the same donor pool used for groups 1 and 2 with 652,099 donor templates modeled by an exponential decay function between the TCR clone size (x-axis) and clone frequency (y-axis). These log-log plots exhibit a slope representing the transformed rate of decay. (C) TCR clonal structure of sequenced donor CD4+ T cells from both F1 and BALB.b recipients. Recipients show a slower rate of decay, suggesting a more highly expanded repertoire compared to the donor pool. Data from 1 experiment. (D) Clonal structure of TCRβ seq results from two healthy human PBMCs. Publicly available human TCRβ data sets were used (see Method Details). Approximately 74% of TCRs from each patient were singlets. (E) TCR sequencing of B6.TEa donor mice and F1 recipients. Recovery of rearranged TCR was over 99.7% in the donor and 99.1% in all recipients. (F) Overview of TRBV and TRBJ gene usage for all samples and tSNE plot of B6.Ptprca donor sample using TCRdist. (G) TRBV gene usage for all B6D2F1 recipients show skewing towards TRBV19–01. Color map is based on relative density to donor pool. (H) TRBV gene usage for all BALB.b recipients show skewing towards TRBV26–01. (I,J) Overlap of unique CDR3 sequences amongst Group 1 (F1) and Group 2 (BALB.b) recipients show that 0.16% and 0.52% of TCR clonotypes are present in all recipients within each group respectively.
Figure 2.
Figure 2.. A probabilistic model of post-transplant TCR expansion using a twin-transplant system identifies differentially expanded clonotypes across genetically identical donor-recipient pairs.
(A) TCR clonotypes represented in the donor pool and all three F1 recipients from Fig 1A show clusters of TCRs with enriched densities in recipient subsets (gray, donor; red, recipient 1; blue, recipient 2; green, recipient 3). Hierarchical clustering of normalized cell counts show TCRs enriched in each subgroup (donor: cluster 5; recipient 1: cluster 3; recipient 2: cluster 1; recipient 3: cluster 4). (B) Sample TCR clonotype present in F1 recipients but not in BALB.b recipients. Within the F1 recipients this clonotype comprised 5,679, 124, and 0 templates per 100,000 TCRs in respective recipients. (C) Sample TCR clonotype present in BALB.b recipients but not in F1 recipients. Within the BALB.b recipients this clonotype comprised 0, 874, and 3.6 templates per 100,000 TCRs in respective recipients. (D) Schematic illustrating the effects of partitioning stochasticity (scenario 1) from donor T cell variation vs. differential expansion (scenario 2) driving disparate TCR frequencies seen between identical recipients. (E) Schematic of a “twin-transplant” system with a single donor pool and two genetically identical co-housed recipients. Count size probabilities for all donated TCR clonotypes are inferred by deep sequencing of the donor T cell pool. (F) Expansion rate calculated for each TCR clonotype in the system assuming equal expansion (null hypothesis) between the two recipient mice. (G) The probability distribution of all final expected frequencies found in each recipient is calculated for each TCR clonotype after simulation of possible donor count splits. (H) Analytic schema for all twin-transplant systems in F1 and BALB.b recipients. All combination of recipients in each group were analyzed for differentially expanded TCR clonotypes. Clonotypes with an FDR < 0.05 are denoted in red (y-axis). Difference in TCR expression between each recipient pair are shown (x-axis). Data from 1 experiment. (I) P-values and sequenced TCR frequencies are shown for the top 20 differentially expressed TCRs (selective expanders) between a recipient pair (group 1–1 and group 1–2) as referenced from (H). Clonotype counts denoted for donor, recipient 1 (R1), and recipient 2 (R2) (Table S1 for all pairs). See also Figure S1.
Figure 3.
Figure 3.. Antibiotic treatment depletes selectively expanded donor T cells.
(A) Classification of donor TCR clonotype behavior for a twin-transplant system. Non-expanders (both recipient TCR fractions ≤ donor fraction), expander (either recipient TCR fraction > donor fraction), and selective expanders (differential expansion of donor TCRs between recipient pair). (B) B6.Ptprca mice were used as donor grafts for 12 female F1 recipients co-housed into 4 groups. Two groups were pre-treated with oral antibiotics from day −14 to day 7, and two groups were treated with low-dose (900cGy TBI) instead of high-dose (1300cGy TBI) conditioning. At day 0, each recipient received 2×10⁶ CD4+ donor T cells (CD45.1+) and 5×10⁶ bone marrow cells (B6, CD45.2+). At day 6, all recipients received an injection of 5×10⁵ non-alloreactive Marilyn CD4+ T cells. Spleen and ileum lamina propria (SILP) were harvested at day 7 for donor T cell sequencing. (C) Analysis schema representing individual twin-transplant systems (black arrows) for possible recipient pairs. (D) Both the number and fraction of selective expanders (out of unique recipient TCR clonotypes) identified amongst twin-transplant systems show that mice treated with peri-transplant antibiotics harbor significantly fewer selective expanders (p<0.0001). Each point represents a result from a twin-transplant system. This effect was seen in both the spleen and SILP compartments. Conditioning intensity differences did not alter the fraction of selective expanders across twin-transplant systems. Data from 1 experiment. (E) Beta diversity metrics were calculated using the Jensen-Shannon divergence between TCR repertoire pairs (Spleen N=57,983 random TCRs per sample, PERMANOVA p=0.005; SILP N=119,738, p=0.1) and illustrated via principal coordinate analysis (PCo). (F) Identification of CDR3 clonotypes using ALICE show that selective expanders are significantly enriched in TCRs that are more likely to respond to specific immune stimuli compared to non-expanders (p<0.0001) and expanders (p<0.0001) in both splenic and SILP compartments. (G) Clustering of TCRs that appear in specificity groups using GLIPH2 show a similar enrichment in selective expanders compared to non-expanders (p=0.0008) and expanders (p<0.0001). (H) Selective expanders have a significantly shorter CDR3 length compared to non-expanders (p<0.0001) and expanders (p<0.0001) in both splenic and SILP compartments. (I) 12–14 amino acid length CDR3 regions represented for all TCRs sequenced across the 12 F1 recipient spleen samples. (J) The first and last 4 amino acid residues were truncated to calculate the average entropy, polarity, hydrophobicity, charge, volume, and surface propensity for the remaining amino acid residues. See also Figures S2–S4.
Figure 4.
Figure 4.. Microbiota diversification increases selectively expanded donor T cells.
(A) Eight F1 Jackson-derived recipients were co-housed for 2 weeks prior to separation into two groups (group 1, additional 4 weeks co-housing amongst each other; group 2, additional 4 weeks co-housing with 4 B6 Taconic-derived mice). 5×10⁶ bone marrow cells derived from B6 donor mice along with 2×10⁶ B6.Ptprca CD4+ splenic T cells were transferred, with recipient TBI conditioning on day −1. Donor T cells were sorted from the spleen on day 7. Fecal material was taken from each recipient before and after cohousing for 16S rRNA sequencing. (B) Alpha diversity indices of fecal material show that co-housed Jackson mice (group 2) exhibited a higher level of diversity following co-housing compared to non-co-housed Jackson mice (group 1). (C) Sequencing results for groups 1 and 2 post-cohousing (OTUs denoted by color). (D) 16S beta diversity amongst pre- and post-cohousing timepoints between groups 1 and 2 measured via Bray-Curtis dissimilarity (Pre co-housing PERMANOVA p=0.09; post co-housing p=0.021), illustrated using PCo. (E) TCR beta diversity metrics in the post co-housing timepoint between groups 1 and 2 were calculated via Jensen-Shannon divergence between repertoire pairs (Spleen N=75,000 random TCRs per sample, PERMANOVA p=0.13; SILP N=10,799, p=0.3). (F) Compared to non-cohoused Jackson mice, co-housed mice receiving donor graft contained a higher proportion of selective expanders in the spleen (p<0.01) and SILP. Data from 1 experiment. See also Figure S6.
Figure 5.
Figure 5.. Microbiota-targeting donor T cells selectively expand in recipients with increased antigenic burden and augment GVHD.
(A) Taconic B6 and F1 mice harbored increased abundance of SFB-specific CD4+ T cells (DVQFSGAVPNKTD I-Ab tetramer+) compared to Jackson B6 and F1 SILP at baseline (Jax N=3, Tac N=4). (B,C) 1×10⁴ or 1×10⁶ donor B6.SFB Tg T cells were transplanted into Jackson and Taconic B6 (1100 cGy d-1 conditioning) or F1 (1300 cGy) mice along with 2×10⁶ polyclonal donor CD4+ T cells. (D,E) Donor SFB T cells were found to be significantly more expanded in the SILP of Taconic vs. Jackson mice in both B6 and F1 recipients at day 8 at 1×10⁴ donor titrations (B6 and F1, Tac N=4, Jax N=4, p<0.05) and at 1×10⁶ donor titrations (F1, Tac N=4, Jax N=4, p<0.05). Data from 1 experiment. (F) 0.5 × 10⁶ CD4+ donor Marilyn (Allo) T cells and/or 1×10⁶ donor MACS-sorted CD4+ microbiota-specific (CBir1 or SFB) T cells were transplanted into male B6 recipients. All recipients were conditioned with 1100cGy on day −1 and received 5×10⁶ bone marrow cells on day 0. (G,H) 0.5×10⁶ CD4+ Marilyn (Allo) T cells (blue, solid, N=10), 1×10⁶ SFB T cells (green, solid, N=5), or both Allo and SFB T cells (red, solid, N=10) were transplanted into Taconic B6 male recipients or Jackson B6 male recipients (red, dashed, N=5). (G) GVHD survival. There was a decrease in overall survival in the Taconic recipients receiving with both Allo and SFB T cells compared to other subgroups (p<0.0001). Data from 2 replicate experiments. (H) GVHD scores including T cell depleted (TCD, N=5) control (black, N=5) and Jackson B6 receiving only Allo T cells (blue, empty, N=5). (I) PCR results for B6 Taconic recipients using CBir1 (F,R) and 16S (F,R) control primers. (J,K) 0.5×10⁶ Allo T cells (blue, solid, N=10) alone, with 1×10⁶ CBir1 T cells (red, solid, N=10), with 1×10⁶ CD4+ Polyclonal B6 T cells (red, dashed, N=5), or 1×10⁶ CBir1 T cells alone (green, solid, N=5) were transplanted into Taconic male B6 recipients. All recipients received 5×10⁶ B6 bone marrow cells. (J) GVHD survival. There was a decrease in overall survival in the Taconic male recipients treated with both Allo and CBir1 T cells compared to Allo T cells alone, Allo T with Polyclonal T cells, or CBir1 T cells alone (p<0.0001). Data from 2 replicate experiments. (K) GVHD scores including TCD control (black, solid, N=5).
Figure 6.
Figure 6.. Alloreactivity promotes early activation phenotype and TNF response in microbiota-specific donor T cells which preferentially expand in the GI compartment.
(A) Male B6.Ptprca (CD45.1, Taconic) were divided into 3 groups representing exposure to different donor grafts (group 1, N=3: 0.5×10⁶ CD4+ Marilyn (Allo) Tg (CD45.2+/CD90.1+); group 2, N=4: 0.5×10⁶ Allo T with 1×10⁶ CD4+ CBir1 T (CD45.2+/CD90.2+); group 3, N=3: 1×10⁶ CD4+ CBir1 T). All recipients received 5×10⁶ B6 (CD45.1+) bone marrow. Hashed and sorted splenocytes were harvested at day 6 to isolate Allo T (CD45.2+/CD45.1neg/CD90.1+) and CBir1 T (CD45.2+/CD45.1neg/CD90.1neg/Vβ14+) T cells for single cell RNA sequencing. (B) Dimensional reduction using UMAP to visualize gene expression profiling for all groups, including subplots of CBir1 and Allo T cells expressing the corresponding TCRα/β chain and CBir1 tetramer binding. (C) Analysis of single cell clusters show a significant shift of donor CBir1 T cell phenotype when Allo T cells are concurrently introduced (CBir1 T group 2 vs. 3 for cluster 1, p<1×10⁻⁵; CBir1 T group 2 vs. 3 for cluster 0, p<1×10⁻⁵). Data from 1 experiment. (D) Percentage and intensity of gene expression shown by cluster. (E) GSEA Hallmark analysis including cluster 0 and 1 show an increase in TNF response genes and a decrease in oxidative phosphorylation in cluster 0. Pathways with FDR < 0.05 and |NES| (Normalized Enrichment Score) >5 are shown. (F) Serum cytokine analysis at day 5 for male B6 mice receiving CBir1 + Allo T cells (red) or CBir1 T cells (blue) (G) Cytokine analysis at day 6 for male B6 mice receiving CBir1 + Allo T cells (red), and female B6 mice receiving CBir1 + Marilyn (syngeneic) T cells (blue). (H) Intracellular cytokine analysis was performed on CBir1 T cells (CD45.2+/CD45.1neg/CD90.1neg/CD4+/CD8neg/Vβ14+/CBir1 Tet+) and Allo T cells (CD45.2+/CD45.1neg/CD90.1+/CD4+/CD8neg/Vβ6+) isolated from recipient spleen 5 days post-transplant. Cells were stimulated for 4 hours with PMA/ionomycin. CBir1 T cells expressed higher levels of IFNγ in the presence vs. absence of Allo T cells (p=.0079, Geometric MFI). Data from 1 experiment. (I) 1×10⁶ CBir1 T cells with 0.5 × 10⁶ Marilyn (Allo) T cells (red) or without Allo T cells (blue) were transplanted into Taconic B6.Ptprca male recipients. Recipients conditioned with 1100cGy on day −1 and received 5×10⁶ B6.Ptprca bone marrow cells on day 0. Quantification of donor CBir1 T cells in recipient spleen and mesenteric lymph node (mLN) at days 5 and 6 post-transplant are shown. (J) Intracellular cytokine analysis was performed on CBir1 and Allo T cells isolated from recipient mLN on day 5. Cells were stimulated for 4 hours with PMA/ionomycin prior to analysis. CBir1 T cells expressed higher levels of IFNγ in the presence vs. absence of Allo T cells (p=.0079, Geometric MFI). Data from 1 experiment. (K) 5 recipient male B6.Ptprca mice received 5×10⁶ B6 bone marrow, 0.3×10⁶ Allo T cells, and 5 ×10⁶ CBir1 CD4+ T cells. Quantification of donor CBir1 T cells in recipient mLN, ileum, colon, skin, and liver at day 9 is shown as fraction of all donor T cells detected. Data from 1 experiment.
Figure 7.
Figure 7.. Presentation of bacterial peptide by ileal epithelium is augmented by the alloreactive response and depends on MHC class II expression.
(A) SFB TCR reporter hybridoma was generated from transducing 58α-/β- NFAT-GFP murine T hybridoma cell line with MP71 vector containing 7B8 SFB TCR α/β and mCD4 followed by clonal selection (blue square). (B) SFB reporter hybridomas were plated on a 96-well plate at a density of 5×10⁴ cells per well and were imaged in co-culture for GFP expression over time. (C-E) Two groups of recipient male B6s received 5×10⁶ B6 bone marrow with 0.5×10⁶ Allo T cells (group 2, red, N=4) or without Allo T cells (group 1, blue, N=3). The intestinal epithelial cells (IEC) of the terminal ileum was harvested at day 6 and sorted (CD326+/CD45neg) for downstream co-culture. (C) I-Ab expression was higher in the epithelium of recipient mice in the presence of alloreactive response. Data from 2 replicate experiments. (D) SFB reporter hybridomas were plated at 5×10⁴ cells per well with 1μg/mL of DVQ SFB peptide followed by addition of 5×10⁵ epithelial cells (group 1, group 2, N=4), or no additional cells (control, N=2). Reporter hybridomas were imaged for GFP expression. Representative images taken from the GFP channel at 1, 8, 16, and 24-hours post co-culture. (E) Hybridoma GFP expression analyzed over time showed increased signal when co-cultured with IEC derived from Allo T recipients. Data from 2 replicate experiments. (F) I-Ab-loxP x Villin-Cre ERT2 recipient mice treated with 1mg tamoxifen I.P. daily from d-10 to d-6 prior to transplant. Group 1 (blue, N=3) was Villin-Cre+ and received 0.5×10⁶ donor Marilyn (Allo) T cells. Group 2 (red, N=3) was Villin-Creneg and received 0.5×10⁶ Allo T cells. Group 3 (green, N=2) was Villin-Cre+ without Allo T cells. The epithelial cell layer of the ileum was harvested at day 6 and sorted for downstream co-culture. (G) I-Ab expression on sorted epithelial cells from the terminal ileum (CD45neg/CD326+) confirmed class II knockout in group 1 (Villin-Cre+) vs. group 2 (Villin-Creneg), both of which received Allo T cells. Group 3 (Villin-Creneg) did not received Allo T cells had low-intermediate I-Ab expression. (H) Hybridoma GFP expression showed increased signal when co-cultured with DVQ peptide and IECs derived from Allo T Cre negative but not Cre+ recipients. Data from 1 experiment. (I) V4J33 RNA in-situ hybridization (ISH) probe used to visualize CBir1 Tg donor T cells vs. B6 wildtype donor T cells. (J) 40x cross-sectional representative imaging of terminal ileum harvested at day 6 from male B6 mice receiving CBir1 T cells alone or CBir1 with Allo T cells. Visualization of DAPI (blue), CD3 (red), and V4J33 RNA ISH probe (yellow). (K) The number of CBir1+ T cells as detected by co-localization of V4J33 probe and CD3 stain and fraction of total nucleated cells are shown for recipients of CBir1 T cells (blue, N=4) and both CBir1 and Allo T cells (red, N=5). Data from 1 experiment.

References

    1. Goulmy E, Schipper R, Pool J, Blokland E, Falkenburg JH, Vossen J, Gratwohl A, Vogelsang GB, van Houwelingen HC, and van Rood JJ (1996). Mismatches of minor histocompatibility antigens between HLA-identical donors and recipients and the development of graft-versus-host disease after bone marrow transplantation. N. Engl. J. Med 334, 281–285. 10.1056/NEJM199602013340501. - DOI - PubMed
    1. Zeiser R, and Blazar BR (2017). Acute Graft-versus-Host Disease - Biologic Process, Prevention, and Therapy. N. Engl. J. Med 377, 2167–2179. 10.1056/NEJMra1609337. - DOI - PMC - PubMed
    1. Davis MM, and Boyd SD (2019). Recent progress in the analysis of αβT cell and B cell receptor repertoires. Current Opinion in Immunology 59, 109–114. 10.1016/j.coi.2019.05.012. - DOI - PMC - PubMed
    1. Meier J, Roberts C, Avent K, Hazlett A, Berrie J, Payne K, Hamm D, Desmarais C, Sanders C, Hogan KT, et al. (2013). Fractal organization of the human T cell repertoire in health and after stem cell transplantation. Biol. Blood Marrow Transplant 19, 366–377. 10.1016/j.bbmt.2012.12.004. - DOI - PubMed
    1. DeWolf S, Grinshpun B, Savage T, Lau SP, Obradovic A, Shonts B, Yang S, Morris H, Zuber J, Winchester R, et al. (2018). Quantifying size and diversity of the human T cell alloresponse. JCI Insight 3. 10.1172/jci.insight.121256. - DOI - PMC - PubMed

Publication types

MeSH terms

Substances

LinkOut - more resources